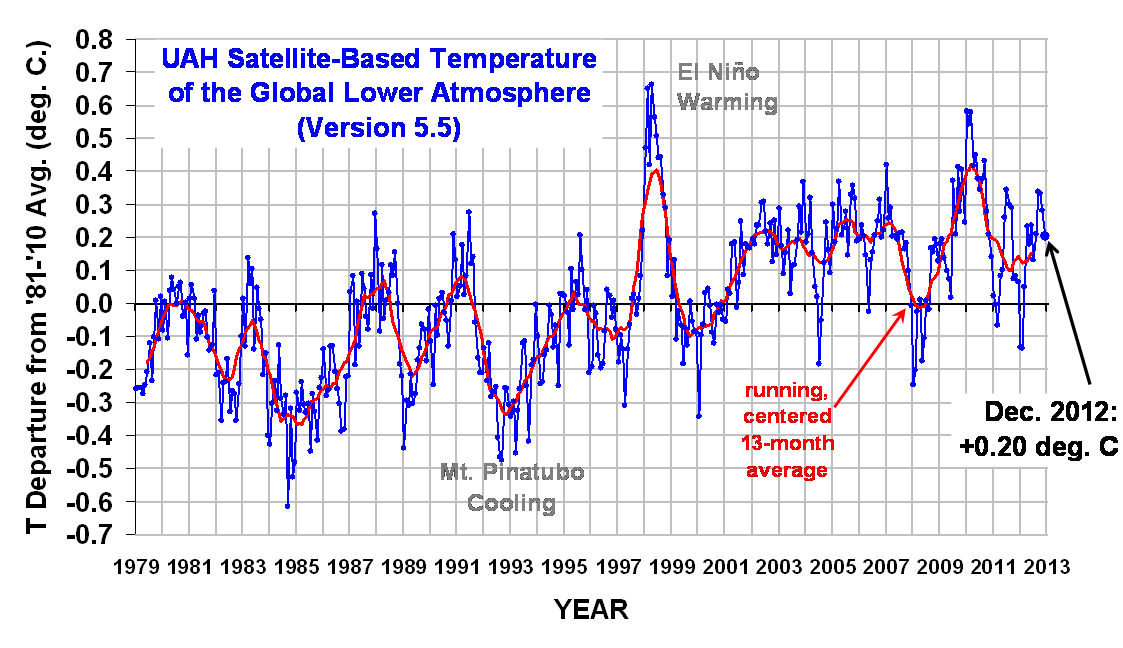
Our Version 5.5 global average lower tropospheric temperature (LT) anomaly for December, 2012 is +0.20 deg. C (click for large version):

The global, hemispheric, and tropical LT anomalies from the 30-year (1981-2010) average for 2012 are:
YR MON GLOBAL NH SH TROPICS
2012 1 -0.134 -0.065 -0.203 -0.256
2012 2 -0.135 +0.018 -0.289 -0.320
2012 3 +0.051 +0.119 -0.017 -0.238
2012 4 +0.232 +0.351 +0.114 -0.242
2012 5 +0.179 +0.337 +0.021 -0.098
2012 6 +0.235 +0.370 +0.101 -0.019
2012 7 +0.130 +0.256 +0.003 +0.142
2012 8 +0.208 +0.214 +0.202 +0.062
2012 9 +0.339 +0.350 +0.327 +0.153
2012 10 +0.333 +0.306 +0.361 +0.109
2012 11 +0.282 +0.299 +0.265 +0.172
2012 12 +0.202 +0.142 +0.261 +0.134
ANN AVG +0.161 +0.225 +0.097 -0.033
Globally, 2012 was the 9th warmest of the last 34 years, behind 1998, 2002, 2003, 2005, 2006, 2007, 2009, and 2010:
1979 through 2012, ranked from warmest to coolest:
1. 1998 0.419
2. 2010 0.394
3. 2005 0.260
4. 2002 0.218
5. 2009 0.218
6. 2007 0.202
7. 2003 0.187
8. 2006 0.186
9. 2012 0.161
10. 2011 0.130
11. 2004 0.108
12. 2001 0.107
13. 1991 0.020
14. 1987 0.013
15. 1995 0.013
16. 1988 0.012
17. 1980 -0.008
18. 2008 -0.009
19. 1990 -0.022
20. 1981 -0.045
21. 1997 -0.049
22. 1999 -0.056
23. 1983 -0.061
24. 2000 -0.061
25. 1996 -0.076
26. 1994 -0.108
27. 1979 -0.170
28. 1989 -0.207
29. 1986 -0.244
30. 1993 -0.245
31. 1982 -0.250
32. 1992 -0.289
33. 1985 -0.309
34. 1984 -0.353
The following comments are from John Christy:
While 2012 was only the ninth warmest year globally, it was the warmest year on record for both the contiguous 48 U.S. states and for the continental U.S., including Alaska. For the U.S., 2012 started with one of the three warmest Januaries in the 34-year record, saw a record-setting March heat wave, and stayed warm enough for the rest of the year to set a record.
Compared to seasonal norms, March 2012 was the warmest month on record in the 48 contiguous U.S. states. Temperatures over the U.S. averaged 2.82 C (almost 5.1° Fahrenheit) warmer than normal in March; the warmest spot on the globe that month was in northern Iowa. The annual average temperature over the conterminous 48 states in 2012 was 0.555 C (about 0.99 degrees F) warmer than seasonal norms.
Compared to seasonal norms, the coolest area on the globe throughout 2012 was central Mongolia, where temperatures averaged about 1.39 C (about 2.5 degrees Fahrenheit) cooler than seasonal norms. The warmest area was north of central Russia in the Kara Sea, where temperatures averaged 2.53 C (about 4.55 degrees Fahrenheit) warmer than seasonal norms for 2012.
Compared to seasonal norms, over the past month the coldest area on the globe was eastern Mongolia, where temperatures were as much as 4.55 C (about 8.19 degrees Fahrenheit) cooler than seasonal norms. The “warmest” area was off the coast of the Antarctic near South America, where temperatures averaged 3.79 C (about 6.82 degrees Fahrenheit) warmer than seasonal norms for December.
Archived color maps of local temperature anomalies are available on-line at http://nsstc.uah.edu/climate/;
The processed temperature data is available on-line at vortex.nsstc.uah.edu/data/msu/t2lt/uahncdc.lt

 Home/Blog


