Home/Blog
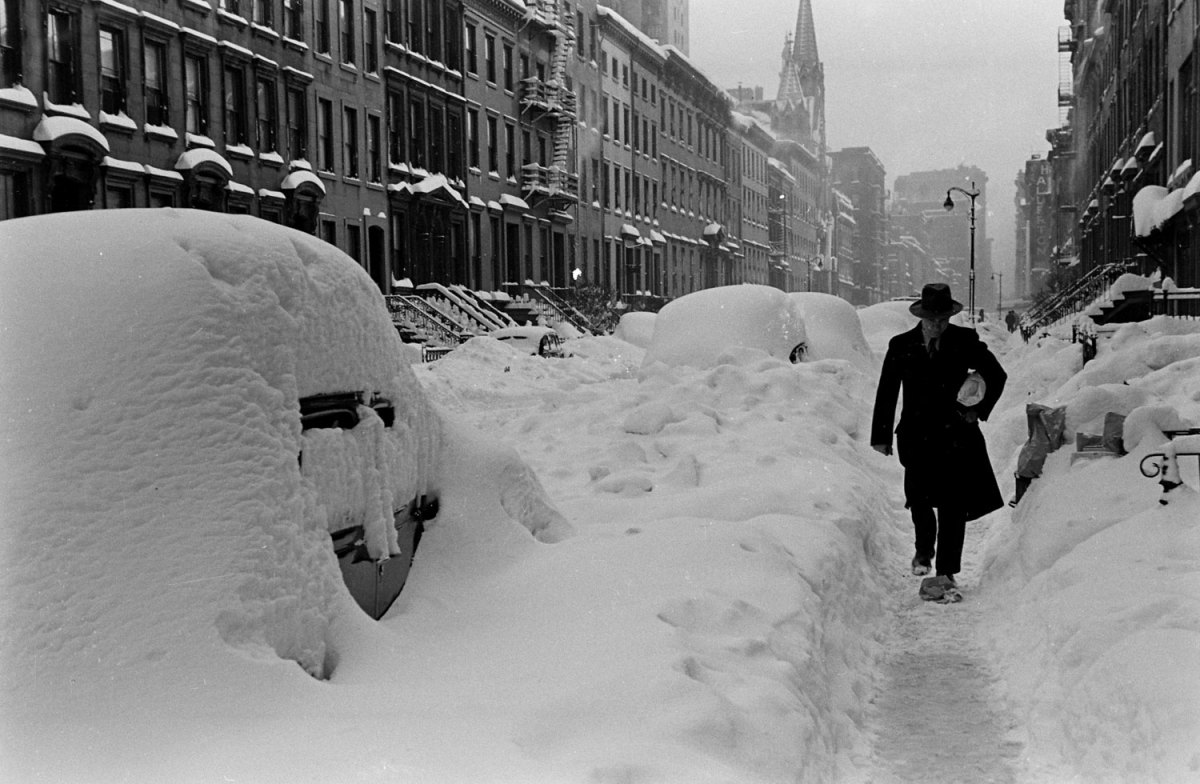
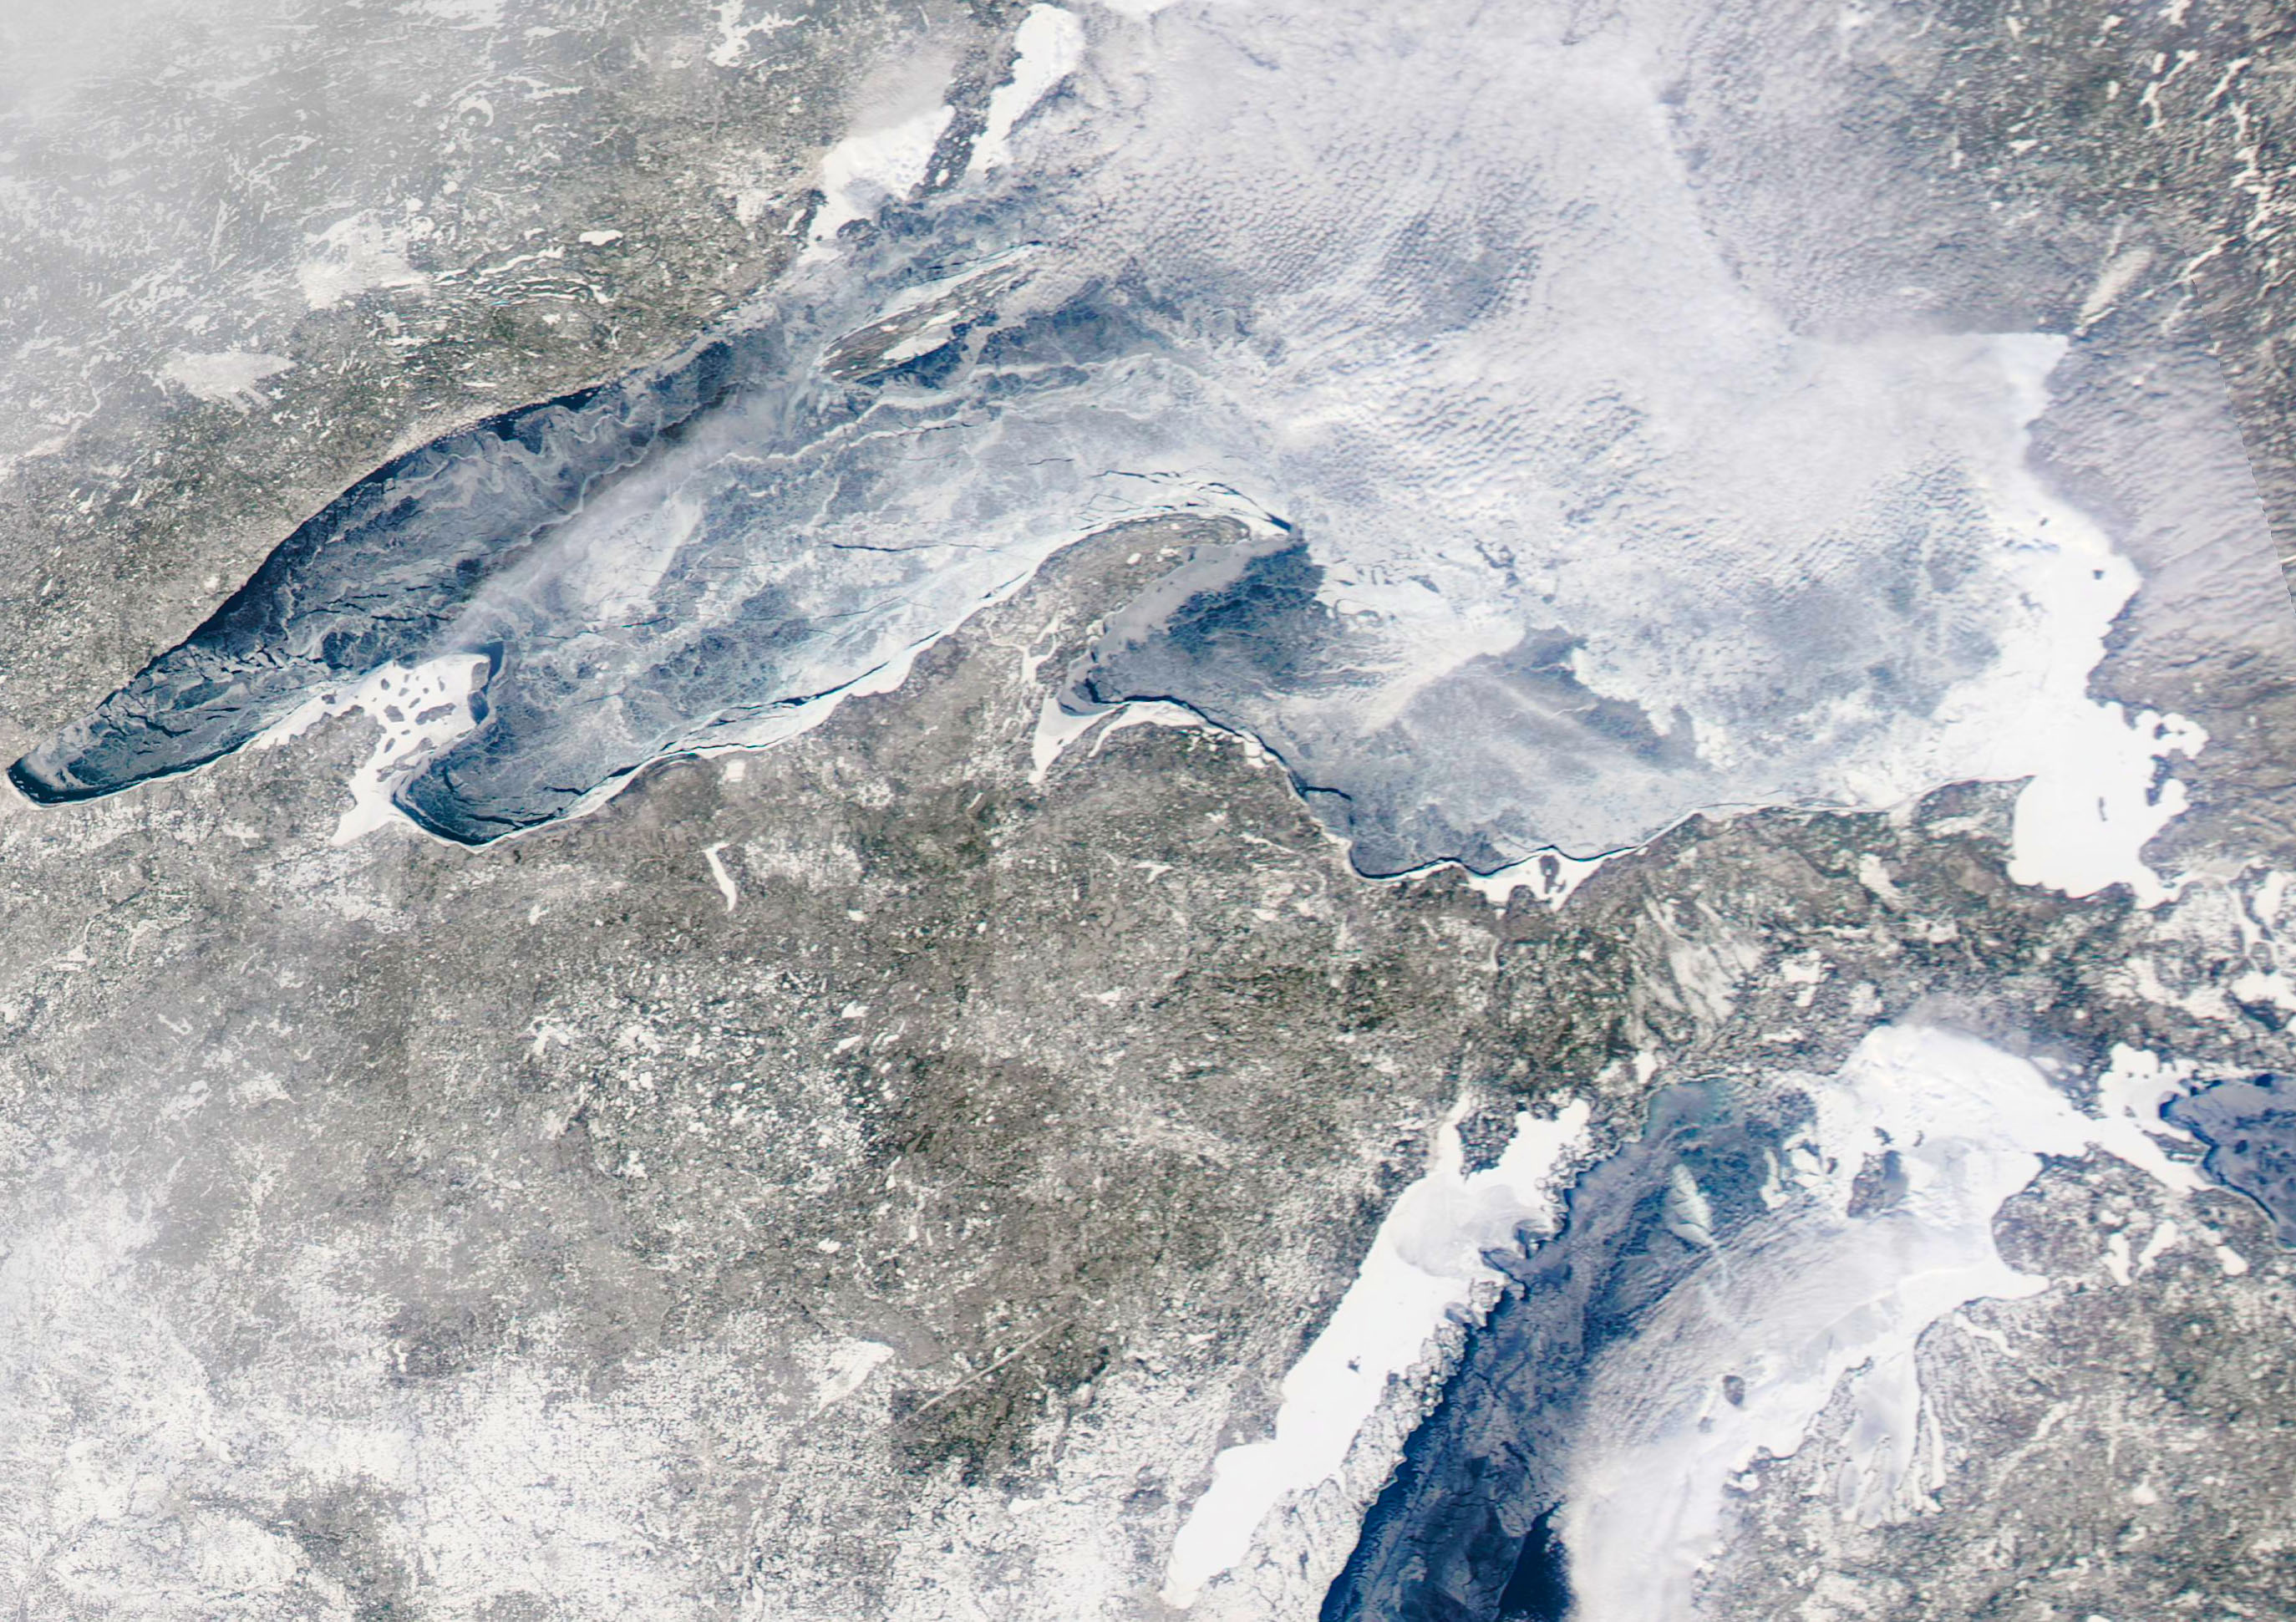
The great blizzard of Dec. 1947 dropped over 2 feet of snow on New York City.
In another silly pseudo-science rambling, the President’s science advisor, John Holdren, has recently stated, “Weather practically everywhere is being caused by climate change.”
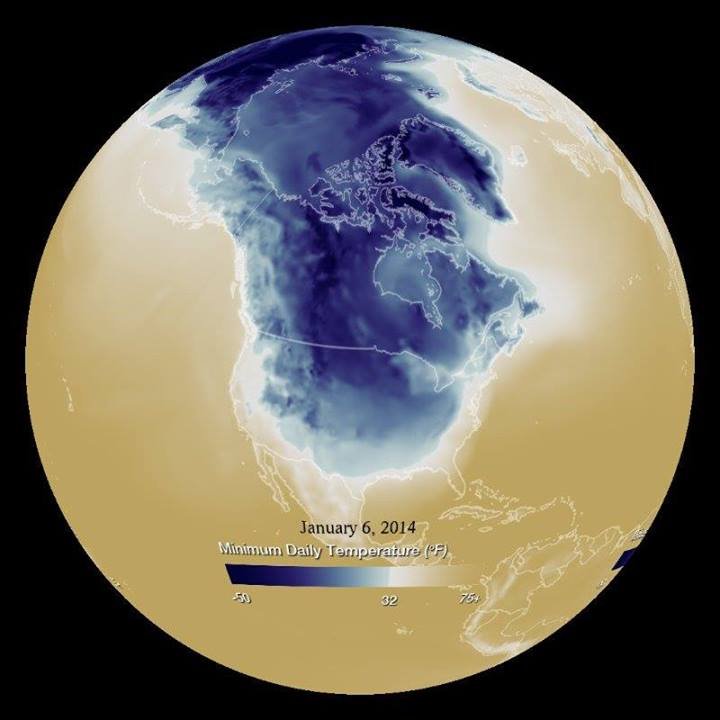
Drought in California. Record snows in the East. It’s tempting for many to blame it all on our use of fossil fuels.
What Causes Weather?
Let’s start with the basics. Weather is caused by energy imbalances, primarily (1) between the solar heated surface of the Earth and the atmosphere above it, and (2) between different geographic regions (e.g. the tropics vs. high latitudes; the warm oceans versus cold continents in winter).
These energy imbalances have associated temperature differences, which in turn cause atmospheric circulation systems which form clouds, precipitation, and high and low pressure systems.
How much energy is involved? On a global basis the average rate of solar energy absorbed by the Earth is estimated to be about 240 Watts per sq. meter. In order for the climate system to stay at the same average temperature year after year, the Earth has to lose exactly the same amount of energy (240 W m-2) to outer space, in the form of infrared energy.
It’s all about the energy…and especially about imbalances in energy, which causes “weather” as the ocean and atmosphere seek to reduce those imbalances. On a local basis, those imbalances can be tens or even hundreds of watts per sq. meter.
So, How Much of Weather Could be Caused by Manmade Climate Change?
Our best estimate of how much the climate system has been perturbed from energy balance comes from the slow warming of the oceans, which since the 1950s equates to a 1 part in 1,000 energy imbalance (say, if 240 W m-2 of solar energy has been absorbed on average, 239.75 W m-2 has been lost to space…the slight ~0.25 W m-2 imbalance leads to slow warming).
Now, how exactly can a 1 part in 1,000 energy imbalance lead Holdren to state, “Weather practically everywhere is being caused by climate change”? Well, all I can think of is that his statement is not based in science.
Maybe that imbalance in recent years is somewhat more…say 2 parts in 1,000 (about a 0.5 W m-2 imbalance). But even that depends upon whether you believe in the measurements of tiny, multi-decadal oceanic warming trends of tenths or hundredths of a degree (depending on depth).
And it’s far from clear that even that is entirely our fault.
Now, how that tiny imbalance gets translated into a change in weather is, admittedly, not well understood. But, ultimately, weather is still related to energy imbalances, and mankind’s role in changing those rates of energy flow is miniscule.
You might say, “But what about global warming causing a warmer Gulf Stream, which then clashes with the cold air masses and makes bigger East Coast snowstorms?” The trouble with that argument is that “global warming” warms those winter air masses more than it warms the oceans, reducing the temperature contrast. So, if the opposite is happening this winter, then it’s not due to global warming.
The idea that any of the weather we are seeing is in any significant way due to humanity’s greenhouse gas emissions verges on irrationality.