
 Home/Blog
With 5/12 (41.7%) of the votes counted, John Christy and I are now prepared to call 2015 as the winner of the Warmest Year in the Thermometer Record election. The latest exit polling of El Nino forecasts suggests an unusually hot turnout from the East Pacific region this year, which is why we are calling the election early.
Of course, our UAH satellite data analysis (as well as the RSS analysis) for the lower troposphere continue to show nothing spectacular, although the current forecast for a strong El Nino this year will make 2015 one of the warmest years since 1979.
But today’s post will just deal with the latest global warming pause-busting dataset out of NCDC (now NCEI), which purports to remove evidence for a global warming “hiatus” seen in other datasets. Since the KNMI Climate Explorer website has only the ERSST (ocean) data available for new Karlized version 4 dataset, and since the oceans pretty much drive annual averages anyway, we will stick to the oceans between 60N and 60S latitudes.
The following plot shows anomalies from the 1981-2010 (30-year) monthly averages, but repositioned vertically on the graph as departures from the 1979-1983 period mean. In the first plot I have removed the average effect of El Nino and La Nina events, which ends up being 0.069 C per MEI index value one month before the temperature measurement (based upon detrended data). The second plot shows the original data.
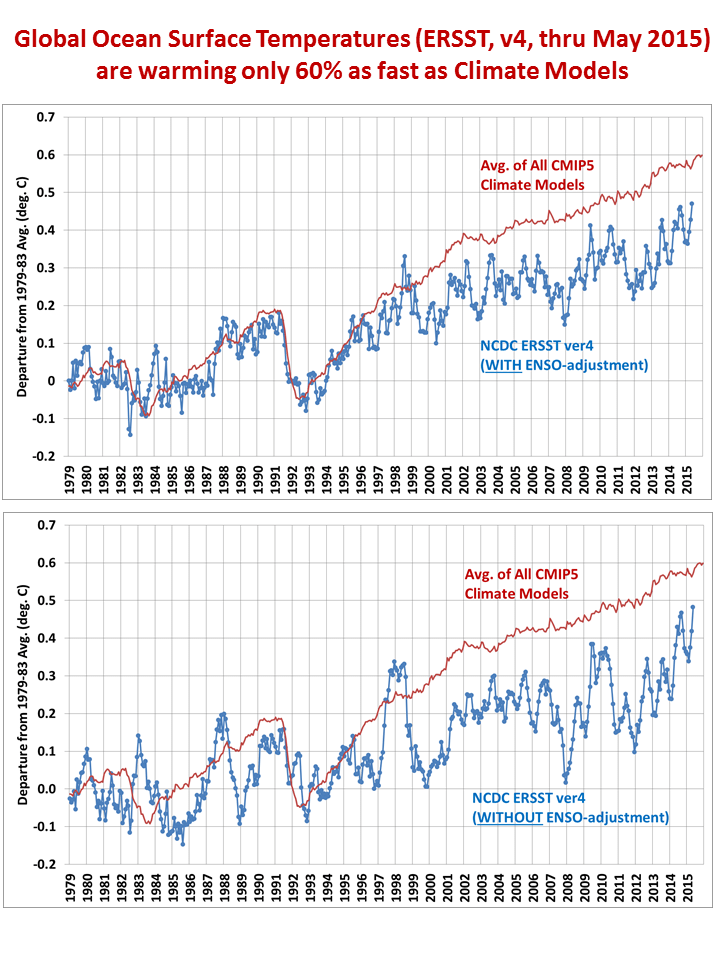
As can be seen, even with the El Nino effect removed (first plot, above) it appears that 2015 is likely to be a record warm year anyway, at least in this official dataset. But even with the highly controversial Karlization procedure applied to the data, the observed warming trend is still only about 60% of the average warming trend in the CMIP5 climate models for the global oceans (+0.18 C/decade for the models, +0.11 C/decade for the observations). This is true whether you compute trends for the entire period, or only since 1996, which is where the two temperature time series diverge more noticeably.
Which brings up a point I have mentioned before: We could have a record warm year, every year, but what really matters is just how much that warming is.
If there was no natural variability, and we had perfect measurements, each successive year could be 0.01 C warmer than the prior year and thus be a new, record warm year…but would we really care?
It’s the long-term difference between (1) the climate models used to promote energy policy changes and (2) the observations, which should drive the global warming debate, not qualitative “record warmest year” statements.
And on that score, even using Tom Karl’s new pause-busting surface temperature dataset, the models continue to come up short.
So, as we approach the United Nations COP-21 (21st Conclave Of the Party-goers) in Paris this December, we’d all better get used to the inevitable “warmest year on record” rhetoric.
Even the Pope is on board this time.


