News reporting of the recent heat wave in France and other European countries was accompanied with the usual blame on humans for causing the event. For example, here’s the CBS News headline: Record-breaking heat is scorching France. Experts say climate change is to blame.
While it is possible that the human component of recent warming might have made the heat wave slightly worse, there are three facts the media routinely ignore when reporting on such “record hot” events. If these facts were to be mentioned, few people with the ability to think for themselves would conclude that our greenhouse gas emissions had much of an impact.
1. Record High Temperatures Occur Even Without Global Warming
The time period covered by reliable thermometer records is relatively short, even in Europe. Due to the chaotic nature of weather, record high and record low temperatures can be expected to occur from time to time, even with no long-term warming trend.
The question is, are the number of record high temperatures increasing over time? At least in the U.S., the answer is ‘no’, as the number of days over 100 and 105 deg. F have not increased (see Fig. 5 here). One would need to study the data for Europe to see if the number of record highs is increasing over time.
Then, even if they are increasing, one needs to determine the cause. Most of the warming since the Little Ice Age (up to about 1900) occurred before greenhouse gases could be blamed. We have no temperature measurements during the Medieval Warm Period of 1,000 years ago. How hot were some of the summer days back then? No one knows. Weather changes, which leads me to my next point.
2. Summer Heat Waves are Weather-Related, and Unusual Cold is Usually Nearby
The recent excessive heat in Europe wasn’t caused by summer air sitting there and cooking in a bath of increased human-emitted carbon dioxide. It was caused by a Saharan Air Layer (SAL) flowing in from that gigantic desert to the south.
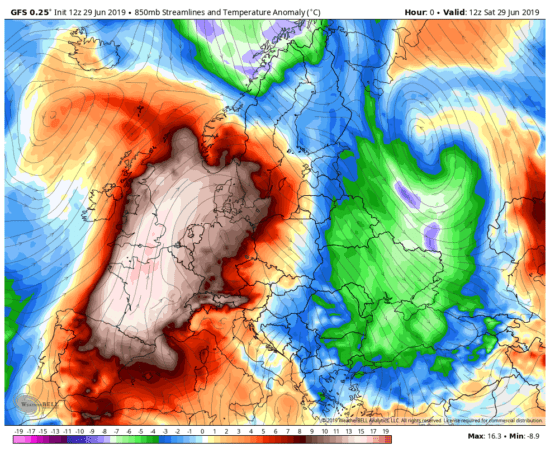
This happens from time to time. Here’s what the temperature departures from normal looked like at ~ 5,000 ft. altitude:

The SAL event flowed north from the Sahara Desert to cover western Europe while a cold air mass flowed south over eastern Europe. As evidence of just how large natural weather variations can be, the full range of temperature departures from normal just over this small section of the world spanned 25 deg. C (45 deg. F).
Meanwhile, the global average temperature anomaly for June (from NOAA’s Climate Forecast System, CFSv2 model) at the surface was only +0.3 deg. C (0.5 deg. F), and even for one day (July 1, 2019, from WeatherBell.com) remains at +0.3 deg. C.
Do you see the disparity between those two numbers?: weather-related temperature variations of 45 deg. F versus a climate-related global average “warmth” of only 0.5 deg. F.
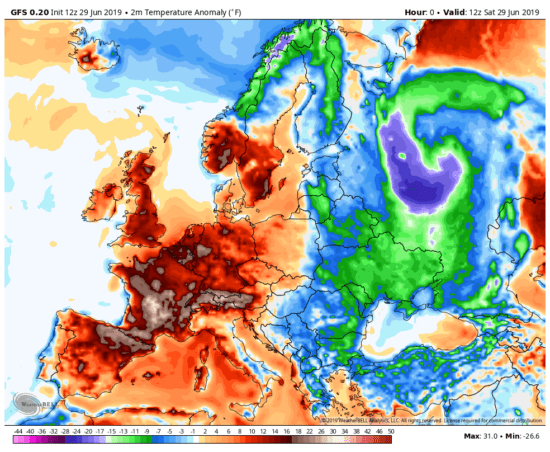
Here’s what the situation looked like at the surface:

The range in surface air temperature departures from normal was was 32 deg. C (about 58 deg. F), again swamping (by a factor of 100) the global “climate” warmth of only 0.5 deg. F.
Thus, when we talk of new temperature records, we should be looking at normal weather variations first.
3. Most Thermometer Measurements Have Been Spuriously Warmed by the Urban Heat Island Effect
I am thoroughly convinced that the global thermometer record has exaggerated warming trends due to the Urban Heat Island (UHI) effect. When natural vegetation is replaced with buildings, pavement, and we add spurious heat sources like air conditioning units, cars, and ice cream trucks, the microclimate around thermometer sites changes.
Many of us experience this on a daily basis as we commute from more rural surroundings to our jobs in more urban settings.
For example, Miami International Airport recently set a new high temperature record of 98 deg. F for the month of May. The thermometer in question is at the west end of the south runway at the airport, at the center of the Miami-Ft. Lauderdale metroplex. Only 120 years ago, virtually no one lived in Miami; in 1896 it had a population of 300.
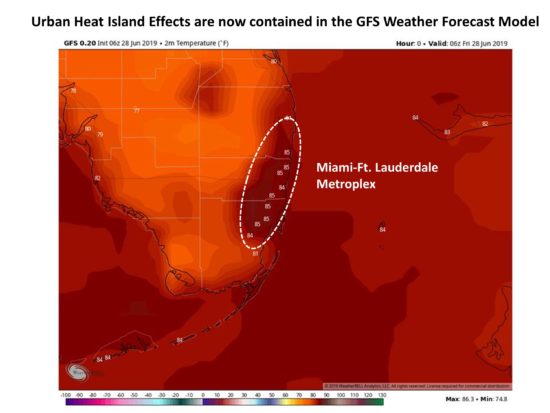
The UHI effect is so strong and pervasive that it is now included in the GFS weather forecast model, and in the case of Miami’s recent hot spell, we see the metroplex at midnight was nearly 10 deg. F warmer than the rural surroundings:

When a thermometer site has that kind of spurious warming at night, it’s going to produce spuriously warm temperatures during the day (and vice versa).
The most thorough analysis of the UHI effect on U.S. temperature was by Anthony Watts and co-authors, who analyzed the siting of hundreds of thermometers around the U.S. and showed that if only the best (most rural) sited thermometers are used, U.S. warming trends are roughly cut in half. Curiously, they found that the official NOAA-adjusted temperature data (which uses both urban and rural data) has even more warming than if no UHI adjustments were made, leading many of us to conclude that the NOAA UHI adjustment procedure has made the rural data look like urban, rather than the other way around as it should be.
How does this impact the recent record high temperatures in France? There is no question that temperatures were unusually hot, I’m only addressing the reasons why high temperature records are set. I’ve already established that (1) record high temperatures will occur without global warming; (2) weather variations are the primary cause (in this case, an intrusion of Saharan air), and now (3) many thermometer sites have experienced spurious warming.
On this third point, this MeteoFrance page lists the temperature records from the event, and one location (Mont Aigoua) caught my eye because it is a high altitude observatory with little development, on a peak that would be well-ventilated. The previous high temperature record there from 1923 was beat by only 0.5 deg. C.
Some of the other records listed on that page are also from the early 20th Century, which naturally begs the question of how it could have been so hot back then with no anthropogenic greenhouse effect and little urban development.
The bottom line is that record high temperatures occur naturally, with or without climate change, and our ability to identify them has been compromised by spurious warming in most thermometer data which has yet to be properly removed.

 Home/Blog


