
 Home/Blog
The Version 6.0 global average lower tropospheric temperature (LT) anomaly for October, 2021 was +0.37 deg. C, up from the September, 2021 value of +0.25 deg. C.
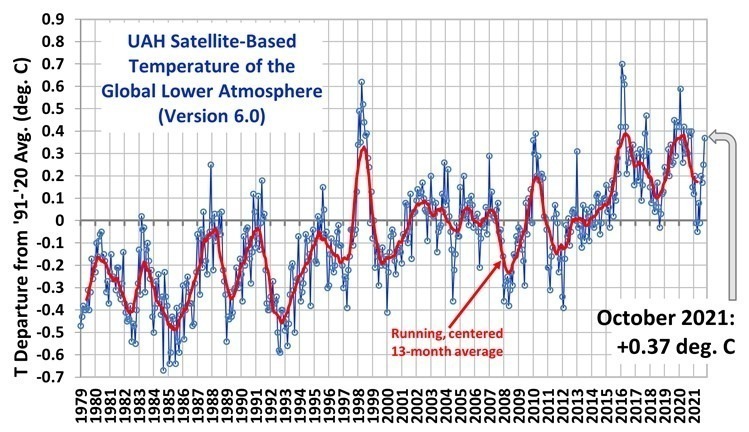
The linear warming trend since January, 1979 is +0.14 C/decade (+0.12 C/decade over the global-averaged oceans, and +0.18 C/decade over global-averaged land).
Various regional LT departures from the 30-year (1991-2020) average for the last 22 months are:
YEAR MO GLOBE NHEM. SHEM. TROPIC USA48 ARCTIC AUST
2020 01  0.42  0.44  0.40  0.52  0.57 -0.22  0.41
2020 02  0.59  0.74  0.45  0.63  0.17 -0.27  0.20
2020 03  0.35  0.42  0.27  0.53  0.81 -0.95 -0.04
2020 04  0.26  0.26  0.25  0.35 -0.70  0.63  0.78
2020 05  0.42  0.43  0.41  0.53  0.07  0.84 -0.20
2020 06  0.30  0.29  0.30  0.31  0.26  0.54  0.97
2020 07  0.31  0.31  0.31  0.28  0.44  0.27  0.26
2020 08  0.30  0.34  0.26  0.45  0.35  0.30  0.24
2020 09  0.40  0.42  0.39  0.29  0.69  0.24  0.64
2020 10  0.38  0.53  0.22  0.24  0.86  0.95 -0.01
2020 11  0.40  0.52  0.27  0.17  1.45  1.09  1.28
2020 12  0.15  0.08  0.21 -0.07  0.29  0.44  0.13
2021 01  0.12  0.34 -0.09 -0.08  0.36  0.50 -0.52
2021 02  0.20  0.32  0.08 -0.14 -0.65  0.07 -0.27
2021 03 -0.01  0.13 -0.14 -0.29  0.59 -0.78 -0.79
2021 04 -0.05  0.05 -0.15 -0.28 -0.02  0.02  0.29
2021 05  0.08  0.14  0.03  0.06 -0.41 -0.04  0.02
2021 06 -0.01  0.31 -0.32 -0.14  1.44  0.63 -0.76
2021 07  0.20  0.33  0.07  0.13  0.58  0.43  0.80
2021 08  0.17  0.27  0.08  0.07  0.33  0.83 -0.02
2021 09  0.25  0.18  0.33  0.09  0.67  0.02  0.37
2021 10  0.37  0.46  0.27  0.33  0.84  0.63  0.06
The full UAH Global Temperature Report, along with the LT global gridpoint anomaly image for October, 2021 should be available within the next several days here.
The global and regional monthly anomalies for the various atmospheric layers we monitor should be available in the next few days at the following locations:
Lower Troposphere: http://vortex.nsstc.uah.edu/data/msu/v6.0/tlt/uahncdc_lt_6.0.txt
Mid-Troposphere: http://vortex.nsstc.uah.edu/data/msu/v6.0/tmt/uahncdc_mt_6.0.txt
Tropopause: http://vortex.nsstc.uah.edu/data/msu/v6.0/ttp/uahncdc_tp_6.0.txt
Lower Stratosphere: http://vortex.nsstc.uah.edu/data/msu/v6.0/tls/uahncdc_ls_6.0.txt


RLH
1. ” No statistics textbooks say that a mean is preferred over a median on skewed, bimodal data. ”
No one – I repeat: NO ONE did ever say or write that – me the least.
The contrary is the case: YOU were last year the one who discredited the mean – here: (tmin+tmax)/2 – as a wrong approach for daily temperature averages.
You were even brazen enough to claim – as usual, without any proof – that using that daily temperature average would be responsible for unduly high temperature estimates since the beginning of temperature measurements.
I’m sure you will find back to your own comment.
I gave you many proofs of how wrong you are to ideologically put the median as the only correct method.
My first proof was using data from the German Weather Services: mean, median and average were nearly identical in shape and trend for Germany.
You never were able to contradict that, even not as you decided to switch to USCRN data.
*
2. I wrote:
“RLH never processed any data else than USCRN”
and you answered:
” Liar. See my website. ”
*
It took me a while to inspect your endless, tedious repetitions of the same stuff, month after month.
To be quite sure I wouldn’t have overlooked anything you might have made of your own, I went down to your very first post in the blog:
A Mathematical Tool for examining Temperature data
Feb 19, 2014
The conclusion is absolutely clear: apart from some little work on USCRN, not ONE chart shows any hint on own data processing.
All other charts – especially those showing UAH data (LT, MT, TP, LS layers), but also any other one showing AMO, PDO, ENSO or whatever – are based on existing data which you superposed with some simple low pass filter stuff coming from some spreadsheet calculator (Excel, Libre Office Calc or so).
Nothing is of your own.
You manifestly NEVER did process any data from any raw source.
What I understand with own processing you can see below.
– UAH 6.0 LT time series with absolute data, reconstructed out of UAH’s anomalies and climatology:
https://i.postimg.cc/PxZ71c5n/UAH-6-0-LT-reconstructed-absolute-data.png
– UAH time series constructed years ago out of a small subset of the entire grid, compared with the original data
https://drive.google.com/file/d/1Ij_jKmyrBJOMUdwtRP6NYqyGXibNPnRb/view
*
Me, a liar? Certainly not.
You, a liar? Certainly well.
*
I see that Brandon R. Gates also is – as opposed to you – a real professional person who knows what he is talking about.
You are only boasting all the time, and keep intentionally distorting what I do, see for example this incredibly dumb discussion about Mollweide projections versus my displaying of rectangular grids you discredit as Mercator projections.
And what a liar you really are became visible to me when going back upthread, till I saw your woeful answer to Tim Folkerts in a discussion:
*
RLH says:
April 7, 2022 at 3:34 PM
“The main goal in Bins work (the it) seem to be creating an accurate time series”
Blinny doesnt create anything. Those are Roys figures that he just plots on a rectangular grid.
You need to understand that the areas that each of his pixels covers is like comparing Greenland with Africa.
*
Apart form the fact that you last sentence couldn’t be more irrelevant, as everybody knows that Greenland is far smaller than Africa, your (bold emphasized) lie is evident: no one has access to the data Mr Spencer uses to display data (monthly anomalies, long-time trends) in Mollweide form.
What I do is the same as what the UAH team does:
– to compute the linear trend of each of the 9504 grid cells;
– to display them in a simple, easy-to-produce, easy-to-read rectangular form.
*
You, RLH, were until now absolutely unable to process UAH’s raw grid data, like did Mr Z., Mark B and I.
Let alone would you have been able to process sea ice extent data out of HadISST1 ICE data, or to generate a global sea level time series out of PSMSL and SONEL data, etc etc etc etc.
*
It’s hard to imagine you as a former engineer. You rather behave like a mix of a bad teacher and an opinionated polemicist.
The Temperature also depends on the orbital of the earth and sun. Sun is considered to its due to lots of radiation rising from the sun like UV which is harmful to our body skin also it rising day by day.