
 Home/Blog
Global Warming as a Natural Response to Cloud Changes Associated with the Pacific Decadal Oscillation (PDO)
by Roy W. Spencer, Ph.D.
October 20, 2008 (updated December 29, 2008)
ABSTRACT
A simple climate model forced by satellite-observed changes in the Earth’s radiative budget associated with the Pacific Decadal Oscillation is shown to mimic the major features of global average temperature change during the 20th Century – including three-quarters of the warming trend. A mostly-natural source of global warming is also consistent with mounting observational evidence that the climate system is much less sensitive to carbon dioxide emissions than the IPCC’s climate models simulate.
1. INTRODUCTION
The main arguments for global warming being manmade go something like this: “What else COULD it be? After all, we know that increasing carbon dioxide concentrations are sufficient to explain recent warming, so what’s the point of looking for any other cause?”
But for those who have followed my writings and publications in the last 18 months (e.g. Spencer et al., 2007; Spencer, 2008), you know that we are finding satellite evidence that the climate system is much less sensitive to greenhouse gas emissions than the U.N.’s Intergovernmental Panel on Climate Change (IPCC, 2007) climate models suggest that it is. And if that is true, then mankind’s CO2 emissions are not strong enough to have caused the global warming we’ve seen over the last 100 years.
To show that we are not the only researchers who have documented evidence contradicting the IPCC models on the subject of climate sensitivity, I made the following figure (Fig. 1) to contrast the IPCC-projected warming from a doubling of atmospheric carbon dioxide with the warming that would result if the climate sensitivity is as low as implied by various kinds of observational evidence.
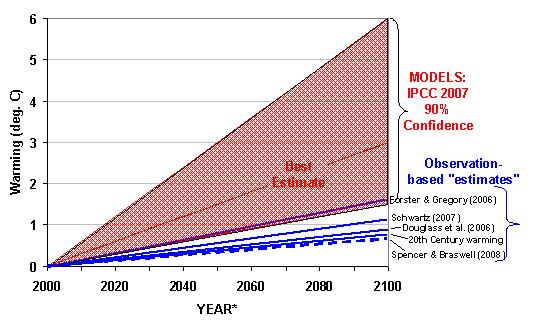
Fig. 1. Projected warming (assumed here to occur by 2100) from a doubling of atmospheric CO2 from the IPCC climate models versus from various observational indicators.
The dashed line in Fig. 1 comes from our recent apples-to-apples comparison between satellite-based feedback estimates and IPCC model-diagnosed feedbacks, all computed from 5-year periods (see Fig. 2). In that comparison, there were NO five year periods from ANY of the IPCC model simulations which produced a feedback parameter with as low a climate sensitivity as that found in the satellite data.
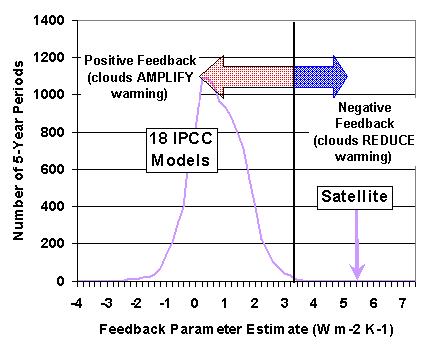
Fig. 2. Frequency histogram of total (reflected solar plus emitted infrared)feedback parameters computed from all possible 5 year periods in transient forcing experiments in 18 climate models tracked by the IPCC, versus the same calculation from Aqua CERES and NOAA-15 AMSU channel 5 satellite data.
The discrepancy between the models and observations seen in Figs. 1 and 2 is stark. If the sensitivity of the climate system is as low as some of these observational results suggest, then the IPCC models are grossly in error, and we have little to fear from manmade global warming. [I am told that the 1.1 deg. C sensitivity of Schwartz (2007) has more recently been revised upward to 1.9 deg. C.]
But it also means that the radiative forcing caused by increasing atmospheric concentrations of CO2 is not sufficient to cause PAST warming, either. So, this then leaves a critical unanswered question: What has caused the warming seen over the last 100 years or so?
Here I present new evidence that most of the warming could be the result of a natural cycle in cloud cover forced by a well-known mode of natural climate variability: the Pacific Decadal Oscillation (PDO). While the PDO is primarily a geographic rearrangement in atmospheric and oceanic circulation patterns in the North Pacific, it is well known that such regional changes can also influence weather patterns over much larger areas, for instance North America or the entire Northern Hemisphere (which is, by the way, the region over which the vast majority of global warming has occurred).
The IPCC has simply ASSUMED that these natural fluctuations in weather patterns do not cause climate change. But all it would take is a small change in global average (or Northern Hemispheric average) cloudiness to cause global warming. Unfortunately, our global observations of cloudiness have not been complete or accurate enough to document such a change…until recently.
2. A SIMPLE MODEL OF NATURAL GLOBAL WARMING
As Joe D’Aleo, Don Easterbrook, and others have pointed out for years, the Pacific Decadal Oscillation (PDO) has experienced phase shifts that have coincidently been associated with the major periods of warming and cooling in the 20th Century. As can be seen in the following figure, the pre-1940 warming coincided with the positive phase of the PDO; then, a slight cooling until the late 1970s coincided with a negative phase of the PDO; and finally, the warming since the 1970s has once again coincided with the positive phase of the PDO.
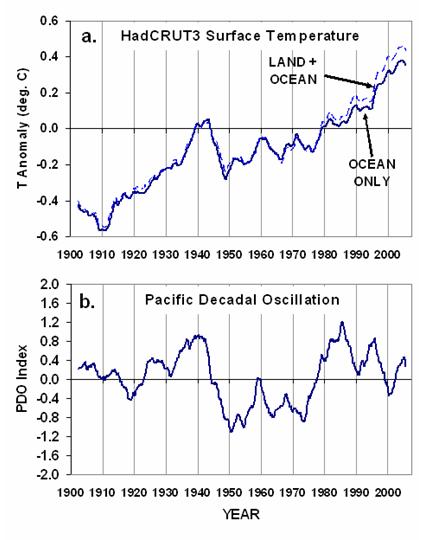
Fig. 3. Five-year running averages in (a) global-average surface temperature, and (b) the Pacific Decadal Oscillation (PDO) index during 1900-2000.
Others have noted that the warming in the 1920s and 1930s led to media reports of decreasing sea ice cover, Arctic and Greenland temperatures just as warm as today, and the opening up of the Northwest Passage in 1939 and 1940.
Since this timing between the phase of the PDO and periods of warming and associated climate change seems like more than mere coincidence, I asked the rather obvious question: What if this known mode of natural climate variability (the PDO) caused a small fluctuation in global-average cloud cover?
Such a cloud change would cause the climate system to go through natural fluctuations in average temperature for extended periods of time. The IPCC simply assumes that this kind of natural cloud variability does not exist, and that the Earth stays in a perpetual state of radiative balance that has only been recently disrupted by mankind’s greenhouse gas emissions.
This is an assumption that many of us meteorologists find simplistic and dubious, at best. Spencer and Braswell (2008) showed theoretically that daily random variations in cloudiness can actually cause substantial decadal time-scale variability on ocean temperatures. This is not a new finding, as it was also demonstrated over 30 years ago (Hasselman, 1976) and is related to the fact that the ocean, due to its large heat capacity, retains a ‘memory’ of past changes in the Earth’s radiative budget for a very long time.
So, what if those chaotic variations in cloud cover occurred on time scales longer than days… yearly, or 30 years (like with the PDO), or 100 years? Might such internally-generated climate change even explain events like the Medieval Warm Period and the Little Ice Age?
I used a very simple energy balance climate model, previously suggested to us by Isaac Held and Piers Forster, to investigate the possibility that the PDO could have caused some of the climate change over the last century. In this model I ran many thousands of combinations of assumed: (1) ocean depth (through which heat is mixed on multi-decadal to centennial time scales), (2) climate sensitivity, and (3) cloud cover variations directly proportional to the PDO index values.
In effect, I asked the model to show me what combinations of those model parameters yielded a temperature history approximately like that seen during 1900-2000. And here’s an average of all of the simulations that came close to the observed temperature record:
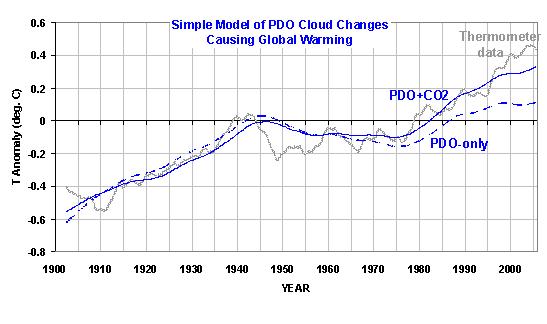
Fig. 4. A simple energy balance model driven by cloud changes associated with the PDO can explain most of the major features of global-average temperature fluctuations during the 20th Century. The best model fits had assumed ocean mixing depths around 800 meters, and feedback parameters of around 3 Watts per square meter per degree C.
The “PDO-only” (dashed) curve in Fig. 4 indeed mimics the main features of the behavior of global mean temperatures during the 20th Century — including three-quarters of the warming trend. If I include the CO2 and other forcings during the 20th Century complied by James Hansen with the PDO-forced cloud changes (solid line labeled PDO+CO2), then the fit to observed temperatures is even closer.
Now, the average PDO forcing that was required by the model for the two curves in Fig. 4 ranged from 1.7 to 2.0 Watts per square meter per PDO index value. In other words, for each unit of the PDO index, 1.7 to 2.0 Watts per square meter of extra heating was required during the positive phase of the PDO, and that much cooling during the negative phase of the PDO.
But what evidence do we have that any such cloud-induced changes in the Earth’s radiative budget are actually associated with the PDO? I address that question in the next section.
3. SATELLITE EVIDENCE OF RADIATIVE FORCING CAUSED BY THE PACIFIC DECADAL OSCILLATION
To see whether there is any observational evidence that the PDO has associated changes in global-average cloudiness, I used NASA Terra satellite measurements of reflected solar (shortwave, SW) and emitted infrared (longwave, LW) radiative fluxes over the global oceans from the CERES instrument during 2000-2005, and compared them to recent variations in the PDO index. The results can be seen in the following figure:
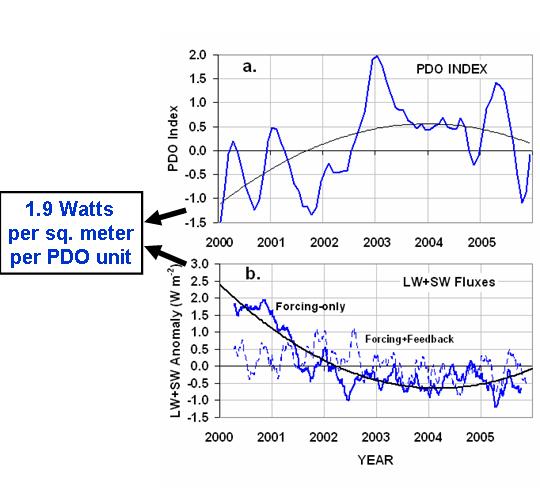
Fig. 5. Three-month running averages of (a) the PDO index during 2000-2005, and (b) corresponding CERES-measured anomalies in the global ocean average radiative budget, with and without the feedback component removed (see Fig. 6). The smooth curves are 2nd order polynomial fits to the data.
But before a comparison to the PDO can be made, one must recognize that the total radiative flux measured by CERES is a combination of forcing AND feedback (e.g. Gregory et al., 2002; Forster and Gregory, 2006). So, we first must estimate and remove the feedback component to better isolate any radiative forcing potentially associated with the PDO.
As Spencer and Braswell (2008b) have shown with a simple model, the radiative feedback signature in globally-averaged radiative flux-versus-temperature data is always highly correlated, while the time-varying radiative forcing signature of internal climate fluctuations is uncorrelated because the forcing and temperature response are always 90 degrees out of phase. This allows some measure of identification and separation of the two signals.
The following figure shows what I call “feedback stripes” associated with intraseasonal fluctuations in the climate system. The corresponding feedback estimate (line slope) of 8.3 Watts per square meter per degree C was then used together with three-month anomalies in tropospheric temperature from AMSU channel 5 remove the estimated feedback signal from the radiative flux data to get the “forcing-only” curve in Fig. 5b. (Check out this for a more complete treatment of the signature of feedback…including evidence that this behavior also exists in the IPCC climate models themselves.)
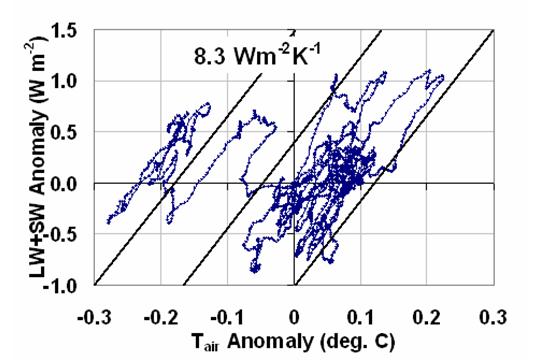
Fig. 6. Three-month running averages of global oceanic CERES radiative flux changes versus tropospheric temperature changes (from AMSU channel 5, see Christy et al., 2003) for the time period in Fig. 5. The average feedback estimate (see sloped lines) was then used together with the AMSU5 data to estimate and remove the feedback component from the CERES radiative fluxes, leaving the radiative forcing shown in Fig. 4b.
[NOTE: This feedback estimate does not necessarily represent long-term climate sensitivity (which in this case would be very low, 0.44 deg. C for a doubling of CO2); it is instead the feedback occurring on intraseasonal and interannual time scales which is merely being removed to isolate the forcing signal. This is the same technique employed by Forster and Taylor (2006) to isolate the signal of radiative forcing in 20 climate models tracked by the IPCC.]
When the feedback is removed, we see a good match in Fig. 5 between the low-frequency behavior of the PDO and the radiative forcing (which is presumably due to cloud fluctuations associated with the PDO). Second-order polynomials were fit to the time series in Fig. 5 and compared to each other to arrive at the PDO-scaling factor of 1.9 Watts per square meter per PDO index value.
Another way to show the data is shown in Fig. 7, where yearly averages of the PDO index and CERES-inferred radiative forcing are plotted against one another. The dashed line represents what the simple model ‘chose’ for a relationship, and the solid line is fitted to the actual satellite data.
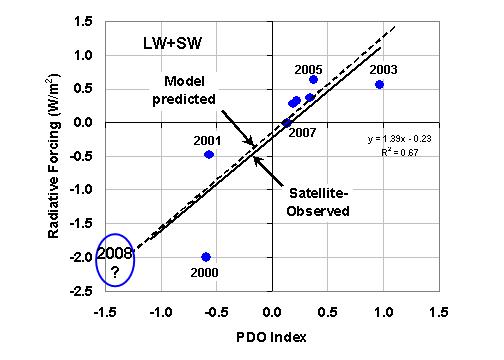
Fig. 7. As in Fig. 5, but now yearly averages of the PDO index plotted against CERES- and AMSU5-inferred radiative forcing, and updated through August 2007.
Thus, these recent satellite measurements – even though they span only 7.5 years — support the Pacific Decadal Oscillation as a potential major player in global warming and climate change. It will also be interesting to see where the satellite data averages for 2008 lie in Fig. 7, as the average PDO value for 2008 was lower than any of the previous years.
It is important to point out that, in this exercise, the PDO itself is not an index of temperature; it is an index of radiative forcing which drives the time rate of change of temperature. This answers the question I frequently get, “Couldn’t the PDO be caused by the temperature changes, rather than the other way around?”. The answer is “no”, because the forcing occurs before the temperature change (by 90 degrees of phase for sinusoidal forcing, if you know what that means). This explains why the history of the PDO index in Fig. 2 does not ‘look like’ the temperature history. The PDO index is instead directly related to the change in temperature with time, not the temperature per se. (And, if you can understand this point, you are doing better than the single peer reviewer of my article on this subject who told Geophysical Research Letters to reject my paper submitted for publication.)
4. DISCUSSION AND CONCLUSIONS
The evidence continues to mount that the IPCC models are too sensitive, and therefore produce too much global warming. If climate sensitivity is indeed considerably less than the IPCC claims it to be, then increasing CO2 alone can not explain recent global warming. The evidence presented here suggests that most of that warming might well have been caused by cloud changes associated with a natural mode of climate variability: the Pacific Decadal Oscillation.
The IPCC has simply assumed that mechanisms of climate change like that addressed here do not exist. But that assumption is quite arbitrary and, as shown here, very likely wrong. My use of only PDO-forced variations in the Earth’s radiative energy budget to explain three-quarters of the global warming trend is no less ‘biased’ than the IPCC’s use of carbon dioxide to explain global warming without accounting for natural climate variability. If any IPCC scientists would like to dispute that claim, please e-mail me at roy.spencer (at) nsstc.uah.edu. (two months later, as of late December, 2008, I’ve still not received a response.)
It should be noted that the entire modern satellite era started in 1979, just 2 years after the PDO switched to its positive phase during the ‘Great Climate Shift’ of 1977. Thus, our satellite data records are necessarily biased toward conditions existing during the positive phase of the PDO, and might not correspond to ‘normal’ climate conditions. Indeed there might not be any such thing as ‘normal’ climate conditions.
If the PDO has recently entered into a new, negative phase, then we can expect that global average temperatures, which haven’t risen for at least seven years now, could actually start to fall in the coming years. The recovery of Arctic sea ice now underway might be an early sign that this is indeed happening. The next few years of satellite data might provide some very interesting insights into whether the Pacific Decadal Oscillation is indeed a major force in climate change.
REFERENCES
Christy, J. R., R. W. Spencer, W. B. Norris, W. D. Braswell, and D. E. Parker (2003), Error estimates of version 5.0 of MSU/AMSU bulk atmospheric temperatures, J. Atmos. Oceanic Technol., 20, 613- 629.
Douglass, D.H., and R. S. Knox, 2005. Climate forcing by volcanic eruption of Mount Pinatubo. Geophys. Res. Lett., 32, doi:10.1029/2004GL022119.
Forster, P. M., and J. M. Gregory (2006), The climate sensitivity and its components diagnosed from Earth Radiation Budget data, J. Climate, 19, 39-52.
Forster, P.M., and K.E. Taylor (2006), Climate forcings and climate sensitivities diagnosed from coupled climate model integrations, J. Climate, 19, 6181-6194.
Gregory, J.M., R.J. Stouffer, S.C.B. Raper, P.A. Stott, and N.A. Rayner (2002), An observationally based estimate of the climate sensitivity, J. Climate, 15, 3117-3121.
Hasselman, K., 1976: Stochastic climate models. Part I: Theory. Tellus, 28, 289-305.
Intergovernmental Panel on Climate Change (2007), Climate Change 2007: The Physical Science Basis, report, 996 pp., Cambridge University Press, New York City.
Schwartz, S. E. (2007), Heat capacity, time constant, and sensitivity of the Earth’s climate system. J. Geophys. Res., 112, doi:10.1029/2007JD008746.
Spencer, R.W., and W.D. Braswell (2008a), Satellite measurements reveal a climate system less sensitive than in models, Geophys. Res. Lett., submitted. (This paper was rejected by GRL in late 2008. Some of the material contained therein will be submitted to Journal of Climate in January 2009 as part of a much more comprehensive paper.)


