
 Home/Blog
Amid all of the debate over whether the global warming pause/hiatus exists or not, I�d like to bring people back to a central issue:
Even if it has warmed in the last 15 years, the rate of surface warming (and deep-ocean warming) we have seen in the last 50 years still implies low climate sensitivity.
I will demonstrate this with a simplified version of our 1D time-dependent energy balance model (Spencer & Braswell, 2014).
The reason why you can model global average climate system temperature variations with a simple energy balance model is that, given a certain amount of total energy accumulation or loss (in Joules) over the surface of the Earth in a certain amount of time, there will be a certain amount of warming or cooling of the depth-averaged ocean temperature. This is just a statement of energy conservation, and is non-controversial.
The rate of heat accumulation is the net of �forcing� and �feedback�, the latter of which stabilizes the climate system against runaway temperature change (yes, even on Venus). On multi-decadal time scales, we can assume without great error that the ocean is the dominant “heat accumulator” in climate change, with the land tagging along for the ride (albeit with a somewhat larger change in temperature, due to its lower effective heat capacity). The rate at which extra energy is being stored in the deep ocean has a large impact on the resulting surface temperature response.
The model feedback parameter lambda (which determines equilibrium climate sensitivity, ECS=3.8/lambda) is adjustable, and encompasses every atmospheric and surface process that changes in response to warming to affect the net loss of solar and infrared energy to outer space. (Every IPCC climate model will also have an effective lambda value, but it is the result of the myriad processes operating in the model, rather than simply specified).
Conceptually, the model looks like this:
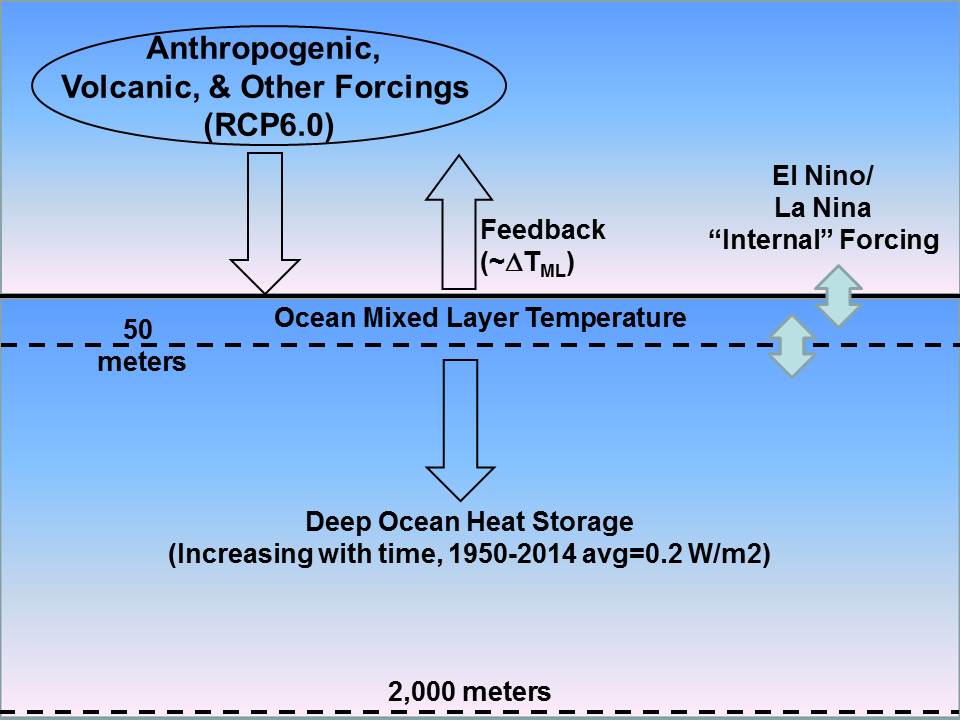
Fig. 1. Simple time-dependent 1 layer model of global oceanic average mixed layer tamperature.
I have simplified the model so that, rather than having many ocean layers over which heat is diffused (as in Spencer & Braswell, 2014), there is just a top (mixed) layer that �pumps� heat downward at a rate that matches the observed increase in deep-ocean heat content over the last 50 years. This has been estimated to be 0.2 W/m2 since the 1950s increasing to maybe 0.5 W/m2 in the last 10 years.
I don�t want to argue whether this deep ocean warming might not even be occurring. Nor do I want to argue whether the IPCC-assumed climate forcings are largely correct. Instead, I want to demonstrate that , even if we assume these things AND assume the new pause-busting Karlized ocean surface temperature dataset is correct, it still implies low climate sensitivity.
Testing the Model Against CMIP5
If I run the model (available in spreadsheet form here) with the same radiative forcings used by the big fancy CMIP5 models (RCP 6.0 radiative forcing scenario), I get a temperature increase that roughly matches the average of all of the CMIP5 models, for the 60N-60S ocean areas (average CMIP5 results for the global oceans from the KNMI Climate Explorer):
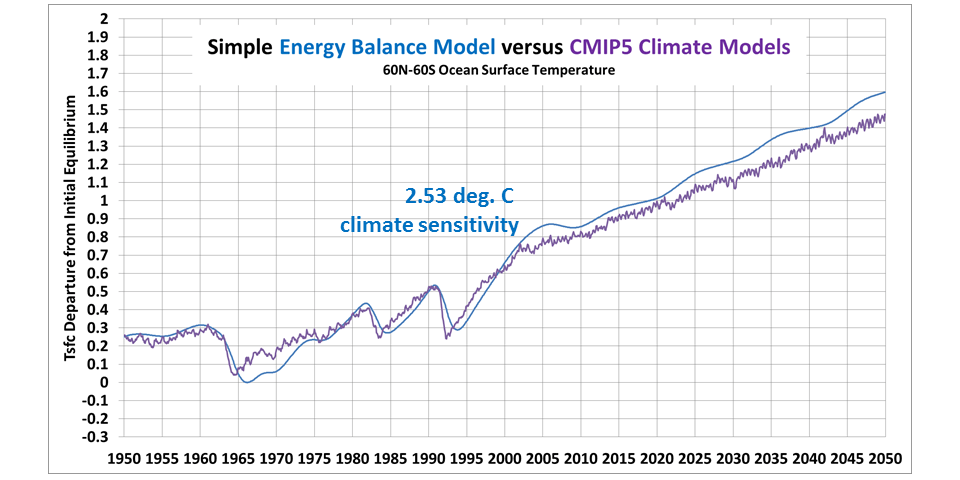
Fig. 2. Simple model run to match the average of all CMIP5 models under the RCP 6.0 radiative forcing scenario.
The climate sensitivity I used to get this result was just over 2.5 C for a doubling of atmospheric CO2, which is consistent with published numbers for the typical climate sensitivity of many of these models. To be consistent with the CMIP5 models, I assume in 1950 that the climate system is 0.25 C warmer than the �normal balanced climate� state. This affects the model feedback calculation (the warmer the climate is assumed to be from �normal� the greater the loss of radiant energy to space). Of course, we really don�t know what the �normal balanced� state of the real climate system is�or even if there is one.
Running the Model to Match the New Pause-Busting Temperature Dataset
Now, let�s see how we have to change the climate sensitivity to match the new Karlized ERSST v4 dataset, which reportedly did away with the global warming pause:
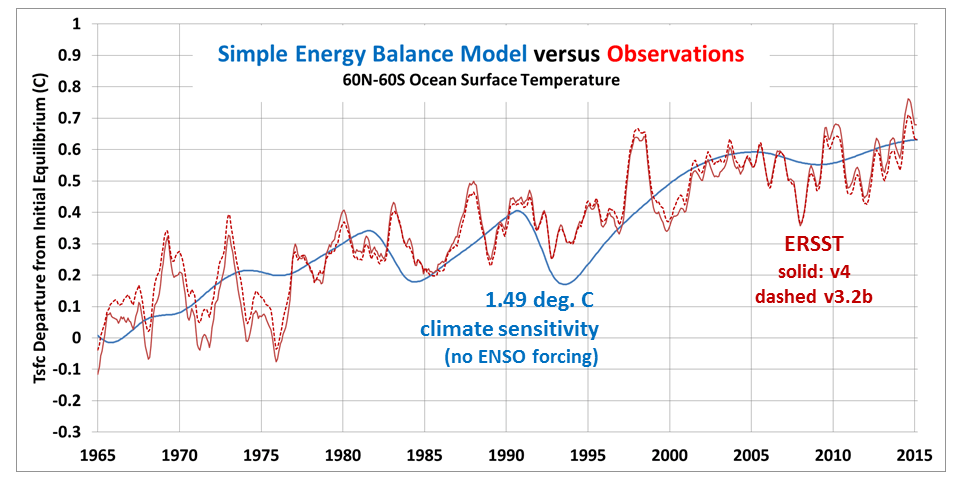
Fig. 3. Simple model match to new pause-busting ERSST (v4) dataset.
In this case, we see that a climate sensitivity of only 1.5 C was required, a 40% reduction in climate sensitivity. Notably, this is at the 1.5C lower limit for ECS that the IPCC claims. Thus, even in the new pause-busting dataset the warming is so weak that it implies a climate sensitivity on the verge of what the IPCC considers �very unlikely�.
Running the Model to Match the New Pause-Busting Temperature Dataset (with ENSO internal forcing)
Finally, let�s look at what happens when we put in the observed history El Nino and La Nina events as a small radiative forcing (more incoming during El Nino, outgoing during La Nina, evidence for which was presented by Spencer & Braswell, 2014) and temporary internal energy exchanges between the mixed layer and deeper layers:
![Fig. 4. As in Fig. 3, but with El Nino and La Nina variations included in the model (0.3 W/m2 per MEI unit radiative forcing, 0.4 W/m2 per MEI unit non-radiative forcing [heat excahnge between mixed layer and deeper layers]).](https://www.drroyspencer.com/wp-content/uploads/Simple-model-ERSST-match-with-ENSO.png)
Fig. 4. As in Fig. 3, but with El Nino and La Nina variations included in the model (0.3 W/m2 per MEI unit radiative forcing, 0.4 W/m2 per MEI unit non-radiative forcing [heat excahnge between mixed layer and deeper layers]).
Now we have reduced the required climate sensitivity necessary to explain the observations to only 1.3 C, which is nearly a 50% ECS reduction below the 2.5C necessary to match the CMIP5 models. This result is similar to the one achieved by Spencer & Braswell (2014).
Comments
The simplicity of the model is not a weakness, as is sometimes alleged by our detractors — it�s actually a strength. Since the simple model time step is monthly, it avoids the potential for �energy leakage� in the numerical finite difference schemes used in big models during long integrations. Great model complexity does not necessarily get you closer to the truth.
In fact, we�ve had 30 years and billions of dollars invested in a marching army of climate modelers, and yet we are no closer to tying down climate sensitivity and thus estimates of future global warming and associated climate change. The latest IPCC report (AR5) gives a range from 1.5 to 4.5 C for a doubling of CO2, not much different from what it was 30 years ago.
There should be other simple climate model investigations like what I have presented above, where basic energy balance considerations combined with specific assumptions (like the deep oceans storing heat at an average rate of 0.2 W/m2 over the last 50 years) are used to diagnose climate sensitivity by matching the model to observations.
The IPCC apparently doesn�t do this, and I consider it a travesty that they don�t. 😉
I’ll leave it up to the reader to wonder why they don’t.


