
 Home/Blog
Coolest tropics since June, 2012 at -0.12 deg. C.
The Version 6.0 global average lower tropospheric temperature (LT) anomaly for January, 2018 was +0.26 deg. C, down from the December, 2017 value of +0.41 deg. C:
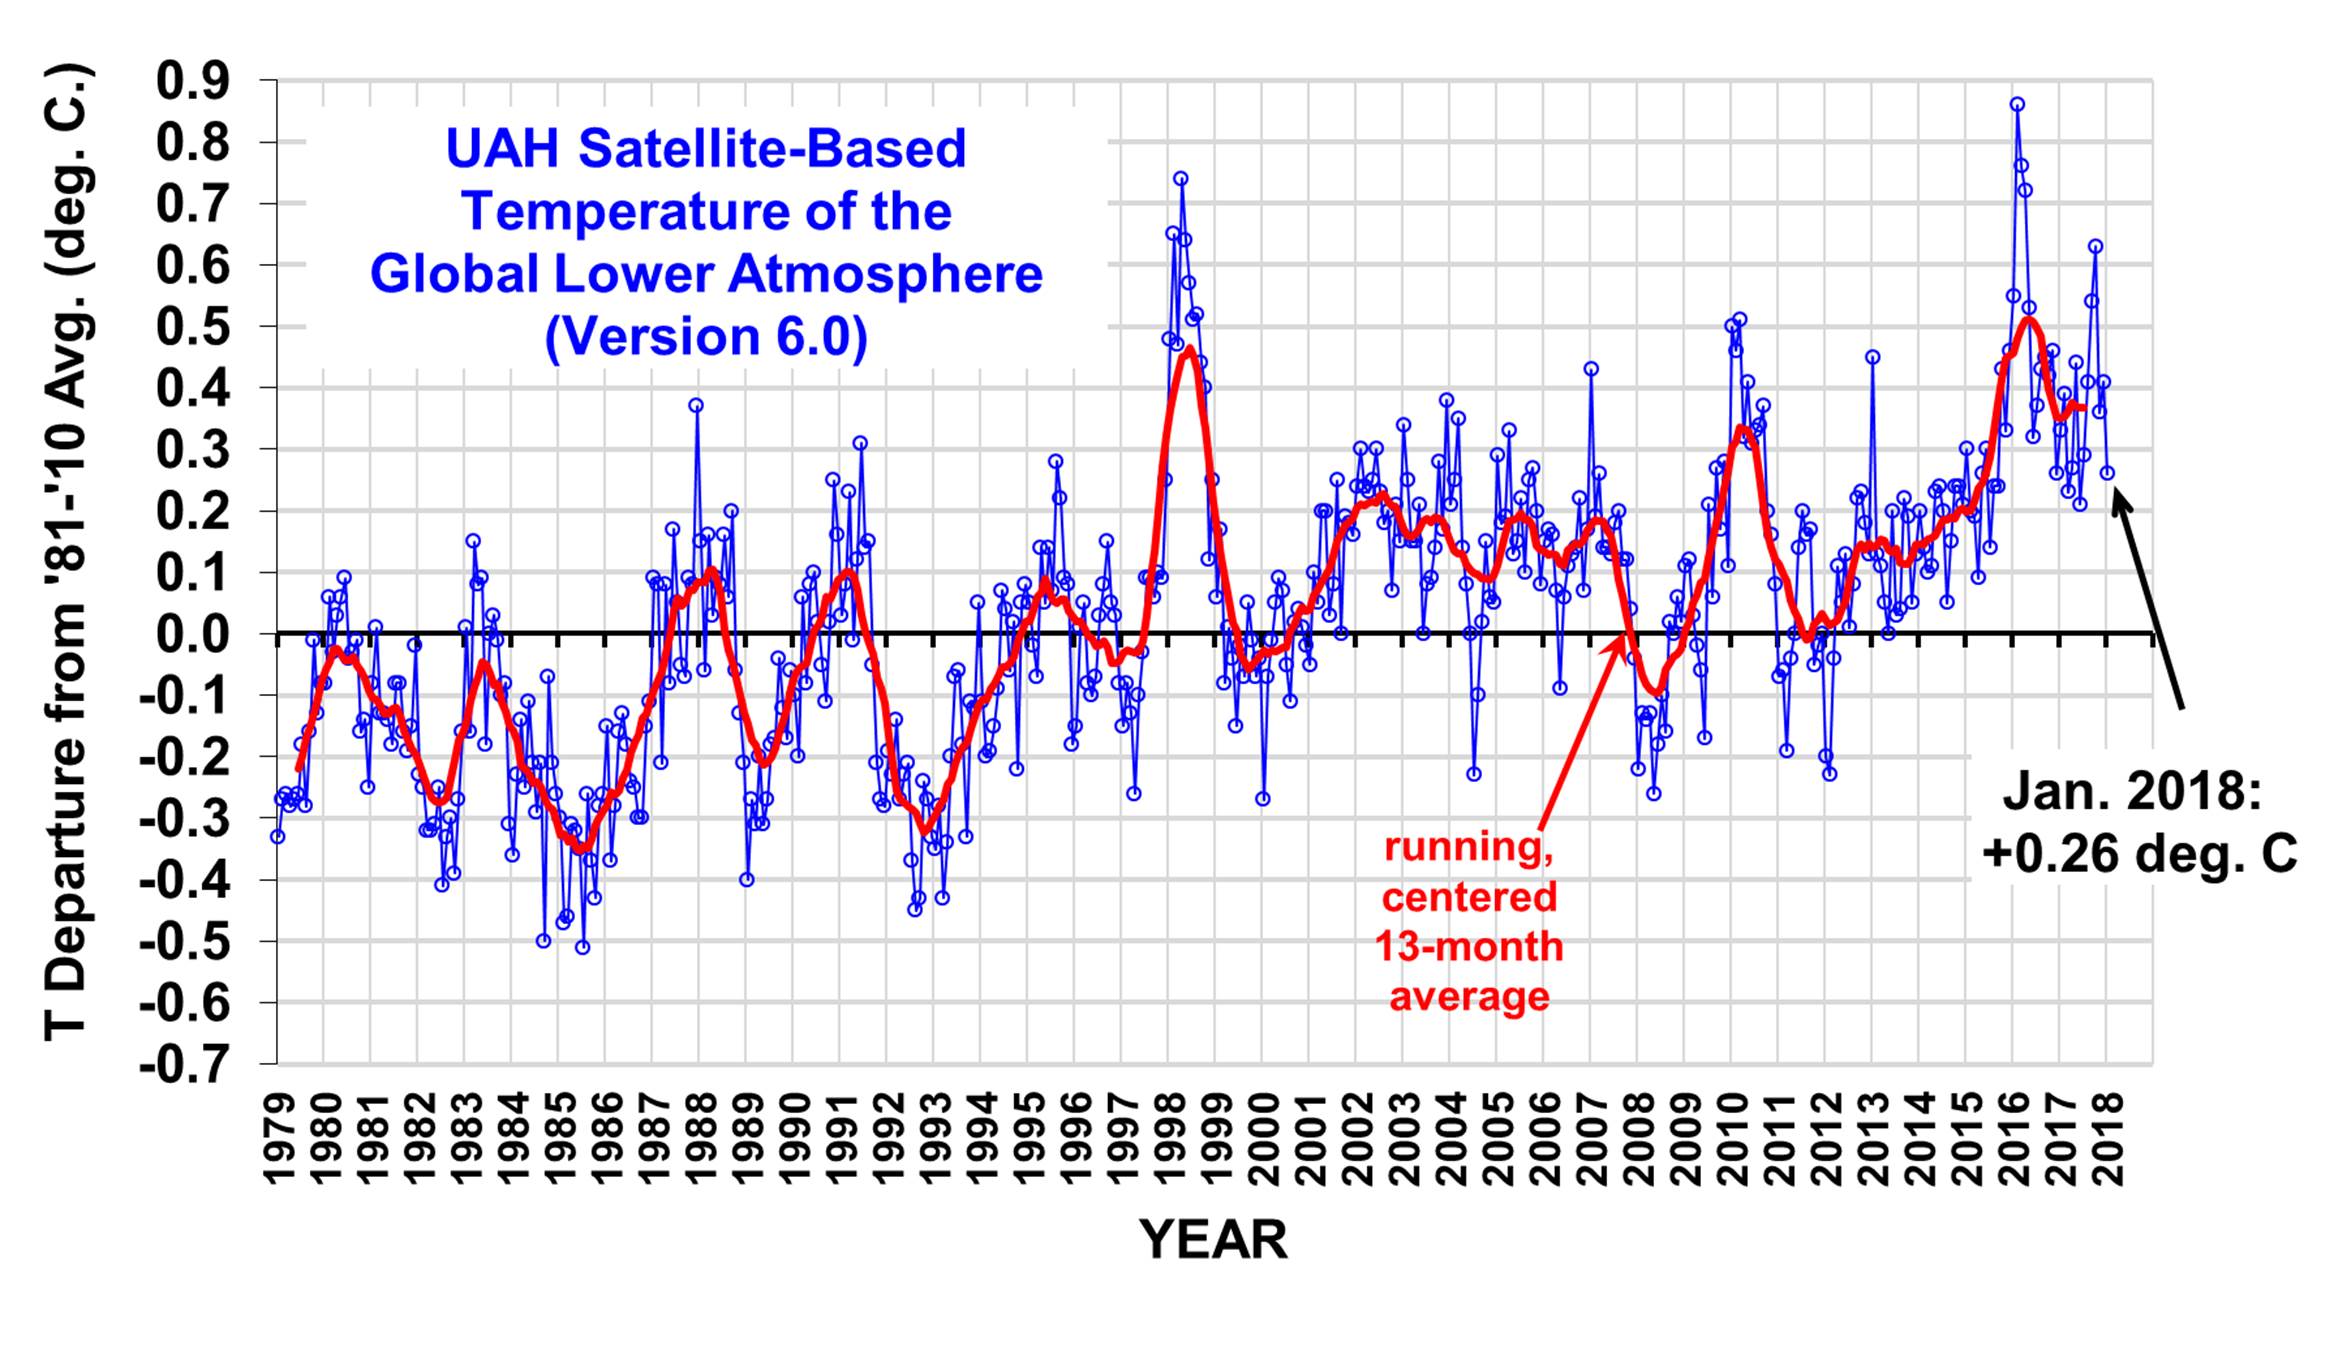
Global area-averaged lower tropospheric temperature anomalies (departures from 30-year calendar monthly means, 1981-2010). The 13-month centered average is meant to give an indication of the lower frequency variations in the data; the choice of 13 months is somewhat arbitrary… an odd number of months allows centered plotting on months with no time lag between the two plotted time series. The inclusion of two of the same calendar months on the ends of the 13 month averaging period causes no issues with interpretation because the seasonal temperature cycle has been removed as has the distinction between calendar months.
The global, hemispheric, and tropical LT anomalies from the 30-year (1981-2010) average for the last 13 months are:
YEAR MO GLOBE NHEM. SHEM. TROPICS
2017 01 +0.33 +0.31 +0.34 +0.10
2017 02 +0.38 +0.57 +0.20 +0.08
2017 03 +0.23 +0.36 +0.09 +0.06
2017 04 +0.27 +0.28 +0.26 +0.21
2017 05 +0.44 +0.39 +0.49 +0.41
2017 06 +0.21 +0.33 +0.10 +0.39
2017 07 +0.29 +0.30 +0.27 +0.51
2017 08 +0.41 +0.40 +0.42 +0.46
2017 09 +0.54 +0.51 +0.57 +0.54
2017 10 +0.63 +0.66 +0.59 +0.47
2017 11 +0.36 +0.33 +0.38 +0.26
2017 12 +0.41 +0.50 +0.33 +0.26
2018 01 +0.26 +0.46 +0.06 -0.12
Note that La Nina cooling in the tropics has finally penetrated the troposphere, with a -0.12 deg. C departure from average. The last time the tropics were cooler than this was June, 2012 (-0.15 deg. C). Out of the 470 month satellite record, the 0.38 deg. C one-month drop in January tropical temperatures was tied for the 3rd largest, beaten only by October 1991 (0.51 deg. C drop) and August, 2014 (0.41 deg. C drop).
The last time the Southern Hemisphere was this cool (+0.06 deg. C) was July, 2015 (+0.04 deg. C).
The linear temperature trend of the global average lower tropospheric temperature anomalies from January 1979 through January 2018 remains at +0.13 C/decade.
The UAH LT global anomaly image for January, 2018 should be available in the next few days here.
The new Version 6 files should also be updated in the coming days, and are located here:
Lower Troposphere: http://vortex.nsstc.uah.edu/data/msu/v6.0/tlt/uahncdc_lt_6.0.txt
Mid-Troposphere: http://vortex.nsstc.uah.edu/data/msu/v6.0/tmt/uahncdc_mt_6.0.txt
Tropopause: http://vortex.nsstc.uah.edu/data/msu/v6.0/ttp/uahncdc_tp_6.0.txt
Lower Stratosphere: http://vortex.nsstc.uah.edu/data/msu/v6.0/tls/uahncdc_ls_6.0.txt


Nice response in return of this query with firm arguments
and explaining everything regarding that.
Hello there! This post could not be written any
better! Reading this post reminds me of my
previous room mate! He always kept chatting about this.
I will forward this post to him. Pretty sure he will have a good read.
Thank you for sharing!
Today, I went to the beach with my children. I found a sea shell and gave it to my 4 year old daughter and said “You can hear the ocean if you put this to your ear.” She put the shell to her ear and screamed.
There was a hermit crab inside and it pinched her ear.
She never wants to go back! LoL I know this is totally off topic but I had
to tell someone!