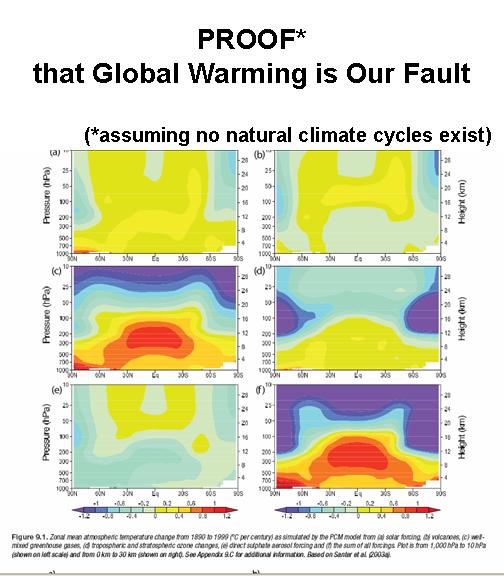
It is claimed by the IPCC that there are ‘fingerprints’ associated with global warming which can be tied to humanity’s greenhouse gas emissions, as if the signatures were somehow unique like real fingerprints.
But I have never been convinced that there is ANY fingerprint of anthropogenic warming. And the reason is that any sufficiently strong radiative warming influence – for instance, a small (even unmeasurable) decrease in cloud cover letting in slightly more sunlight starting back in the late 1970’s or 1980’s– would have had the same effect.
The intent of the following figure from Chapter 9 in the latest (AR4) version IPCC report is to convince the reader that greenhouse gas emissions have been tested against all other sources of warming, and that GHGs are the only agent that can cause substantial warming. (The snarky reference to “proof” is my addition.)

But all the figure demonstrates is that the warming influence of GHGs is stronger than that from a couple of other known external forcing mechanisms, specifically a very small increase in the sun’s output, and a change in ozone. It says absolutely nothing about the possibility that warming might have been simply part of a natural, internal fluctuation (cycle, if you wish) in the climate system.
For instance, the famous “hot spot” seen in the figure has become a hot topic in recent years since at least two satellite temperature datasets (including our UAH dataset), and most radiosonde data analyses suggest the tropical hotspot does not exist. Some have claimed that this somehow invalidates the hypothesis that anthropogenic greenhouse gas emissions are responsible for global warming.
But the hotspot is not a unique signature of manmade greenhouse gases. It simply reflects anomalous heating of the troposphere — no matter what its source. Anomalous heating gets spread throughout the depth of the troposphere by convection, and greater temperature rise in the upper troposphere than in the lower troposphere is because of latent heat release (rainfall formation) there.
For instance, a natural decrease in cloud cover would have had the same effect. It would lead to increased solar warming of the ocean, followed by warming and humidifying of the global atmosphere and an acceleration of the hydrologic cycle.
Thus, while possibly significant from the standpoint of indicating problems with feedbacks in climate models, the lack of a hotspot no more disproves manmade global warming than the existence of the hotspot would have proved manmade global warming. At most, it would be evidence that the warming influence of increasing GHGs in the models has been exaggerated, probably due to exaggerated positive feedback from water vapor.
The same is true of the supposed fingerprint of greater warming over land than over the ocean, of which there is some observational evidence. But this would also be caused by a slight decrease in cloud cover…even if that decrease only occurred over the ocean (Compo, G.P., and P. D. Sardeshmukh, 2009).
What you find in the AR4 report is artfully constructed prose about how patterns of warming are “consistent with” that expected from manmade greenhouse gases. But “consistent with” is not “proof of”.
The AR4 authors are careful to refer to “natural external factors” that have been ruled out as potential causes, like those seen in the above figure. I can only assume this is was deliberate attempt to cover themselves just in case most warming eventually gets traced to natural internal changes in the climate system, rather than to that exceedingly scarce atmospheric constituent that is necessary for life of Earth – carbon dioxide.

 Home/Blog


