Archive for July, 2014

Sunset and Moonset Time Lapse Videos

Wednesday, July 30th, 2014

With the record cool (and dry) weather here in north Alabama, I decided to try some time lapse video of the setting crescent moon.

The first video, from two evenings ago, has both sunset and moonset (on the left side)…click on the full-screen icon to see in highest definition:

The second, from last night, shows the crescent moon setting behind the Saturn V rocket at the U.S. Space and Rocket Center, 7 miles away:

Both taken with a Canon 6D, 85mm f/1.2 lens (first video) and 200mm f/2.8 lens w/2X extender (2nd video).

Paul Budline Productions 5 min Video of Heartland ICCC9 Conference

Friday, July 25th, 2014

If you couldn’t attend Heartland’s 9th International Conference on Climate Change in Las Vegas a couple weeks ago, this 5 minute video by Paul Budline Productions gives a flavor of what was talked about there:

The Spencer Identity for Global Temperature Trend Calculation

Friday, July 25th, 2014

After reading the comments I got on my post The Kaya Identity Crisis, I thought it would be good to follow up with a little more discussion regarding how you can create an equation with physical units that work out, but the equation is not necessarily useful.

My point was that the Kaya Identity was fine from a mathematical point of view, but I suppose I should have emphasized more that the terms in the Kaya equation (which relates total global carbon dioxide emissions to the product of population, per capita GDP, energy intensity, and CO2 emissions per unit energy used) were certainly open to debate.

So, since I’m not as knowledgeable about economics concepts as I am about global temperature trends, I thought it would be cool to have my own equation: The Spencer Identity.

I have thoroughly researched this equation for at least 15 minutes, and I believe the units balance, and it makes some physical sense (which is a good thing).

The equation doesn’t give you the real global temperature trend, which we can never know. It instead gives the consensus temperature trend, which (we have found out) is the result of political institutions and the funding they provide to researchers willing to play along:

the Spencer Identity for government-reported temperature trends:

T = s[L x D x H x W]

where:

T = official government-reported global average temperature trend (deg. C/decade)
s = scale factor to allow easy adjustment of consensus temperature trends based upon prevailing opinion (dimensionless)
L = the number of liberal politicians in power
D = the dollars in government climate research funding per liberal politician
H = the number of hockey sticks created per research dollar spent (or maybe you could substitute mythical polar bear deaths or hidden temperature declines or number of climate models)
W = the rate of warming per hockey stick

As I said, I believe the units balance and the terms of the equation have meaning. I’m sure others can develop improved versions of the equation, so maybe this can be considered an open source project.

EPA Admits to Senate that CO2 Regs Not About Pollution Control

Friday, July 25th, 2014

I usually don’t comment on what transpires in congressional hearings. But this is too good to pass up.

On Wednesday, before the Senate EPW Committee, EPA Administrator Gina McCarthy had this priceless quote regarding the EPA’s proposed carbon dioxide regulations (italics added):

“And the great thing about this proposal is it really is an investment opportunity. This is not about pollution control. It’s about increased efficiency at our plants…It’s about investments in renewables and clean energy. It’s about investments in people’s ability to lower their electricity bills by getting good, clean, efficient appliances, homes, rental units.”

Mmm hmmm. Kind of like investment in Solyndra? Or Tesla?

Why not go all the way…just put all Americans to work digging holes in the ground and filling them up again. No unemployment. Great investment opportunity for shovels and backhoe manufacturers. And we won’t be wasting all of that energy on transportation because the work can be right at home!

This gaffe could come back to bite the EPA. The Endangerment Finding was all about the negative effect of “carbon pollution” on the environment. Now we find out “this is not about pollution control”?

Wow.

Record Canada Wildfires Blamed On…

Friday, July 25th, 2014

Our friends to the north in the sovereign republic of Canuckistan are experiencing record wildfire activity. At least in northwest Canada, where it has been unusually hot and dry.

Four days ago things were getting pretty bad, as seen in this NASA MODIS image (click for large version):

NASA MODIS image of western Canada and the northern U.S., July 21, 2014.

NASA MODIS image of western Canada and the northern U.S., July 21, 2014.

By yesterday, the smoke from the fires had spread to the Great Lakes (yes, here comes that Canadian pollution again):

As in previous image, but for July 24, 2014.

As in previous image, but for July 24, 2014.

Of course, experts quoted in the news dutifully blamed it in climate change. According to Alaska Dispatch News,

Canada’s senior climatologist, Dave Phillips, says the southern Northwest Territories is experiencing the hottest, driest summer in some 50 years.

The extremely hot dry weather in the interior and north of British Columbia is now contributing to the spread of a number of fires in that west coast province.

Phillips adds the kind of weather seen this year is what global warming modeling predicted for 40 years from now.

Now, wherever it is hot and dry where vegetation exists, we can expect above normal wildfire activity. But the hot and dry conditions in the west are almost always matched by cool and wet conditions in the east, which is what we have seen in recent months.

It makes no sense to talk about above normal activity in one area, and ignore below normal activity elsewhere, when claiming a link to climate change. It is intellectually lazy and verges on incompetence.

Another cold front will be pushing all the way to the Gulf coast by next Wednesday, producing more record low temperatures, as see in this Weatherbell.com graphic:

GFS model minimum temperature anomaly forecast for Wednesday  July 30, 2014 (Weatherbell.com).

GFS model minimum temperature anomaly forecast for Wednesday July 30, 2014 (Weatherbell.com).

Anytime this happens (which is rare this time of year, at least here in Alabama) you can virtually guarantee hot and dry weather over western Canada and the western U.S. It’s called “weather”.

The Kaya Identity Crisis

Thursday, July 24th, 2014

Mr-Kaya-name-tag
There have been several posts over at WUWT regarding whether the Kaya Identity equation is useful, or mathematically trivial, or just a tautology.

The Kaya Identity is a specific application of the more general “IPAT” (I=PAT) equation which estimates the global environmental impact “I” based upon what are believed to be the main drivers of I, usually put in terms that economists find useful and can estimate…population, per capita GDP, etc. You can read more about it here.

To get total global CO2 emissions with the Kaya Identity, you multiply together (1) population , (2) GDP per person (affluence term), (3) energy used per GDP (energy intensity) and (4) the amount of CO2 released per energy used. Again, the terms used are ones economists work with, and so it is more useful in economics and policymaking circles than in, say, climate science.

As Willis Eschenbach pointed out, simply as an algebraic equation, you can cancel out terms in the Kaya equation and get the trivial result that CO2 = CO2. This is what seems to have generated much of the hoopla over at WUWT.

But the same as true of just about any equation where the physical units must balance on both sides: say, the equation to estimate the miles driven if you know the average speed and the total time driving:

Miles = [hours]x[miles/hour]

You can cancel out the “hour” terms in the above equation, and get the seemingly trivial result that “miles=miles”… but the equation is still useful.

The same is true of the Kaya Identity. It is a useful tool, to the extent that the individual terms on the right hand side really are the main economic-related drivers of the quantity on the left hand side…and the units match.

Also, as Willis points out, you can put all kinds of silly terms in an equation with the units on both sides simplifying to the same thing. But the unit matching is only a necessary – but not a sufficient – condition for an equation to be physically meaningful.

The bottom line is that I don’t see anything wrong with the Kaya Equation.

June 2014 Update of SSM/I Ocean Products

Wednesday, July 23rd, 2014

The SSM/I and SSMIS series of microwave imagers, operating since July 1987, provide global oceanic measurements of total vertically integrated water vapor, cloud water, rain rate, and surface wind speed. These are useful for studying how the maritime atmosphere varies due to El Nino and La Nina, as well as provides ~27 year trends for climate change studies.

The best place to start is with what the SSM/I instruments can’t measure, which is sea surface temperature. Here are the monthly global (60N-60S) average SST variations since 1987:

Fig. 1. Monthly global (60N-60S) sea surface temperature anomalies since 1987 from HadSST3 data.

Fig. 1. Monthly global (60N-60S) sea surface temperature anomalies since 1987 from HadSST3 data.


As can be seen, there has been net warming of the ocean surface since 1987, a relative “pause” in the warming trend since the 1997-98 El Nino, and the global SST value for June 2014 was near a “record” high.

The SSM/I integrated water vapor measurements provide a powerful check on the SST measurements, since water vapor is tightly coupled to SST:

Fig. 2. As in Fig. 1, but for SSM/I integrated water vapor.

Fig. 2. As in Fig. 1, but for SSM/I integrated water vapor.


Note that the SSM/I integrated water vapor was at a record high in June, 2014, probably the result of the developing El Nino.

If we compare the SST and water vapor variations, the quantitative relationship between them is about ~11% water vapor increase per deg. of SST increase:

Fig. 3. Scatter plot of the SST and water vapor in Figs. 1 and 2, with a 1 month time lag (vapor after SST).

Fig. 3. Scatter plot of the SST and water vapor in Figs. 1 and 2, with a 1 month time lag (vapor after SST).


I have included a 1 month time lag in the plot (vapor after SST), which maximizes the correlation. The 11% per deg. relationship is considerably greater than the 7% per deg. expected from the assumption of constant relative humidity. Why? I’m not sure, but I suspect it might be due to a change in the vertical distribution of vapor with height during warming. If the falloff of specific humidity with height becomes steeper with warming, the water vapor retrieval Frank Wentz uses will overestimate the amount of water vapor. This explanation would also be consistent with radiosonde evidence of a multidecadal decrease in mid- and upper-tropospheric water vapor, and potentially neutral (or even negative) water vapor feedback.

The SSM/I cloud water remains high, as it has in recent years…several percent above most of the period record:

Fig. 4. SSM/I global average oceanic integrated cloud water anomalies.

Fig. 4. SSM/I global average oceanic integrated cloud water anomalies.


As I have blogged about before, there is a correlation between the SSM/I cloud water and the CERES net radiative flux variations, so the recent elevated cloud water amounts lead to less sunlight entering the oceans, which is consistent with the recent hiatus in warming.

The SSM/I oceanic rainfall has increased in recent years, but I’m not sure how much of this is real or is due to residual algorithm cross-talk from the cloud water signal, since cloud water has also increased:

Fig. 5. SSM/I global ocean rainfall anomalies.

Fig. 5. SSM/I global ocean rainfall anomalies.

Finally, the SSM/I ocean surface wind speed anomalies suggest that the ~2% increase in winds after the 1997-98 El Nino seems to have ended…although going into El Nino conditions will also produce reduced wind speeds:

Fig. 6. SSM/I global average ocean surface wind speed variations.

Fig. 6. SSM/I global average ocean surface wind speed variations.


As I have mentioned before, I believe this wind speed record is the most accurate one in existence. I find it hard to believe that a 2% increase in winds caused (as Trenberth claims) the warming pause and increased heat storage in the deeper ocean. If it did, it looks like that effect should have gone away in the last few years.

Intellectual and Practical Foolishness: The Precautionary Principle

Friday, July 18th, 2014

Famous supporter of the Precautionary Principle.

Famous supporter of the Precautionary Principle.


The Precautionary Principle (PP) underlies a wide variety of policy efforts around the world today, including energy policy and the debate over the continued use of fossil fuels and the risk they pose regarding climate change. In the European Union, it is even required to be followed in some matters of statutory law.

According to Wikipedia, the Precautionary Principle states:

“if an action or policy has a suspected risk of causing harm to the public or to the environment, in the absence of scientific consensus that the action or policy is not harmful, the burden of proof that it is not harmful falls on those taking an action.”

Now, the foolishness of the PP is that it addresses the potential risks of a particular action without addressing the benefits.

This is just plain silliness, and a prescription for human suffering and death. Every modern advance, invention, or convenience you can think of has risks, and those risks must be weighed against their benefits.

There is no such thing as a no-risk human activity.

People even die from choking on food. Maybe we should outlaw food.

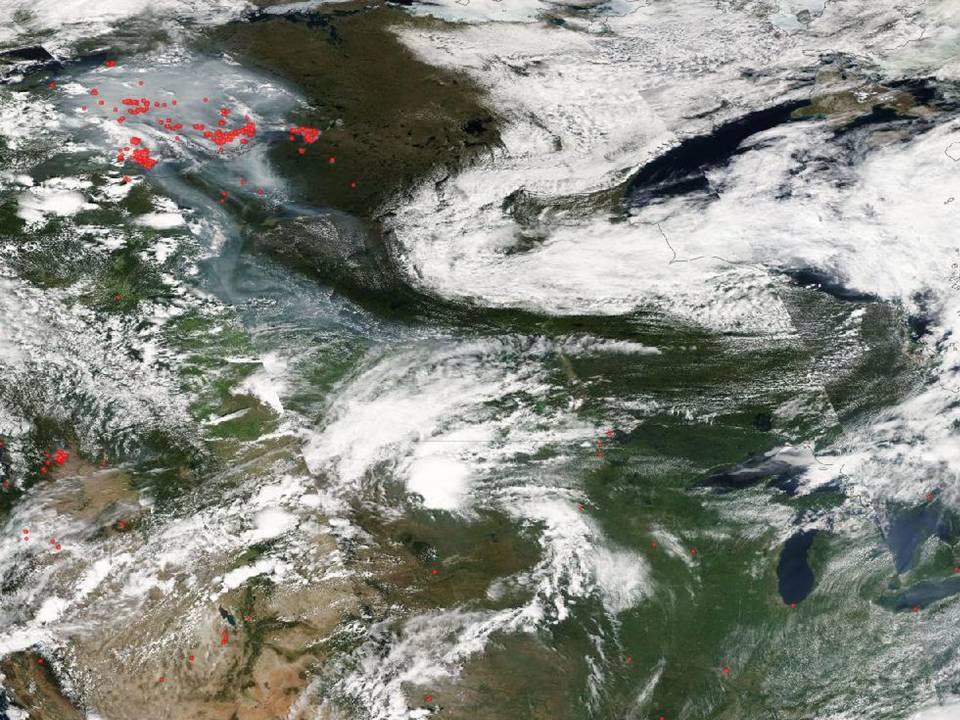
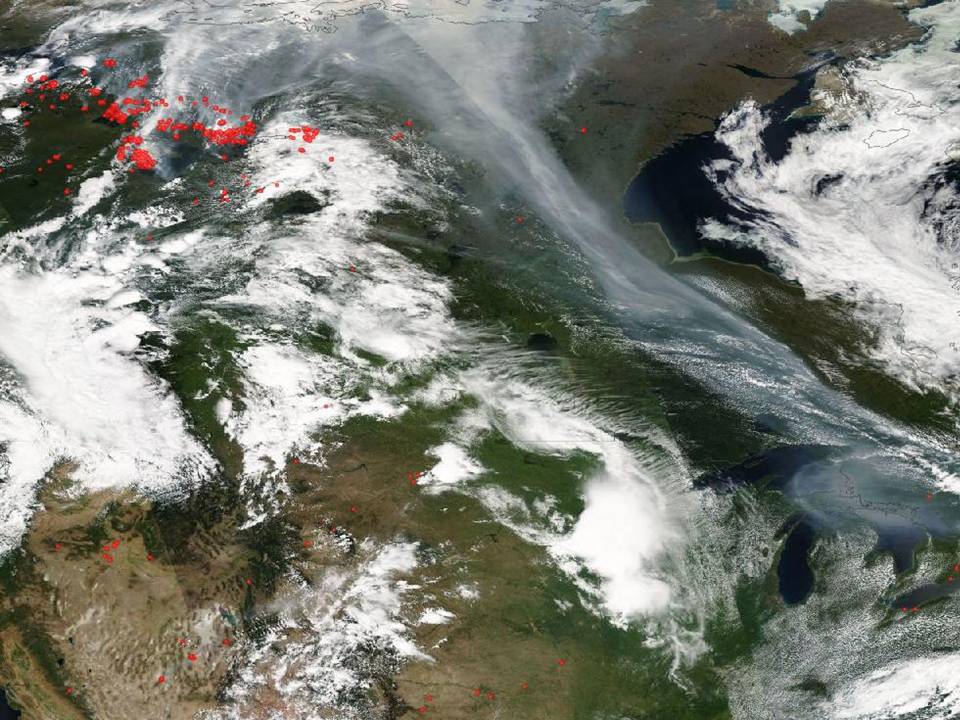
In the early years of the environmental movement, bad science combined with PP idealism led to restrictions on the use of DDT to control mosquitoes, which then led to at least tens of millions of needless deaths.

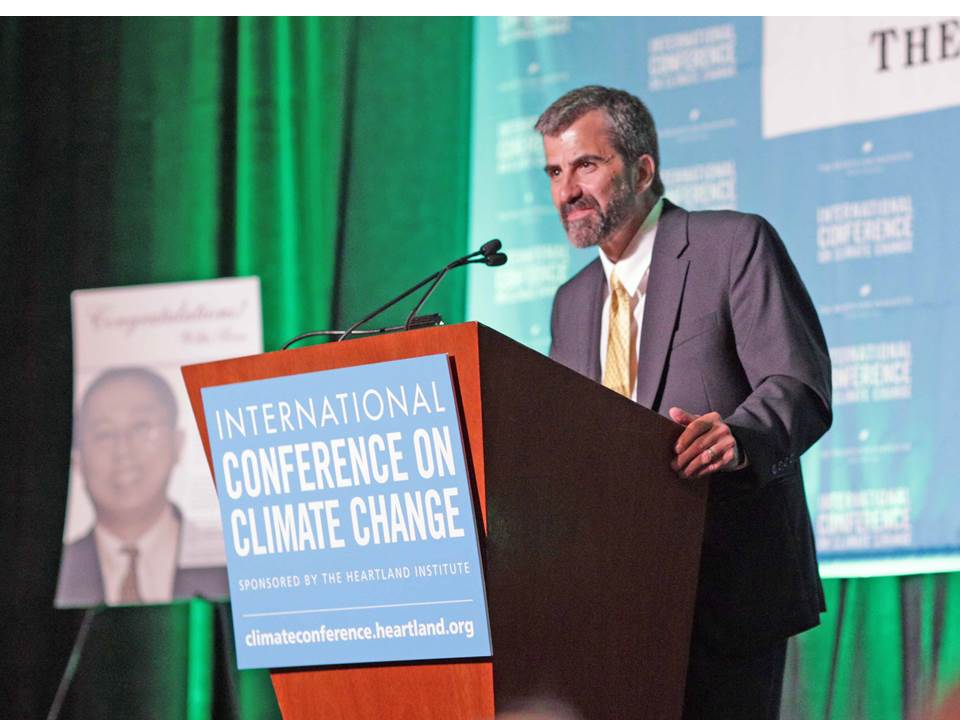
On the global warming front, the PP came up (at least implicitly) in the recent New York Times article profiling John Christy. While that article at least allowed Dr. Christy to state his position on climate change (kudos to NYT for that), Kerry Emanuel in that article likened the risk of not addressing climate change to telling a young girl to run across a busy street to catch her bus. The result could be deadly.

Now, I should be clear that John is OK with that article…it turned out better than he expected it would (we have a long history of being burned by the mainstream media).

But I’m not going to let misguided policy advice from scientists to go unchallenged.

This Precautionary Principle idea that guides people like Kerry Emanuel is nonsense. (I like Kerry, BTW, and he is a top-notch atmospheric researcher). Would we abandon our most abundant and affordable energy sources, required for nearly everything we do, on the chance that there might be some non-zero negative consequence to adding 1 or 2 additional CO2 molecules to each 10,000 molecules of air?

And what about the benefits of more atmospheric CO2? Fewer temperature-related deaths, global greening, increased crop productivity, etc.? We should not accept the premise that more CO2 in the atmosphere is necessarily bad for life on Earth.

The people who advocate the PP are also the ones who have benefited from the advances modern science and engineering have provided us. And all of those advances carry risks.

I suspect the 1+ billion people still without electricity, or who are still using wood and dung for heating and cooking, would see things differently, too.

I realize I have mentioned the PP before, but the NYT article got me thinking about just how pervasive (and non-critical) a mindset this is becoming.

People like me are often asked the question, “But what if you are wrong?” regarding our skepticism that human-caused climate change is going to be something that requires a policy response.

Well, what if they are wrong? I have often said that human caused climate change presents theoretical risks, whereas restricting access to abundant and affordable energy causes real poverty and real deaths.

If they really want to follow the Precautionary Principle, then they should follow their own prescription, which I am rephrasing from the Wikipedia definition of the PP:

If reducing fossil fuel use has a suspected risk of causing harm to the public, in the absence of economic consensus that the reduction is not harmful, the burden of proof that it is not harmful falls on those advocating such a reduction.

2014 Global SST Not Looking Like a Record…So Far

Friday, July 18th, 2014

I was perusing Bob Tisdale’s analysis of global average sea surface temperatures (SST) through June 2014 and noticed that the OISST product (which has a heavy reliance on satellite infrared measurements) has been suggesting 2014 might be a record warm year, at least for SST.

So, I decided to update the satellite microwave-based SST data from RSS (comprised of the AMSR-E, TMI, and Windsat satellite datasets), and it tells a different story, with 2014 not quite as warm as the last time we were ramping into El Nino conditions (2009):

Satellite microwave SST anomalies (global) since mid-2002, updated through mid-July 2014.

Satellite microwave SST anomalies (global) since mid-2002, updated through mid-July 2014.

I don’t have an obvious explanation for the discrepancy. There are a few possibilities…

1) The microwave measurements are much less susceptible to cloud and aerosol contamination, and have a better satellite diurnal drift adjustment.

2) I restrict the analysis to 60 deg. N latitude, to avoid sea ice issues, while the OISST product goes farther north….but I would think that this is such a small area that it would not affect the global averages substantially.

3) I also use a fairly short period to compute the anomalies relative to, but this has no effect when comparing the same calendar months (e.g. January thrugh June, 2014 versus 2009).

In any event, it appears there are some discrepancies regarding just how warm 2014 is shaping up to be. With a strong El Nino increasingly unlikely, I’m still betting that 2014 will not be a record warm year.

Heartland’s 9th International Conference on Climate Change: A Skepticism Tipping Point?

Thursday, July 17th, 2014
Heartland Institute President Joe Bast opens ICCC9 in Las Vegas.

Heartland Institute President Joe Bast opens ICCC9 in Las Vegas.

I’ve been thinking about the recent “skeptics conference” in Las Vegas.

First of all, this was easily the most energetic of the Heartland conferences held over the years. Clearly, we skeptics feel our point of view is being vindicated, that (1) warming is relatively benign, (2) warming is only partly human-caused, (3) the benefits of more CO2 in the atmosphere appear to greatly outweigh the risks, and (4) there’s little that can be done about reducing CO2 emission anyway, until we have new energy technologies sufficient to meet global energy demand.

I have to wonder just how massive such a conference would be if the government were to actually fund research into natural causes of climate change. The funding is so severely stacked against the skeptics’ side that our movement remains at a mostly grassroots level.

But they can’t ignore our arguments any longer. For many years we had been hearing from the “scientific consensus” side that natural climate change is nowhere near as strong as human-caused warming…yet the lack of surface warming in 17 years has forced those same scientists to now invoke natural climate change to supposedly cancel out the expected human-caused warming!

C’mon guys. You can’t have it both ways! They fail to see that a climate system capable of cancelling out warming with natural cooling is also capable of causing natural warming in the first place.

Secondly, the conference was very well organized. To all appearances, it went very smoothly. I was struck by the variety of styles and messages presented by the keynote speakers.

I thought Patrick Moore’s talk was the most powerful. As a 15-year member of the original Greenpeace movement, Patrick described how that organization morphed from helping to hurting humanity.

Lord Monckton closed the conference with a clever poll of the 600+ member audience that revealed a 100% “consensus” that climate does indeed change (there were no “climate change deniers” there), and that humans probably contribute to that change.

I only got to attend a small fraction of the non-keynote talks given, due to repeated requests for interviews by the media. There were three parallel sessions, so at most you could only attend 1/3 of the talks. This is typical for conferences, though. Fortunately, all the talks were videotaped and are available at the Heartland website. The quality of the panel presentations varied greatly, but that’s to be expected given the relative infancy and lack of institutional funding of the movement.

The real benefit of the conference was the opportunity for the movers and shakers in this business to talk one-on-one, as well as to talk to concerned citizens who attended the conference. A wide variety of skeptical opinions on the subject were represented there, which is a good thing. I personally believe we know so little about the causes of climate change that we need to keep the lines of communication open (although readers here know I also believe the theory that there is no “greenhouse effect” is misguided).

To me, it feels like a climate skepticism tipping point has been reached.