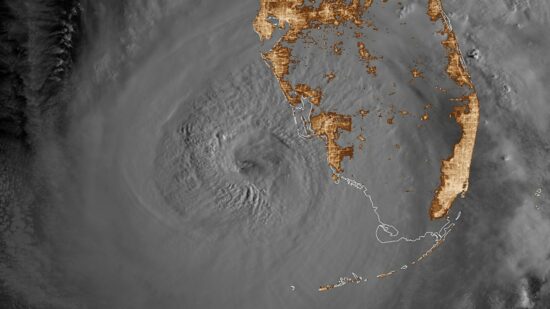
With Hurricane Ian (now a tropical storm) exiting the east coast of Florida, there is no shortage of news reports tying this storm to climate change. Even if those claims actually include data to support their case, those data are usually for cherry-picked regions and time periods. If global warming is causing a change in tropical cyclone activity, it should show up in global statistics.
The latest peer-reviewed study (March 2022, here) of the accumulated wind energy in tropical cyclones since 1990 (when we started have sufficient global data) showed a decrease in hurricane activity. There was an increase in Atlantic activity, but this was matched by an even larger decrease in Pacific activity, due to a shift from El Nino to La Nina conditions during that time.
So, yes, there is climate change involved in the uptick in Atlantic activity in recent decades. But it’s natural.
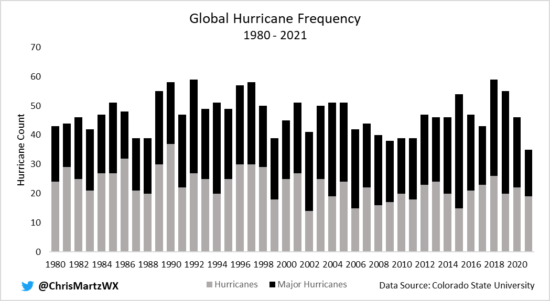
Looking at just the numbers of global hurricanes since 1980, we see no obvious trends.
Even if we did see an increase, the improvements in global satellite monitoring would be responsible for some of that. It is impossible to talk about meaningful global statistics (especially trends) before the 1980s due to a lack of satellite data. Ships of opportunity are insufficient for trend calculations, especially since ships try to avoid storms, not sample them.
A document-based study of hurricanes impacting the Lesser Antilles since the late 1600s found a downward trend (not statistically significant) in hurricane activity during 1690-2007.
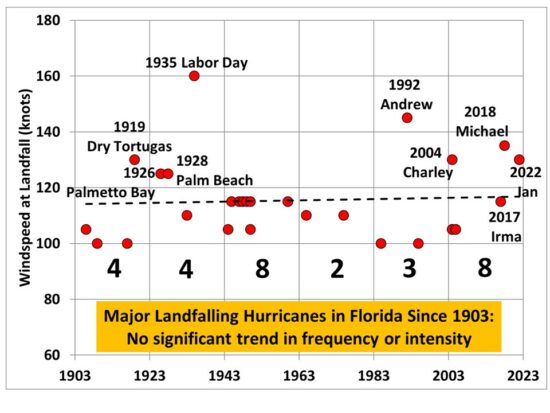
In my 2017 Kindle book Inevitable Disaster: Why Hurricanes Can’t Be Blamed on Global Warming, I looked at major hurricane landfalls in Florida, which showed no trends. With Hurricane Ian and Michael (2018) added to the dataset, there is still no statistically significant trends in either intensity or frequency of landfalling major hurricanes in Florida.
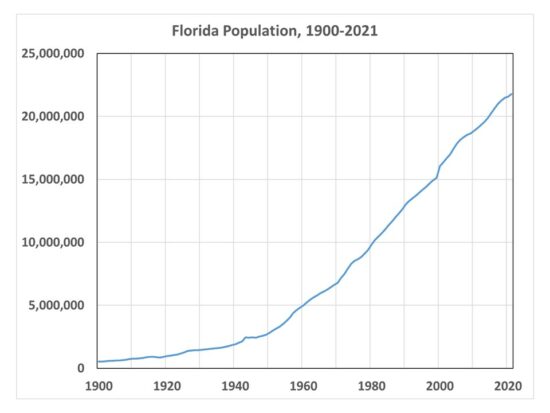
Of course hurricane damages have increased dramatically during the same period, but this is due to the explosive growth in coastal infrastructure there. Miami had only 444 residents in 1896, and now the metro area has over 6,000,000 population. As seen in the following plot, Florida population has increased by a factor of over 40 since 1900.
Given that hurricanes will always be with us, what is the best defense against them? Wealth. Hurricane Ian came ashore with 150 mph sustained winds, but warnings from modern instrumentation and forecast tools led to mass evacuations. At this writing, only 5 deaths have been reported (I’m sure that will rise). Modern building codes help reduce wind damage. I watched storm chaser Reed Timmer live reporting from the eyewall of Hurricane Ian as it made landfall, and I didn’t see any roofs coming off the houses (but I’m sure there were some that did). Damage from storm surge flooding, however, will be extensive and costly.

 Home/Blog