Archive for November, 2018

The Sorry State of Climate Science Peer Review, and Kudos to Nic Lewis

Wednesday, November 14th, 2018

For decades now those of us trying to publish papers which depart from the climate doom-and-gloom narrative have noticed a trend toward both biased and sloppy peer review of research submitted for publication in scientific journals.

Part of the problem is the increased specialization of climate science (and other sciences in general), so that there are relatively few peers who know enough about what they are reviewing to pass expert judgement on it. Instead, they simply give the paper author(s) the benefit of the doubt. I have been in this position many times when reviewing a paper for publication. This leads to group-think, as the number of experts in any sub-discipline dwindles.

If the conclusions of the paper support a more alarmist narrative on the seriousness of anthropogenic global warming, the less thorough will be the peer review. I am now totally convinced of that. If the paper is skeptical in tone, it endures levels of criticism that alarmist papers do not experience. I have had at least one paper rejected based upon a single reviewer who obviously didn’t read the paper…he criticized claims not even made in the paper.

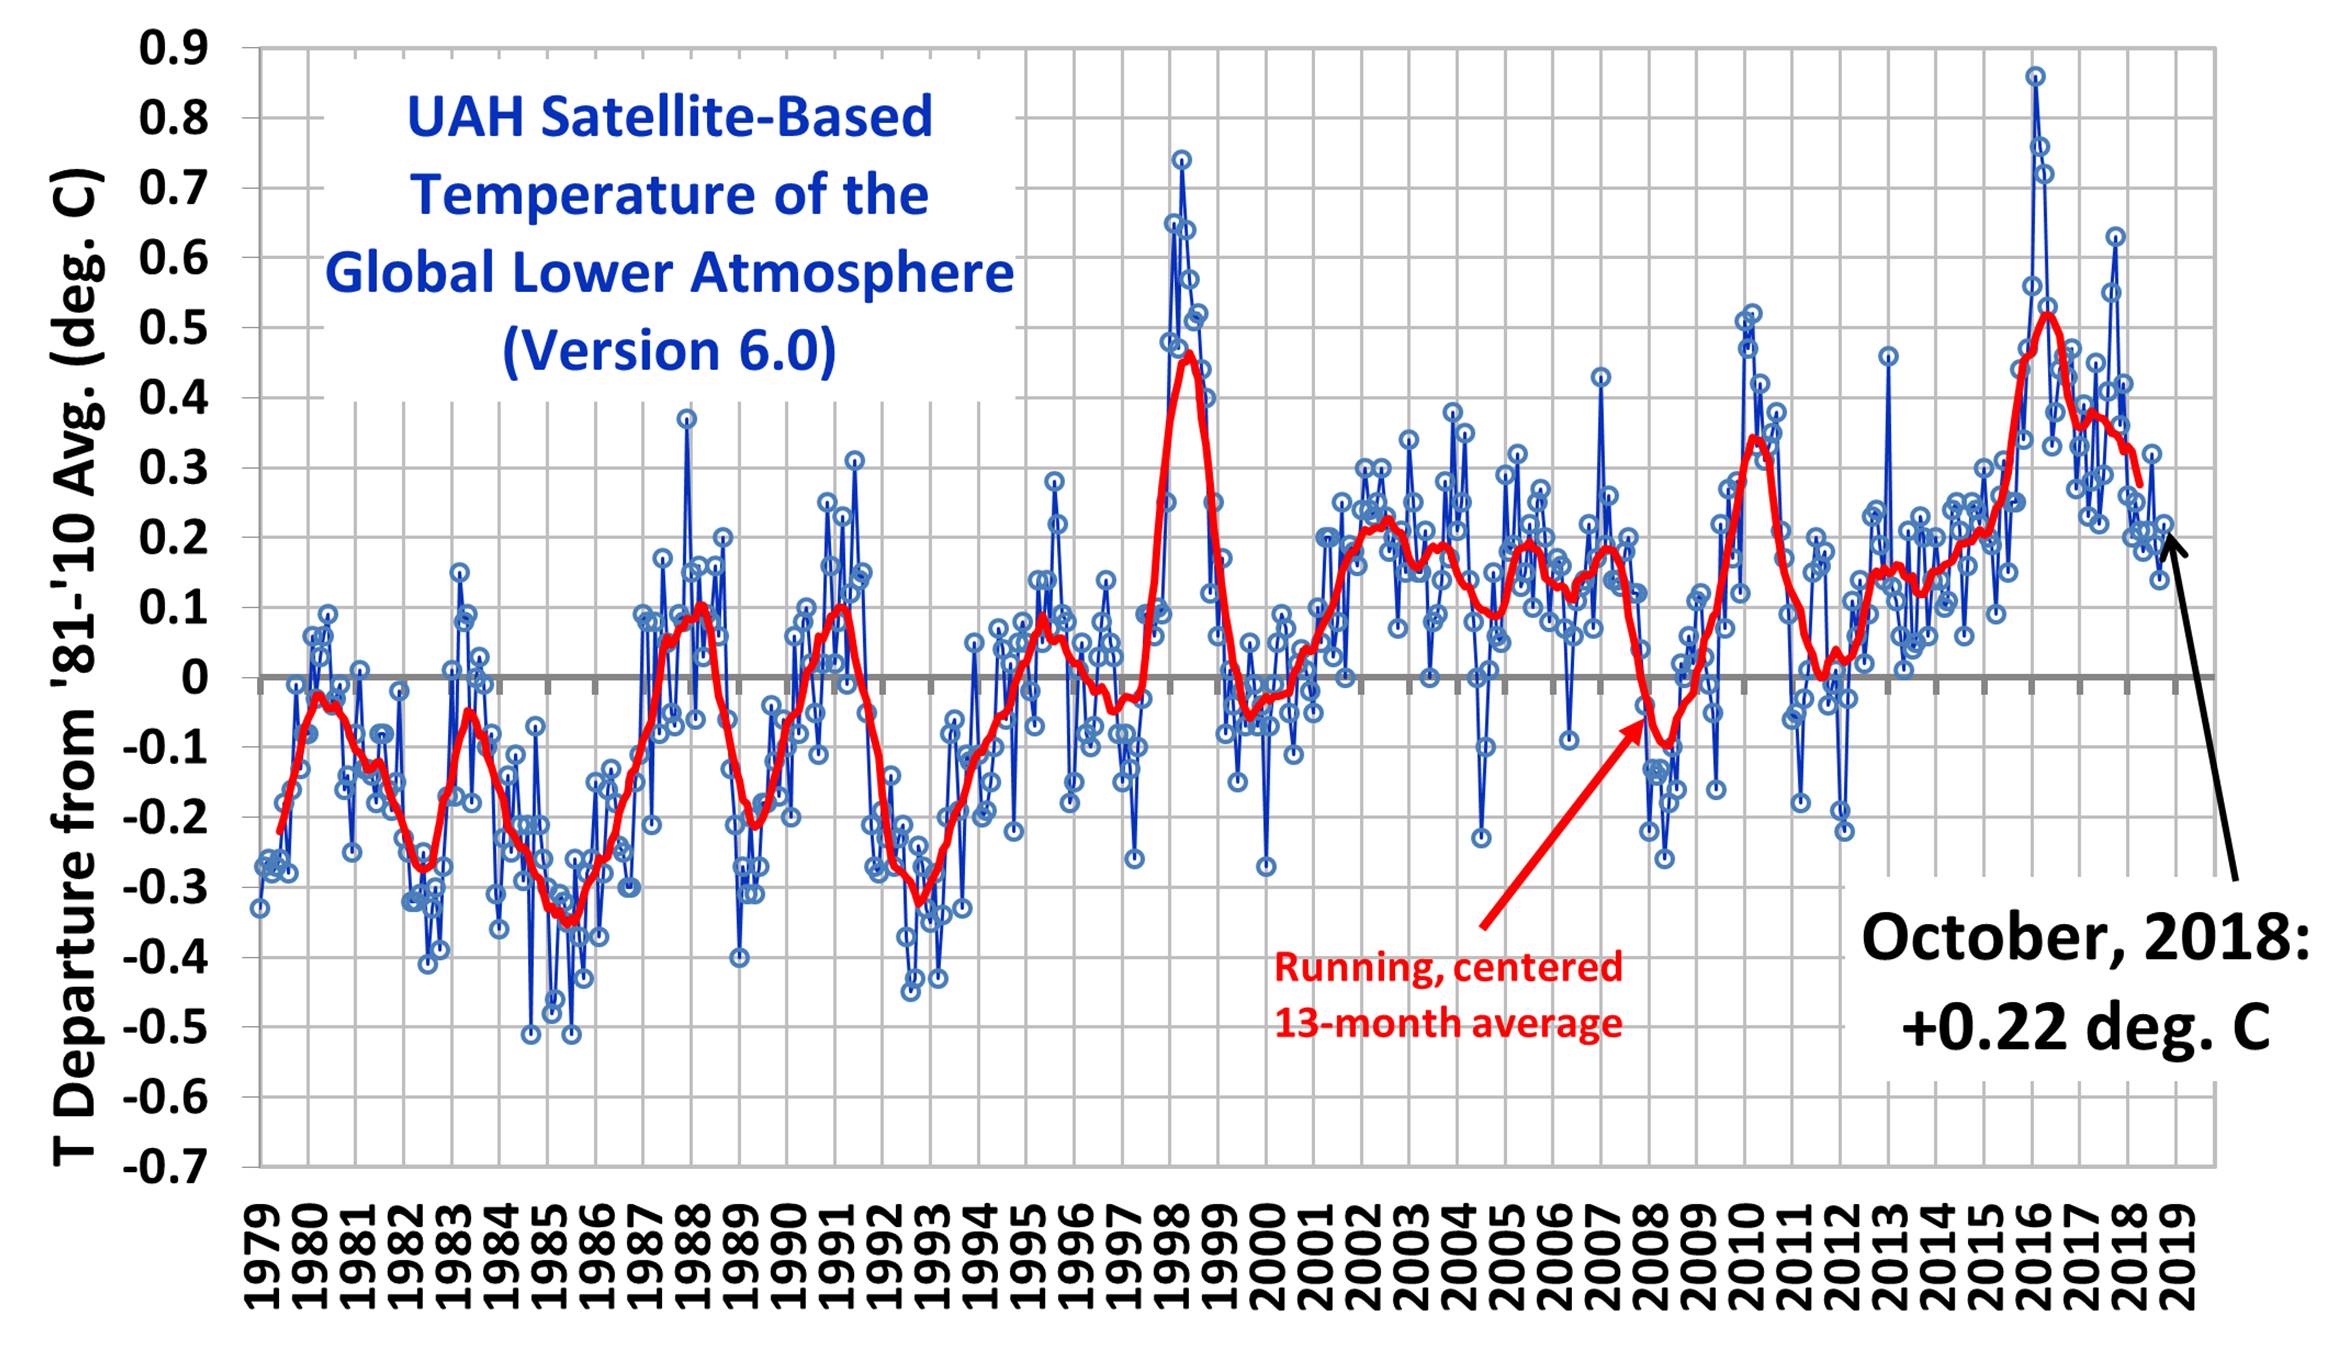
A recent paper published in what is arguably the world’s most prestigious science journal, Nature, claimed that the oceans have been warming considerably faster than estimates made from actual thermometer measurements, which remain rather sparse even in the Argo float era.

Enter Nic Lewis, who along with Judith Curry has been publishing some of the most thorough estimates of climate sensitivity based upon the observational data and the usual assumed anthropogenic climate forcings (mostly increasing CO2). Despite not being a credentialed climate scientist, Mr. Lewis immediately identified a significant error in the paper, substantially altering the conclusions, which the authors now acknowledge.

The good news is that this is a case where the error was caught, and admitted to.

The bad news is that the peer review process, presumably involving credentialed climate scientists, should have caught the error before publication.

UAH Global Temperature Update for October, 2018: +0.22 deg. C

Friday, November 2nd, 2018

The Version 6.0 global average lower tropospheric temperature (LT) anomaly for October, 2018 was +0.22 deg. C, up a little from +0.14 deg. C in September:

Global area-averaged lower tropospheric temperature anomalies (departures from 30-year calendar monthly means, 1981-2010). The 13-month centered average is meant to give an indication of the lower frequency variations in the data; the choice of 13 months is somewhat arbitrary… an odd number of months allows centered plotting on months with no time lag between the two plotted time series. The inclusion of two of the same calendar months on the ends of the 13 month averaging period causes no issues with interpretation because the seasonal temperature cycle has been removed, and so has the distinction between calendar months.

Various regional LT departures from the 30-year (1981-2010) average for the last 22 months are:

YEAR MO GLOBE NHEM. SHEM. TROPIC USA48 ARCTIC AUST
2017 01 +0.33 +0.32 +0.34 +0.10 +0.28 +0.95 +1.22
2017 02 +0.39 +0.58 +0.20 +0.08 +2.16 +1.33 +0.21
2017 03 +0.23 +0.37 +0.09 +0.06 +1.22 +1.24 +0.98
2017 04 +0.28 +0.29 +0.26 +0.22 +0.90 +0.23 +0.40
2017 05 +0.45 +0.40 +0.49 +0.41 +0.11 +0.21 +0.06
2017 06 +0.22 +0.34 +0.10 +0.40 +0.51 +0.10 +0.34
2017 07 +0.29 +0.31 +0.28 +0.51 +0.61 -0.27 +1.03
2017 08 +0.41 +0.41 +0.42 +0.47 -0.54 +0.49 +0.78
2017 09 +0.55 +0.52 +0.57 +0.54 +0.30 +1.06 +0.60
2017 10 +0.63 +0.67 +0.60 +0.47 +1.22 +0.83 +0.86
2017 11 +0.36 +0.34 +0.38 +0.27 +1.36 +0.68 -0.12
2017 12 +0.42 +0.50 +0.33 +0.26 +0.45 +1.37 +0.36
2018 01 +0.26 +0.46 +0.06 -0.11 +0.59 +1.36 +0.42
2018 02 +0.20 +0.25 +0.16 +0.03 +0.92 +1.19 +0.18
2018 03 +0.25 +0.40 +0.10 +0.07 -0.32 -0.33 +0.59
2018 04 +0.21 +0.31 +0.11 -0.12 -0.00 +1.02 +0.69
2018 05 +0.18 +0.41 -0.05 +0.03 +1.93 +0.18 -0.39
2018 06 +0.21 +0.38 +0.04 +0.12 +1.19 +0.83 -0.55
2018 07 +0.32 +0.43 +0.21 +0.29 +0.51 +0.30 +1.37
2018 08 +0.19 +0.22 +0.17 +0.12 +0.06 +0.09 +0.26
2018 09 +0.14 +0.15 +0.14 +0.24 +0.88 +0.21 +0.19
2018 10 +0.22 +0.31 +0.12 +0.34 +0.25 +1.11 +0.38

The linear temperature trend of the global average lower tropospheric temperature anomalies from January 1979 through October 2018 remains at +0.13 C/decade.

The UAH LT global anomaly image for October, 2018 should be available in the next few days here.

The new Version 6 files should also be updated at that time, and are located here:

Lower Troposphere: http://vortex.nsstc.uah.edu/data/msu/v6.0/tlt/uahncdc_lt_6.0.txt
Mid-Troposphere: http://vortex.nsstc.uah.edu/data/msu/v6.0/tmt/uahncdc_mt_6.0.txt
Tropopause: http://vortex.nsstc.uah.edu/data/msu/v6.0/ttp/uahncdc_tp_6.0.txt
Lower Stratosphere: http://vortex.nsstc.uah.edu/data/msu/v6.0/tls/uahncdc_ls_6.0.txt