Archive for June, 2018

Antarctic Ice Sheet Collapses, Nobel Prizes, and the Psychology of Catastrophism

Sunday, June 17th, 2018

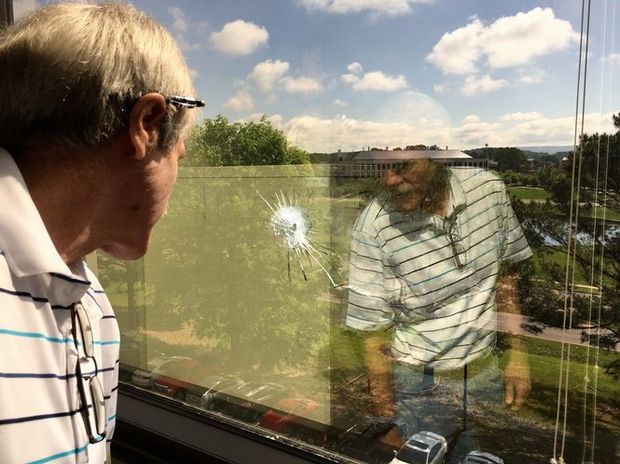
John Christy examines one of the seven bullet holes in our NSSTC building, fired on the weekend of the 2017 March for Science.

Last week I had the privilege of being invited to present a talk at a small conference of world experts in a variety of disciplines. The venue was spectacular, on the French Riviera, and we had an entire late-1800s hotel to ourselves, right on the Mediterranean. For me, it was a once-in-a-lifetime experience. I had the feeling that the organizers wanted the event to have a low profile, and so I won’t mention names.

I had about 12 minutes to lay out the case for climate skepticism. My talk was generally well-received and led to many follow-up discussions over the following days.

One of the attendees was an elderly particle physicist who was also a Nobel Prize winner. During Q&A, he mentioned how he had been teaching a climate class at his university for several years, and that he thought my skepticism was unwarranted. He was convinced that the Antarctic ice sheet was headed for collapse and we would have to deal with a 30 m rise in sea level as a result.

What was more than a little disturbing was that he openly declared that climate policy would not be able to move forward like it needs to until old skeptics like me die out. Part of my talk was about the fact that credentialed and published skeptical climate researchers are indeed slowly dying out, with an average age of around 70 now, and that governmental bias in climate funding will basically kill off skeptical research if things don’t change.

I approached him afterward and politely said I didn’t think either one of us was going to change our minds, and hoped we could just enjoy the nice dinner that was planned for us. He politely smiled and agreed to that.

I guess what was interesting to me is that the “belief” (his word) in catastrophic climate change, like religion, exists at all education levels. One also can’t help but notice how Nobel Prize winners tend to also be experts in all disciplines after they win their prize. Stephen Hawking comes to mind.

The whole experience was quite fascinating.

UPDATE: It has been pointed out to me that Hawking never received a Nobel Prize. The fact is that I can’t account for the lack of Hawking’s Nobel Prize at the moment, and it is a travesty that I can’t.

UAH Global Temperature Update for May, 2018: +0.18 deg. C

Friday, June 1st, 2018

The Version 6.0 global average lower tropospheric temperature (LT) anomaly for May, 2018 was +0.18 deg. C, down a little from the April value of +0.21 deg. C:

Global area-averaged lower tropospheric temperature anomalies (departures from 30-year calendar monthly means, 1981-2010). The 13-month centered average is meant to give an indication of the lower frequency variations in the data; the choice of 13 months is somewhat arbitrary… an odd number of months allows centered plotting on months with no time lag between the two plotted time series. The inclusion of two of the same calendar months on the ends of the 13 month averaging period causes no issues with interpretation because the seasonal temperature cycle has been removed, and so has the distinction between calendar months.

Some regional LT departures from the 30-year (1981-2010) average for the last 17 months are:

YEAR MO GLOBE NHEM. SHEM. TROPIC USA48 ARCTIC AUST
2017 01 +0.33 +0.31 +0.34 +0.10 +0.27 +0.95 +1.22
2017 02 +0.38 +0.57 +0.20 +0.08 +2.16 +1.33 +0.21
2017 03 +0.23 +0.36 +0.09 +0.06 +1.21 +1.24 +0.98
2017 04 +0.27 +0.29 +0.26 +0.21 +0.89 +0.22 +0.40
2017 05 +0.44 +0.39 +0.49 +0.41 +0.10 +0.21 +0.06
2017 06 +0.22 +0.33 +0.10 +0.39 +0.50 +0.10 +0.34
2017 07 +0.29 +0.30 +0.27 +0.51 +0.60 -0.27 +1.03
2017 08 +0.41 +0.40 +0.42 +0.46 -0.55 +0.49 +0.77
2017 09 +0.54 +0.51 +0.57 +0.54 +0.29 +1.06 +0.60
2017 10 +0.63 +0.67 +0.59 +0.47 +1.21 +0.83 +0.86
2017 11 +0.36 +0.33 +0.38 +0.27 +1.35 +0.68 -0.12
2017 12 +0.41 +0.50 +0.33 +0.26 +0.44 +1.37 +0.36
2018 01 +0.26 +0.46 +0.06 -0.11 +0.58 +1.36 +0.42
2018 02 +0.20 +0.24 +0.16 +0.03 +0.92 +1.19 +0.18
2018 03 +0.25 +0.40 +0.10 +0.06 -0.32 -0.33 +0.59
2018 04 +0.21 +0.31 +0.10 -0.13 -0.01 +1.02 +0.68
2018 05 +0.18 +0.40 -0.05 +0.03 +1.93 +0.18 -0.40

The linear temperature trend of the global average lower tropospheric temperature anomalies from January 1979 through May 2018 remains at +0.13 C/decade.

The UAH LT global anomaly image for May, 2018 should be available in the next few days here.

The new Version 6 files should also be updated in the coming days, and are located here:

Lower Troposphere: http://vortex.nsstc.uah.edu/data/msu/v6.0/tlt/uahncdc_lt_6.0.txt
Mid-Troposphere: http://vortex.nsstc.uah.edu/data/msu/v6.0/tmt/uahncdc_mt_6.0.txt
Tropopause: http://vortex.nsstc.uah.edu/data/msu/v6.0/ttp/uahncdc_tp_6.0.txt
Lower Stratosphere: http://vortex.nsstc.uah.edu/data/msu/v6.0/tls/uahncdc_ls_6.0.txt