Archive for September, 2017

The 11-Year Major Hurricane Drought: Much More Unusual than Two Cat 4 Strikes

Thursday, September 21st, 2017

Weather.com published an article noting that the two Cat 4 hurricane strikes this year (Harvey and Irma) is a new record. Here’s a nice graphic they used showing both storms at landfall.

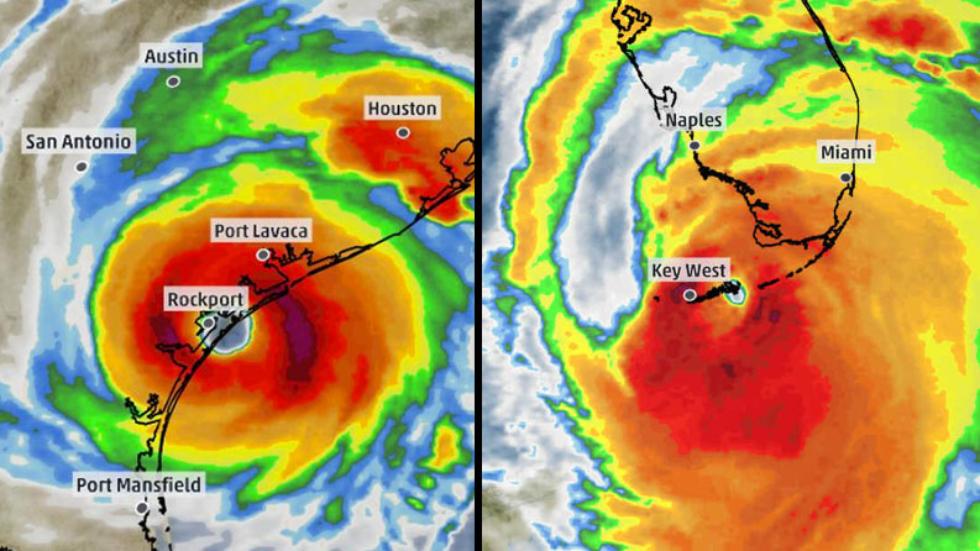
Left: Hurricane Harvey makes landfall near Rockport, Texas, on Aug. 25, 2017 | Right: Hurricane Irma makes its first landfall at Cudjoe Key, Florida, on Sept. 10, 2017 (graphic: Weather.com).

But the statistics of rare events (like hurricanes) are not very well behaved. Let’s look at this new record, and compared it to the 11+year period of no major hurricane strikes that ended when Harvey struck Texas.

The Probability of Two Cat 4 Strikes in One Year

By my count, we have had 24 Cat 4 or Cat 5 landfalls in the U.S. between 1851 and 2016. This gives a probability (prior to Harvey and Irma) of one Cat4+ strike every 7 years. It also leads to an average return period of two Cat4+ strikes of about 50 years (maybe one of you statiticians out there can correct me if I’m wrong).

So, since the average return period is once every 50 years, we were overdue for two Cat4+ strikes in the same year over the entire 166 period of record. (Again, for rare events, the statistics aren’t very well behaved.)

The Probability of the 11-Year “Drought” in Major Landfalling Hurricane

In 2015, a NASA study was published which calculated how unlikely the (then) 9-year stretch with no major hurricane landfalls was. They came up with a 177 year return period for such an event.

I used that statistic to estimate what eventually happened, which was 11 years with no major hurricane strikes.

I get a return period of 560 years!

Now, which seems more unusual and potentially due to climate change: something that should happen only once every 50 years, or every 560 years?

Maybe global warming causes fewer landfalling major hurricanes.

Cracks in the Empire’s Armor Appear

Wednesday, September 20th, 2017

Yesterday brought widespread news coverage of a new “study” published in Nature Geoscience which concludes that global warming has not been progressing as fast as expected, and that climate models might be a “little bit” wrong.

(That the “little bit” is a factor of 2 or 3 is a fine point upon which we won’t quibble here.)

I’m still trying to process my feelings about how the two authors, Myles Allen and Michael Grubb, might have been allowed to wander so far off the Empire’s (UN IPCC’s) reservation.

My initial reaction to the news was captured by my wife:

I’ve been thinking about what led to this turn of events. I’ve decided it was not some random realization by rogue elements of the Empire. It was not a tactical anomaly, but instead a strategic trial balloon of sorts.

Had John Christy or I tried to publish such a paper, Storm Troopers led by Darth Trenberth would have been quickly dispatched to put down the rebellion.

The realization by the authors that the climate models have produced too much warming since about 2000 has been out there for at least 5 years. It has been no secret, and Christy and I have been lambasted as “deniers” for repeatedly pointing it out.

The timing of the authors’ realization of the same seems not very believable. Quoting from the Independent article,

According to The Times, another of the papers authors, Michael Grubb, a professor of international energy and climate change at University College London, admitted his earlier forecasting models had overplayed how temperatures would rise. At the Paris climate summit in 2015, Professor Grubb said: “All the evidence from the past 15 years leads me to conclude that actually delivering 1.5C is simply incompatible with democracy.” But speaking to The Times he said: “When the facts change, I change my mind, as [John Maynard] Keynes said.”

Now, I must ask, what did Grubb know, and when did he know it? What exactly has changed in the model forecasts since the Paris summit in December 2015?

Exactly nothing.

Allen and Grubb knew the models had a problem well before that.

I suspect there have been years of discussions in e-cigarette vapor-filled back rooms where Empire leaders have been discussing how the increasing disparity between models and observations should be handled. The resulting new paper is part of a grand scheme that Population Bomb author Paul Ehrlich perfected decades ago. I believe the new narrative taking shape is this: “yes, we were wrong, but only in the timing of the coming global warming disaster. It is still going to happen… but now we have time to fix it, before it really, really is too late.”

I wonder if Allen and Grubb will also be called “deniers” for pointing out that the emperor’s models have no clothes?

Only time will tell. For now, all I can say is, welcome to the dark side.

Since it is card-carrying members of the climate establishment saying the models are wrong, though, they will probably be hailed as visionaries.

Inevitable Disaster: Why Hurricanes Can’t Be Blamed On Global Warming

Monday, September 18th, 2017

Partly in response to the crazy claims of the usual global warming experts (Stevie Wonder, Beyoncé, Jennifer Lawrence, Mark Ruffalo, Bill Nye the Science Guy, Neil deGrasse Tyson, Pope Francis), I decided to write another Kindle e-book. This one is entitled, Inevitable Disaster: Why Hurricanes Can’t Be Blamed On Global Warming.

In it I review the many fascinating examples of major hurricane landfalls in the United States, even going back to colonial times.

For example, two major hurricane strikes endured by the Massachusetts Bay Colony, in 1635 and in 1675, have yet to be rivaled in more modern times. Major hurricane Maria, now approaching Dominica and Guadeloupe, is probably no match for the Great Hurricane of 1780 in the Caribbean, which had estimated winds of 200 mph and killed 20,000 people.

I also address the reasons why Hurricane Harvey and its flooding cannot be blamed on climate change. Regarding Hurricane Irma which recently terrorized Florida, you might be surprised to learn that it is consistent with a downward trend in both the number and intensity of landfalling major Florida hurricanes:

But what has changed is the number of people and amount of infrastructure at risk along the Altantic and Gulf of Mexico coastlines. Before 1900, there were virtually no people residing in Florida. Now its population exceeds 20 million. Miami was incorporated in 1896…with only 300 people. Even if there is no long term change in hurricane activity, hurricane damage will increase as coastal development increases.

I review the science of why major hurricanes in the tropical Atlantic, Caribbean, and Gulf of Mexcico are not limited by sea surface temperatures, which are warm enough every hurricane season to support catastrophic hurricanes.

Even the IPCC has low confidence in whether hurricanes will become more frequent or more severe in the coming decades. NOAA’s GFDL says we might see 2% to 11% increase in activity by the end of the century. Does that sound like what you should be worrying about during hurricane season if you live on the Florida coast? Maybe instead you should worry that you chose to live somewhere that will, inevitably, be hit by a hurricane sent by Mother Nature that will be catastrophic with or without the help of humanity’s greenhouse gas emissions.

The book is an easy read, with fewer than 11,000 words, and 17 illustrations.

UAH Global Temperature Update for August, 2017: +0.41 deg. C

Tuesday, September 5th, 2017

The Version 6.0 global average lower tropospheric temperature (LT) anomaly for August, 2017 was +0.41 deg. C, up somewhat from the July, 2017 value of +0.29 deg. C (click for full size version):

Global area-averaged lower tropospheric temperature anomalies (departures from 30-year calendar monthly means, 1981-2010). The 13-month centered average is meant to give an indication of the lower frequency variations in the data; the choice of 13 months is somewhat arbitrary… an odd number of months allows centered plotting on months with no time lag between the two plotted time series. The inclusion of two of the same calendar months on the ends of the 13 month averaging period causes no issues with interpretation because the seasonal temperature cycle has been removed as has the distinction between calendar months.

The global, hemispheric, and tropical LT anomalies from the 30-year (1981-2010) average for the last 20 months are:

YEAR MO GLOBE NHEM. SHEM. TROPICS
2016 01 +0.55 +0.72 +0.38 +0.85
2016 02 +0.85 +1.18 +0.53 +1.00
2016 03 +0.76 +0.98 +0.54 +1.10
2016 04 +0.72 +0.85 +0.58 +0.93
2016 05 +0.53 +0.61 +0.44 +0.70
2016 06 +0.33 +0.48 +0.17 +0.37
2016 07 +0.37 +0.44 +0.30 +0.47
2016 08 +0.43 +0.54 +0.32 +0.49
2016 09 +0.45 +0.51 +0.39 +0.37
2016 10 +0.42 +0.43 +0.42 +0.47
2016 11 +0.46 +0.43 +0.49 +0.38
2016 12 +0.26 +0.26 +0.27 +0.24
2017 01 +0.32 +0.31 +0.34 +0.10
2017 02 +0.38 +0.57 +0.19 +0.07
2017 03 +0.22 +0.36 +0.09 +0.05
2017 04 +0.27 +0.28 +0.26 +0.21
2017 05 +0.44 +0.39 +0.49 +0.41
2017 06 +0.21 +0.33 +0.10 +0.39
2017 07 +0.29 +0.30 +0.27 +0.51
2017 08 +0.41 +0.40 +0.41 +0.46

The linear temperature trend of the global average lower tropospheric temperature anomalies from January 1979 through August 2017 remains at +0.13 C/decade.

NOTE: In June 2017 we added the Metop-B satellite to the processing stream, with data since mid-2013. The Metop-B satellite has its orbit actively maintained, so the AMSU data from it does not require corrections from orbit decay or diurnal drift. As a result of adding this satellite, most of the monthly anomalies since mid-2013 have changed, by typically a few hundredths of a degree C.

The UAH LT global anomaly image for August, 2017 should be available in the next few days here.

The new Version 6 files should also be updated in the coming days, and are located here:

Lower Troposphere: http://vortex.nsstc.uah.edu/data/msu/v6.0/tlt/uahncdc_lt_6.0.txt
Mid-Troposphere: http://vortex.nsstc.uah.edu/data/msu/v6.0/tmt/uahncdc_mt_6.0.txt
Tropopause: http://vortex.nsstc.uah.edu/data/msu/v6.0/ttp/uahncdc_tp_6.0.txt
Lower Stratosphere: http://vortex.nsstc.uah.edu/data/msu/v6.0/tls/uahncdc_ls_6.0.txt