Archive for June, 2024

Global CO2 Emissions are Tracking Well Below the Climate Scenarios Used to Scare People

Sunday, June 30th, 2024

One of the main complaints rational people have had about global warming projections is that the “baseline” scenarios assumed for future CO2 emissions are well above what is realistic. As Roger Pielke, Jr, has been pointing out for years, the U.N. IPCC continues to make these exaggerated scenarios a high priority, and it looks like the next IPCC Assessment Report (AR7) will continue that tradition.

While Roger doesn’t believe there are nefarious motives in this strategy, I do: The IPCC knows very well that as long as climate models are run that produce extreme amounts of climate change, few people will question the assumptions that went into those model projections. Peoples’ careers now depend upon the continuing fear of a “climate crisis” (which has yet to materialize).

But I haven’t been able to find a good, recent graph showing how actual global CO2 emissions compare to those scenarios. So I made one. In the following plot I show estimates of global CO2 emissions from fossil fuel use through 2023, and EIA projections every 5 years from 2025 through 2050 (green). Also shown are the latest (AR6) SSP scenarios that come closest to the AR5 RCP scenarios. (In order to get the SSP scenarios to line up pretty well with the actual emissions in the early years I had to subtract the SSP land use CO2 emissions from the SSP total CO2 emissions values).

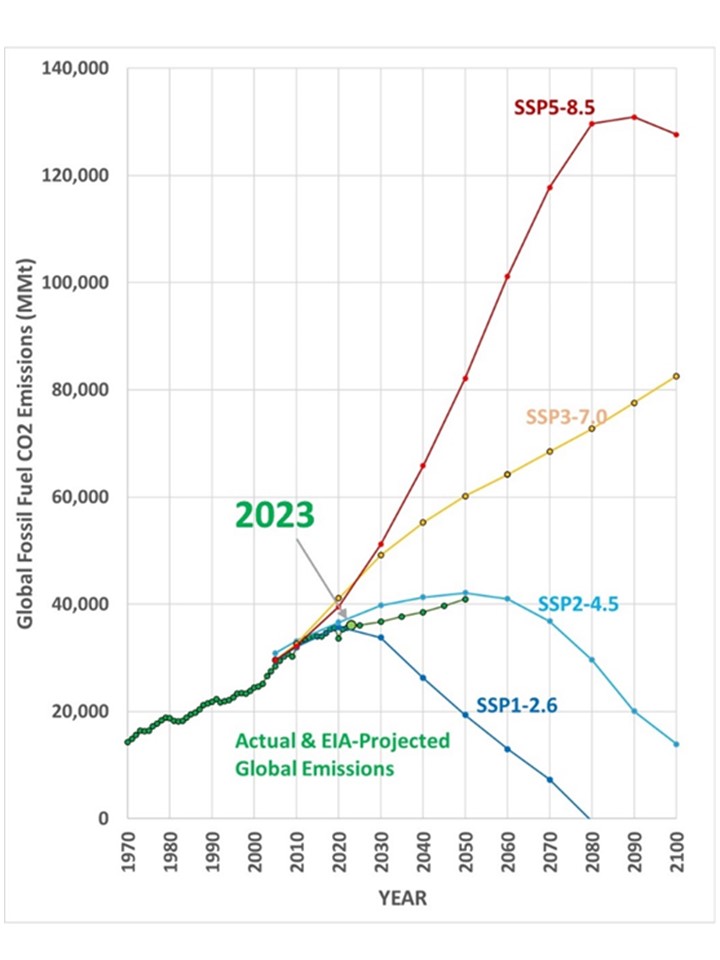
While an emissions scenario like SSP5-8.5 has been widely used to scare humanity with climate model projections of extreme warming, this plot shows the last several years of global emissions (through 2023) suggest the future will look nothing like that scenario.

(And, it should come as no surprise that “Net Zero” emissions by 2050 is a delusion.)

I encourage everyone to subscribe to Pielke’s The Honest Broker substack, where he discusses this and related issues in great detail.

UAH Upper Tropospheric Temperatures Corroborate LT Temperature Trends

Friday, June 7th, 2024

The recent record-setting UAH satellite-based temperatures of the lower troposphere can be compared to a different combination of satellite MSU/AMSU channels which help to corroborate the temperature trends from our “lower tropospheric” (LT) combination of channels.

The three channels we use for LT are MSU channels 2 (“MT”), 3 (“TP”), and 4 (“LS”), (AMSU channels 5, 7, and 9). The primary channel used comes from “MT” (MSU channel 2 or AMSU channel 5), which has the largest weight:

LT = 1.538*MT – 0.548*TP + 0.01*LS

Here is a figure from our 2017 paper on Version 6 of our dataset, showing the three main temperature sounding channels and how they are combined for the LT product:

But we have also experimented with a weighted average of MSU channels 3 (“TP”) and 4 (“LS”), (AMSU channels 7 and 9), which produces an averaging kernel in the upper troposphere (nearly insensitive to stratospheric cooling in the tropics, but somewhat sensitive to stratospheric cooling in the extra-tropics where the tropopause [the boundary between troposphere and stratosphere] is lower). This provides an independent check on our LT synthesized channel, keeping in mind one is centered in the lower troposphere and the other is centered in the upper troposphere.

We noticed that last month (May, 2024) produced a record warm global average temperature in the tropopause channel (AMSU channel 7), so I decided to investigate. Combining channel 7 and 9 for an Upper Troposphere (UT) synthesized channel,

UT = 1.35*TP – 0.35*LS

The resulting vertical profile of weight in the atmosphere is the purple curve, below:

That UT synthesized channel produces the following temperature anomalies:

Note that for the global average, the synthesized UT channel reached record warm values in February, then March, then April, and then May, 2024.

In the tropics, March and then May produced records, but not by much… the 1997/98 El Nino produced upper tropospheric warmth nearly as strong as our recent El Nino.

If we look at just the extra-tropics (next chart) we see the northern latitudes had record warmth in March. But the southern latitudes May came in only 3rd warmest, behind September 2019, and November, 1988.

Note also that the global UT trend is the same as the lower tropospheric (LT) trend, +0.13 C/decade. Since the global UT has some small contamination from lower stratospheric cooling, the “true” UT value (if the stratospheric influence could be removed) would be somewhat warmer. By how much? I’m not sure… maybe +0.15 rather than +0.13 C/decade as an educated guess.

Taken together, I believe this shows that our traditional LT (lower tropospheric) temperature trends are basically corroborated by the other channels of MSU/AMSU.

Keep in mind that when John Christy and I compare these various trends to climate models, it is always apples-to-apples: the climate models’ atmospheric pressure level data are combined and weighted to approximate the same weighting functions as the satellite senses.

UAH Global Temperature Update for May, 2024: +0.90 deg. C

Tuesday, June 4th, 2024

The Version 6 global average lower tropospheric temperature (LT) anomaly for May, 2024 was +0.90 deg. C departure from the 1991-2020 mean, down from the record-high April, 2024 anomaly of +1.05 deg. C.

The linear warming trend since January, 1979 remains at +0.15 C/decade (+0.13 C/decade over the global-averaged oceans, and +0.20 C/decade over global-averaged land).

The following table lists various regional LT departures from the 30-year (1991-2020) average for the last 17 months (record highs are in red):

YEARMOGLOBENHEM.SHEM.TROPICUSA48ARCTICAUST
2023Jan-0.04+0.05-0.13-0.38+0.12-0.12-0.50
2023Feb+0.09+0.17+0.00-0.10+0.68-0.24-0.11
2023Mar+0.20+0.24+0.17-0.13-1.43+0.17+0.40
2023Apr+0.18+0.11+0.26-0.03-0.37+0.53+0.21
2023May+0.37+0.30+0.44+0.40+0.57+0.66-0.09
2023June+0.38+0.47+0.29+0.55-0.35+0.45+0.07
2023July+0.64+0.73+0.56+0.88+0.53+0.91+1.44
2023Aug+0.70+0.88+0.51+0.86+0.94+1.54+1.25
2023Sep+0.90+0.94+0.86+0.93+0.40+1.13+1.17
2023Oct+0.93+1.02+0.83+1.00+0.99+0.92+0.63
2023Nov+0.91+1.01+0.82+1.03+0.65+1.16+0.42
2023Dec+0.83+0.93+0.73+1.08+1.26+0.26+0.85
2024Jan+0.86+1.06+0.66+1.27-0.05+0.40+1.18
2024Feb+0.93+1.03+0.83+1.24+1.36+0.88+1.07
2024Mar+0.95+1.02+0.88+1.35+0.23+1.10+1.29
2024Apr+1.05+1.25+0.85+1.26+1.02+0.98+0.48
2024May+0.90+0.97+0.83+1.31+0.37+0.38+0.45

The full UAH Global Temperature Report, along with the LT global gridpoint anomaly image for May, 2024, and a more detailed analysis by John Christy, should be available within the next several days here.

The monthly anomalies for various regions for the four deep layers we monitor from satellites will be available in the next several days:

Lower Troposphere:

http://vortex.nsstc.uah.edu/data/msu/v6.0/tlt/uahncdc_lt_6.0.txt

Mid-Troposphere:

http://vortex.nsstc.uah.edu/data/msu/v6.0/tmt/uahncdc_mt_6.0.txt

Tropopause:

http://vortex.nsstc.uah.edu/data/msu/v6.0/ttp/uahncdc_tp_6.0.txt

Lower Stratosphere:

http://vortex.nsstc.uah.edu/data/msu/v6.0/tls/uahncdc_ls_6.0.txt