Archive for May, 2013

On the Lighter Side: HAARP Tornado Vortex Clouds Attack!

Friday, May 17th, 2013

I get scattered e-mails from a lot of people, but I get routine updates from someone named “Ol’fisherman” on the sinister weather modifying effects of the HAARP facility in Alaska. The Wikipedia page describing the research facility even has a section on Conspiracy Theories.

Now, if you go to Google images and search on “lenticular clouds” you will find MANY photos similar to this one, which Ol’fisherman sent to me:
lenticular-clouds
Here is the description he provided of this photo (I am not making this up):

These are HAARP generated Vortex Clouds. The exact type formation as seen in NORWAY HE LASER photos. The Energy here came down from Stratosphere Bounce from Earthbound HAARP Machine Array in AK. The Particle Physics as seen in Photo say’s the Proton to Neutron Interaction Threshold has not been reached yet at elevations shown. But when the spiral cone gets closer to Earth’s Teller Currents, and it will; the E- GAP is bridged Electrically, and the Record Tornado size and Speeds being reported, are the Result!!

Now let’s see how long it takes for someone to post a comment that I shouldn’t be poking fun, since I’m a believer in the greenhouse effect which is obviously a “conspiracy” of misguided physicists.

A Simple Experiment to Show How Cool Objects Can Keep Warm Objects Warmer Still

Thursday, May 16th, 2013

The standard explanation of the “greenhouse effect” is that it keeps the surface of the Earth warmer than it would otherwise be, through infrared radiation downwelling from the atmosphere. Even though this IR radiation is being emitted at a lower temperature than the surface, it actually keeps the surface warmer. Some people have trouble with this explanation, claiming it violates one or more laws of thermodynamics.

As I have discussed ad nauseum, the temperature of a heated object is always determined by rates of energy gain and energy loss, and that energy loss is almost always a function of the object’s cooler surroundings.

Whether one views the greenhouse effect as extra infrared energy gained by the surface from the cooler atmosphere, or just a reduced rate of infrared energy loss by the surface to the atmosphere and outer space, the effect is the same: a surface temperature increase.

I’ve been toying with a few different ways to demonstrate this effect with a simple experimental setup using household items. Apparently the IR thermal imager, which I showed directly measures the surface temperature effects of varying levels of downwelling IR sky radiation on a microbolometer within the instrument, is not sufficient for some people.

So, I’ve come up with the following simple setup, and if I carry it out, I want predictions from readers here of what will happen to the temperatures of the 2 heated metal plates:
heated-plate-experiment
The two metal plates will be heated in the oven to the same temperature, then placed vertically next to each other, but separated by a sheet of Styrofoam. Obviously, the plates will cool, partly by conduction to the surrounding air. The above cartoon is just a rough approximation of the setup. I will probably have the ends of the heated plates covered by Styrofoam as well, to help reduce conductive heat loss.

But the plates also cool from infrared energy loss. So, I will expose one of the heated plates to a third plate that I will have chilled to at least 0 deg. F in the deep freeze.

Finally, I will expose the other heated plate to a 4th plate just at the ambient air temperature, say 80 deg. F.

Very thin sheets of polypropylene (Saran wrap), which are nearly transparent to IR radiation, will be used to minimize the movement of air currents between the heated plates and their cooler counterparts. All 4 plates will be coated with high emissivity (0.99) Krylon flat white #1502 paint.

My question is this: Will the two hot plates cool at different rates? I predict the heated plate exposed to the ambient (80 deg. F) plate will consistently stay warmer than the other heated plate exposed to the chilled (0 deg. F) plate.

Of course, if one waits long enough, all plates will come to the same temperature, since the hot plates are not actively heated (like the climate system is by the Sun) and the cold plate is not actively chilled (which would partly mimic the infrared energy sink of deep space).

The main point is that cooler objects which surround heated objects affect the heated objects temperature. As far as I can tell, this is a universal truth, with examples all around you. I find it mind boggling that some people do not accept it. (For anyone tempted to say, “But a cooler star doesn’t make a hotter star hotter still”, stay tuned for an experiment Anthony Watts has been working on).

I will monitor the plates’ temperatures with my FLIR i7 thermal imager. Because there is still a small amount of reflection from the heated plates (0.01) the thermal imager must be pointed at an angle which will not pick up reflection from the cooler plates, which would bias the results. Another option would be to buy 2 inexpensive car thermometers with a remote display.

Again, I want to hear some predictions: Will the hot plates cool at different rates? If so, do you see a mechanism other than infrared energy transfer which will explain the different rates of cooling?

If you see pitfalls in the experimental setup, then feel free to point them out and suggest how to mitigate them.

UPDATE: I will be periodically checking in and deleting comments which do not directly address the above experiment and what results it will produce…unfortunately, the comments are already getting sidetracked.

Surface Radiation Budget: Where’s the Proof?

Monday, May 13th, 2013

I’ve had several requests for evidence of the hundreds of watts of downwelling infrared sky radiation. I’ve mentioned that there are many surface radiation budget observation sites around the world (but few in oceanic areas for obvious reasons). I found this presentation summarizing comparisons that Martin Wild and co-investigators have made between these measurements and the latest CMIP5 climate models at the observation sites. It is quite informative, and includes their version of the Kiehl-Trenberth energy budget diagram to fit better to the surface radiative energy budget observations.

For example, here’s a comparison for downward IR flux at the surface between the HadCM3 model and 41 Baseline Surface Radiation Network (BSRN) stations:
BSRN-LW-down-vs-HadCM3
In this case, the model underestimates the downwelling sky radiation by about 9 W/m2. But for something supposedly “non-existent”, there is remarkable agreement between the average model behavior and the observations for this huge (300-400 W/m2) component of the surface energy budget.

What is MOST interesting to me is the existence of multidecadal changes in sunlight (downwelling shortwave) reaching the surface, as some of the sites have such records extending back to the 1930s. For example, changes at Potsdam, Germany look somewhat like how global temperatures have changed:
Potsdam-Germany-SW-down
The authors admit this is behavior not seen in the climate models. I suppose scientists like Trenberth or Dessler would claim these changes are positive cloud feedback in response to surface temperature changes. But the continually neglected possibility is that they have causation reversed: that natural changes in cloud cover have caused the temperature changes, and cloud feedbacks are in reality negative rather than positive.

And this is where I believe we should be spending our research time in the global warming debate. Not arguing over the existence of something (“backradiation”) which is routinely measured at dozens of observation sites around the world.

Time for the Slayers to Put Up or Shut Up

Friday, May 10th, 2013

I have allowed the Sky Dragon Slayers to post hundreds of comments here containing their views of how the climate system works (or maybe I should say how they think it doesn’t work).

As far as I can tell, their central non-traditional view seems to be that the atmosphere does not have so-called “greenhouse gases” that emit thermal infrared radiation downward. A variation on this theme is that even if those gases exist, they emit energy at the same rate they absorb, and so have no net effect on temperature.

I have repeatedly addressed these views and why they are false.

As far as the Slayer’s alternative explanations go, I have addressed why atmospheric pressure cannot explain surface temperature. The atmospheric adiabatic lapse rate describes how temperature *changes* with height for an air parcel displaced vertically, it does not tell you what the temperature, per se, will be.

If it was just a matter of air pressure, why is the stratosphere virtually the same temperature over its entire depth, despite spanning a factor of 100x in pressure, from about ~2 mb to ~200 mb?

For the adiabatic lapse rate to exist in the real atmosphere, there must be “convective instability”, which requires BOTH lower atmospheric heating AND upper atmospheric cooling. But the upper atmosphere cannot cool unless greenhouse gases are present! Without greenhouse gases, the atmosphere would slowly approach an isothermal state through thermal conduction with a temperature close to the surface temperature, and convection would then be impossible.

In other words, without the “greenhouse effect”, there would be no decrease in atmospheric temperature with height, and no convection. The existence of weather thus depends upon the greenhouse effect to destabilize the atmosphere.

Put Up…

The Slayers have had ample opportunity to answer my challenge: take your ideas, put them into an alternative time-dependent model for surface temperature, and run it from any initial state and see if it ends up with a realistic temperature.

Determining the actual temperature at any altitude requires computing rates of energy gain and energy loss. I spent only an hour to provide a simple version of such a model based upon traditional physics, which produces the observed average surface temperature of the Earth. It is the same physics used in many weather prediction models every day, physics which if not included would cause those models forecasts to quickly diverge away from how the real atmosphere behaves on average.

Surely, of the 200 scientists and meteorologists the Slayers claim to have at their disposal, they can produce something similar.

Here’s the equation I used for surface temperature change with time, and it assumes a single atmospheric layer with an average infrared effective emissivity of 0.9, based upon the Kiehl-Trenberth global average energy budget diagram.
simple-model-of-sfc-temp-from-K-T
I also have a version of the model which adds the time rate of change of the bulk atmospheric temperature, too, based upon the Kiehl-Trenberth diagram. These are very simple models…usually in modeling the atmosphere and ocean are divided up into many mutually interacting layers, but I’m trying to keep it simple here.

…or Shut Up

The Slayers have ample opportunity to post comments here outlining their views, often dominating the bandwidth, and those comments will remain for posterity.

But my blog is no longer going to provide them a platform for their unsupported pseudo-scientific claims…they can post their cult science on their own blog. They have taken far too much of my time, which would be better spent thinking about the more obvious shortcomings of global warming theory.

If and when they answer my challenge to provide a quantitative model of surface temperature change, I might change my mind. But they must first provide a time-dependent model like that above which involves energy gain and energy loss terms, which is the only way to compute the temperature of something from theory. Those energy gain and loss terms must be consistent with experimental observations, and (of course) the physical units of the terms must all be consistent.
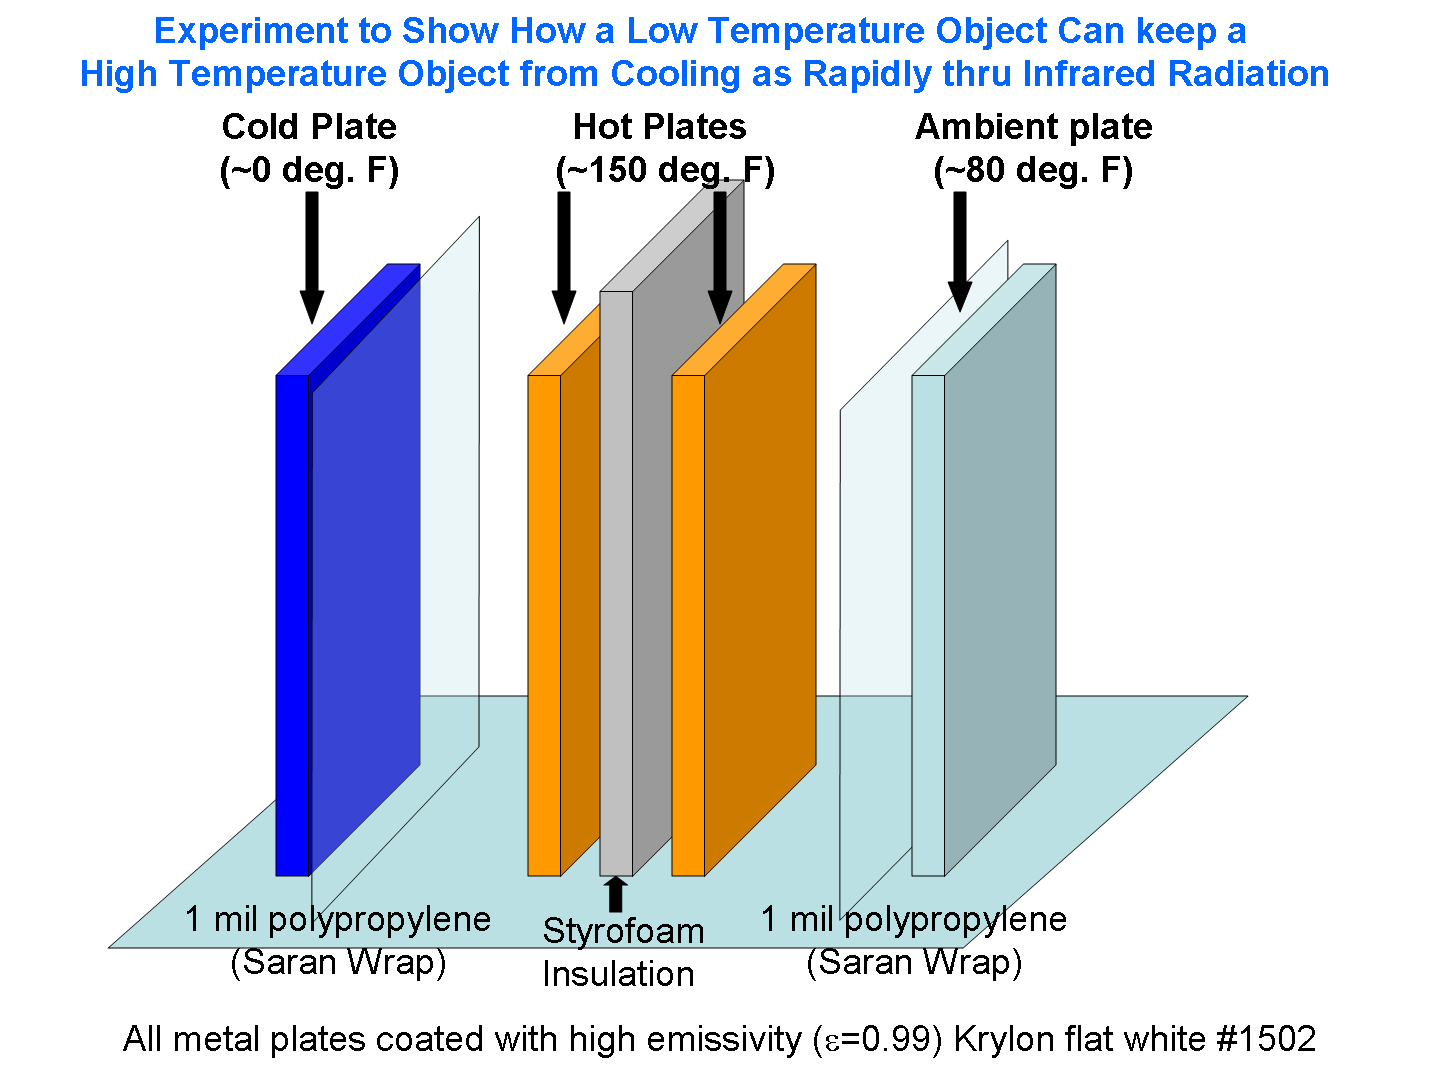
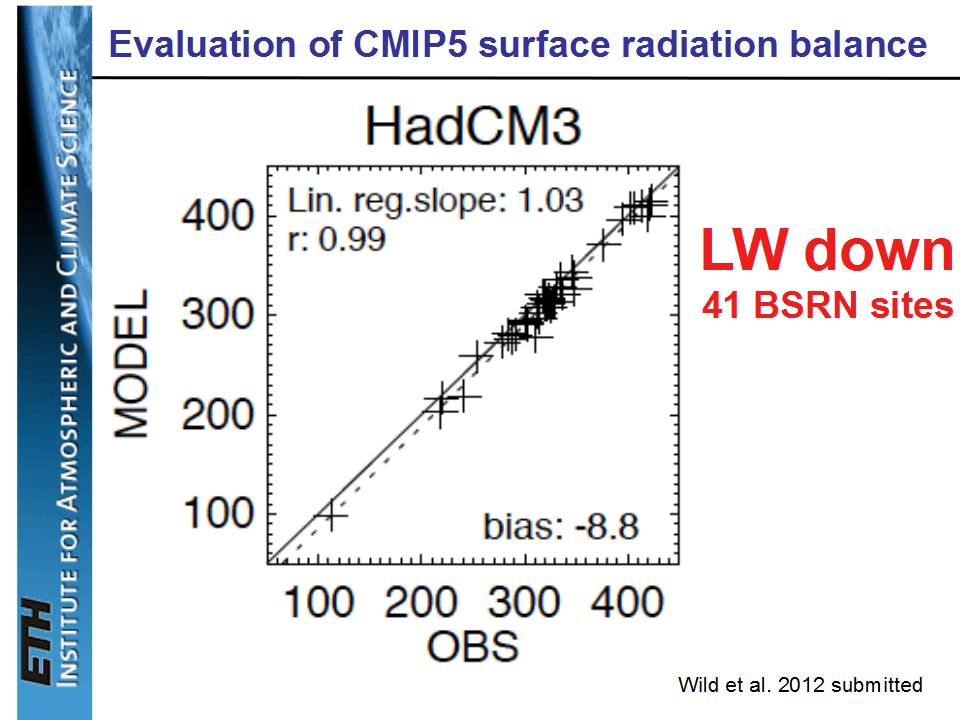
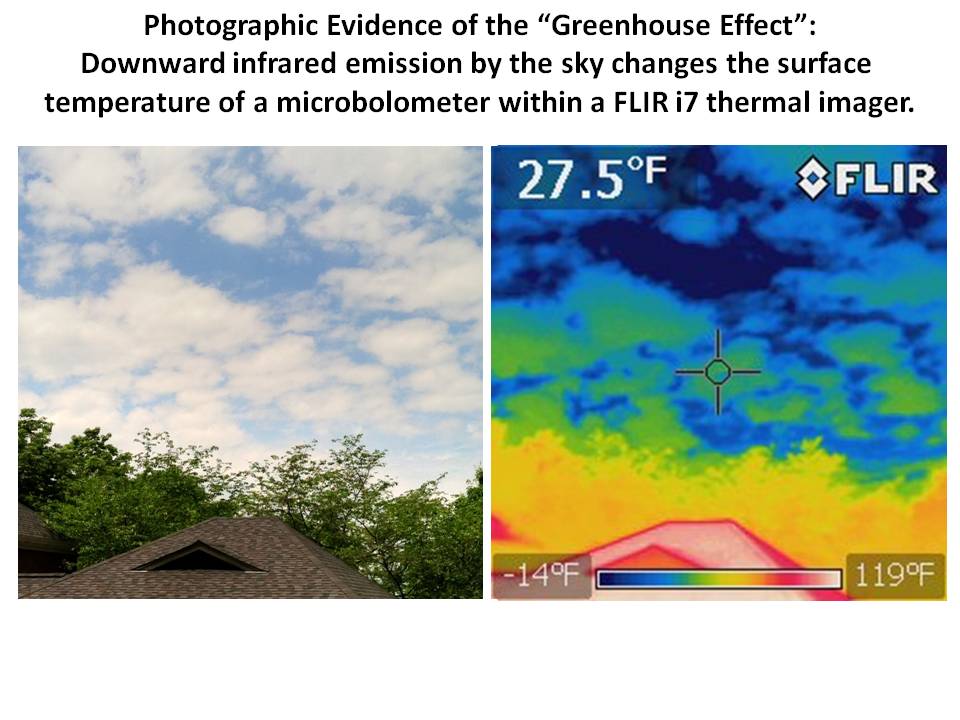
But I don’t see how they can ever do that, because they will ignore the hundreds of watts of downward emitted IR radiation from the sky, an energy flux which is routinely observed with a variety of instrumentation, and explained with well-established theories of radiative transfer and laboratory evidence of the infrared absorption characteristics of various gases.

If anyone challenges me to provide justification for anything I’ve stated above, well, I assume you know how to use Google. There is abundant information out there…go educate yourself.

Global Microwave SST Update for April, 2013: -0.04 deg. C

Tuesday, May 7th, 2013

The satellite-based microwave global average sea surface temperature (SST) update for April 2013 is -0.04 deg. C, relative to the 2003-2006 average (click for large version):
RSS_mwSST_2002_thru_Apr_2013

The anomalies are computed relative to only 2003-2006 because those years were relatively free of El Nino and La Nina activity, which if included would cause temperature anomaly artifacts in other years. Thus, these anomalies cannot be directly compared to, say, the Reynolds anomalies which extend back to the early 1980s. Nevertheless, they should be useful for monitoring signs of recent ocean surface warming, which appears to have stalled since at least the early 2000’s. (For those who also track our lower tropospheric temperature [“LT”] anomalies, these SST anomalies average about 0.20 deg. C cooler than LT since mid-2002).

The SST retrievals come from Remote Sensing Systems (RSS), and are based upon passive microwave observations of the ocean surface from AMSR-E on NASA’s Aqua satellite, the TRMM satellite Microwave Imager (TMI), and WindSat. While TMI has operated continuously through the time period (but only over the tropics and subtropics), AMSR-E stopped nominal operation in October 2011, after which Remote Sensing Systems patched in SST data from WindSat. These various satellite SST datasets have been carefully intercalibrated by RSS.

Despite the relatively short period of record, I consider this dataset to be the most accurate depiction of SST variability over the last 10+ years due to these instruments’ relative insensitivity to contamination by clouds and aerosols at 6.9 GHz and 10.7 GHz.

Imaging the Greenhouse Effect with a FLIR i7 Thermal Imager

Monday, May 6th, 2013

FLIR_clouds_backyard
What is the atmospheric greenhouse effect? It is the warming of the surface and lower atmosphere caused by downward infrared emission by the atmosphere, primarily from water vapor, carbon dioxide, and clouds.

Greenhouse gases and clouds cause the lower atmosphere to be warmer, and the upper atmosphere to be cooler, than if they did not exist…just as thermal insulation in a house causes the inside of a heated house to be warmer and the outside of the house to be cooler than if the insulation was not there. While the greenhouse effect involves energy transfer by infrared radiation, and insulation involves conduction, the thermodynamic principle is the same.

Without greenhouse gases, the atmosphere would be unable to cool itself in response to solar heating. But because an IR emitter is also an IR absorber, a greenhouse atmosphere results in warmer lower layers — and cooler upper layers — than if those greenhouse gases were not present.

As discussed by Lindzen (1990, “Some Coolness Concerning Global Warming”), most of the surface warming from the greenhouse effect is “short-circuited” by evaporation and convective heat transfer to the middle and upper troposphere. Nevertheless, the surface is still warmer than if the greenhouse effect did not exist: the Earth’s surface emits an average of around 390 W/m2 in the thermal infrared even though the Earth absorbs only 240 W/m2 of solar energy.

I have demonstrated before how you can directly measure the greenhouse effect with a handheld IR thermometer pointed at the sky. I say “directly measure” because an IR thermometer pointed at the sky measures the temperature change of a thermistor exposed to varying levels of IR radiation, just as the temperature of the Earth’s surface changes in response to varying levels of downwelling IR radiation.

I recently purchased a FLIR i7 thermal imager, which instead of measuring just one average temperature, uses a microbolometer sensor array (140 x 140 pixels) to make 19,600 temperature readings in an image format. These are amazing little devices, originally developed for military applications such as night vision, and are very sensitive to small temperature differences, around 0.1 deg. C.

Because these handheld devices are meant to measure the temperature of objects, they are tuned to IR frequencies where atmospheric absorption/emission is minimized. The FLIR i7 is sensitive to the broadband IR emission from about 7.5 to 13 microns. While the atmosphere in this spectral region is relatively transparent, it also includes some absorption from water vapor, CO2, oxygen, and ozone. The amount of atmospheric emission will be negligible when viewing objects only a few feet away, but is not negligible when pointed up at miles of atmosphere.

Everything around us has constantly changing temperatures in response to various mechanisms of energy gain and loss, things that are normally invisible to us, and these thermal imagers give us eyes to view this unseen world. I’ve spent a few days getting used to the i7, which has a very intuitive user interface. I’ve already used it to identify various features in the walls of my house; see which of my circuit breakers are carrying heavy loads; find a water leak in my wife’s car interior; and see how rain water flows on my too-flat back patio.

The above pair of images shows how clouds and clear sky appear. While the FLIR i7 is designed to not register temperatures below -40 deg. F/C (and is only calibrated to -4 deg. F) you can see that sky brightness temperatures well above this are measured (click the above image for full-size version).

This is direct evidence of the greenhouse effect: the surface temperature of the microbolometer within the thermal imager is being affected by downwelling IR radiation from the sky and clouds, which is exactly what the greenhouse effect is. If there was no downward emission, the sky temperature as measured by a perfectly designed thermal imager would read close to absolute zero (-460 deg. F), that is, it would measure the cosmic background radiation if the atmosphere was totally transparent to IR radiation.

Just so there is no confusion: I am not talking about why the indicated temperatures are what they are…I am talking about the fact that the surface temperature of the microbolometer is being changed by IR emission from the sky. THAT IS the greenhouse effect.

UAH Global Temperature Update for April, 2013: +0.10 deg. C

Friday, May 3rd, 2013

Our Version 5.5 global average lower tropospheric temperature (LT) anomaly for April, 2013 is +0.10 deg. C, down from +0.18 deg. C in March (click for large version):
UAH_LT_1979_thru_Apr_2013_v5.5
Not surprisingly, the cooling appears to be confined to the Northern Hemisphere…the global, hemispheric, and tropical LT anomalies from the 30-year (1981-2010) average for the last 16 months are:

YR MON GLOBAL NH SH TROPICS
2012 1 -0.134 -0.065 -0.203 -0.256
2012 2 -0.135 +0.018 -0.289 -0.320
2012 3 +0.051 +0.119 -0.017 -0.238
2012 4 +0.232 +0.351 +0.114 -0.242
2012 5 +0.179 +0.337 +0.021 -0.098
2012 6 +0.235 +0.370 +0.101 -0.019
2012 7 +0.130 +0.256 +0.003 +0.142
2012 8 +0.208 +0.214 +0.202 +0.062
2012 9 +0.339 +0.350 +0.327 +0.153
2012 10 +0.333 +0.306 +0.361 +0.109
2012 11 +0.282 +0.299 +0.265 +0.172
2012 12 +0.206 +0.148 +0.264 +0.138
2013 1 +0.504 +0.555 +0.453 +0.371
2013 2 +0.175 +0.368 -0.018 +0.168
2013 3 +0.183 +0.329 +0.038 +0.226
2013 4 +0.103 +0.119 +0.087 +0.168