Home/Blog
This is the third in my (never-ending, it appears) series on measuring the effect of Urban Heat Islands (UHI) on land surface temperature trends.
In Parts I and II I emphasized the Landsat-based “built-up” structure dataset as a proxy for urbanization, which I’m sure we will continue to examine as part of our Department of Energy grant to examine (mostly) satellite-based methods and datasets for testing climate models and their predictions of global warming.
Much of the original research on the UHI effect (e.g. T.R. Oke, 1973 and later) related warming to the total population of towns and cities. Since population datasets extend back in time much further than the satellite period, they can provide information on the UHI effect going back well before 1900. In the last few weeks I’ve taken a detour from using the Landsat-based diagnoses of human settlement built-up structures as a proxy for urbanization, to population density (PD). Along the way I’ve had to investigate issues related to low correlations, and linear regression (specifically, regression dilution). I decided not to cover that here because it’s a little too technical.
The deeper I dig into this project, the more I learn.
Urbanization Effects from 1880 to 2015
I have a lot of results I could show, but I think I will introduce just one plot that should be of interest. Using tens (in the early years) to hundreds of thousands of 2-station pairs of temperature differences and PD differences, I sort those from the smallest to largest 2-station average PD. Then I perform regressions in separate PD intervals (12 to 19 of them) to get the change in temperature with population density (dT/dPD). These coefficients are, in effect, tangents to the non-linear function relating PD to the UHI warming effect. The data shown below are from the month of June in 20-year intervals from 1880 to 2015, in the latitude band 20N to 80N.
Then, by summing those regression coefficients up (integrating them, in calculus terms) from zero PD to the maximum 2-station average PD value, I construct curves of PD vs. UHI effect. I have looked at quite a few published UHI papers, and I cannot find a similar approach to the UHI problem.
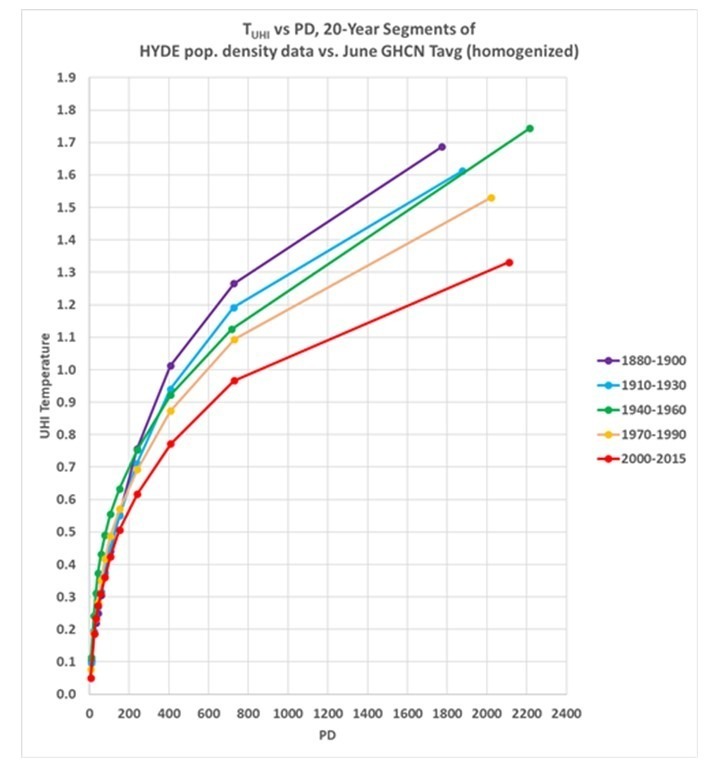
I have to admit, the results in Fig. 1 are not what I expected. They show the total UHI effect being stronger in the late 19th Century, and weakening somewhat since then. (Remember, because these results are based upon 2-station differences, these are spatial relationships, that is, for the 1880, 1890, 1900 period there is a greater temperature difference between rural and heavily populated locations than in later decades.)
I do not have a ready explanation for this, and ideas are welcome.
If the results were reversed, I would guess it is due to larger errors in early population estimates, since errors in the independent variable (PD) reduces the regression slope (dT/dPD) below the “true” relationship (regression dilution). But just the opposite is happening. And, it cannot be due to much lower numbers of stations in the early periods because that leads to only noise in regression coefficients, not systematic bias.
Some Thoughts
From reading the literature, I think this is rather novel approach that avoids a common problem: the usual separation of stations into “rural” versus “urban” categories. Because the curves in Fig. 1 are non-linear, a nearly rural station will experience much more warming from a given increase in population than will very urban site. Thus, previous investigations that found little difference in temperature trends between urban and rural sites don’t really prove anything. My methodology avoids that problem by constructing curves that start at zero population density (truly rural conditions).
Eventually, all of this will lead to an estimation of how much of the land warming (say, since 1880) has been spurious due to the Urban Heat Island effect. As I have mentioned previously, I don’t believe it will be large. But it needs to be documented.