Archive for March, 2013

Why Climate Feedbacks Cannot be Regional

Saturday, March 30th, 2013

Whenever I see reference to the regional nature of climate feedbacks, I cringe.

I will admit that what happens on a regional basis determines net global climate feedbacks, but feedbacks cannot be evaluated regionally. Feedbacks only make sense in the global average.

First, a summary of what climate feedbacks are, by definition: In response to a surface temperature change, other changes in the climate system (clouds, etc.) can either magnify (positive feedback) or reduce (negative feedback) the original temperature change. The single largest feedback is negative: the increase in infrared energy lost to space as temperature increases. This so-called “Planck effect” is what stabilizes the climate system against runaway change.

Cloud feedbacks are generally considered to be the most uncertain, and could be positive or negative (I believe they are negative). The contribution to water vapor feedback by the atmospheric boundary layer is almost certainly positive, but the free-tropospheric contribution to water vapor feedback is much more uncertain, since it depends upon microphysical processes within precipitation systems which are the source of free tropospheric air.

(And for those who object to the use of “feedback” in a climate context, sorry. Until a better term comes along which better reflects the recursive nature of the forcing-response process, we are stuck with it.)

So, why can’t feedbacks be evaluated regionally? Because a change in one region will, in general, affect other regions, through changes in atmospheric vertical circulation systems.

For example, if the Pacific warm pool was to warm, we might expect increases in clouds and precipitation there. But those changes are the result of increased rising air over the warm pool, and that extra rising air must — through mass continuity — be exactly matched by increased sinking air away from the warm pool…possibly thousands of miles away.

In fact, since in the tropics the areal extent of (weakly) sinking air is so much greater than that of the (strongly) rising air, the feedback response to a warming of the warm pool can be dominated by what happens thousands of miles away from the warm pool. This is why the original “thermostat hypothesis” of Ramanathan and Collins (1991) was widely criticized as too simplistic.

Feedbacks can only be evaluated over entire vertical circulation systems, and since these systems are interconnected around the world without clear boundaries, feedbacks really only make sense in the global average.

Now, it might well be that the feedback response is different for different kinds of forcing, or it might be that the net feedback varies over time as the climate system evolves in response to a forcing. My only point is that it doesn’t really make sense to talk about “regional feedbacks”, unless you know that the regional change has not affected vertical circulation systems that extend outside the region of interest. Sure, you can compute a number for the change in the regional radiative budget in response to a temperature change, but it would be incorrect to call that number the “feedback response” to the temperature change.

Stossel Show: Schmidt, Spencer, & Ridley on Global Warming

Wednesday, March 27th, 2013

John Stossel interviewed me and Gavin Schmidt yesterday at the FoxNews studios in Manhattan, and I’m told he will interview Matt Ridley today, for tomorrow nights Stossel Show (9 p.m. EDT Thursday, March 28, Fox Business Channel) entitled “Green Tyranny”. As is often the case, the show might air on FoxNews Channel once or twice this weekend.

Looking for a global warming debate, Stossel said they asked 10 natural climate change deniers (sorry, my term, I couldn’t help myself), and only Gavin took them up on it. Scott Denning was also willing, but unavailable.

At least Gavin knows what he’s talking about…I’ve debated people who so badly mangled the explanation of anthropogenic climate change that I had to fix it for them so the audience wouldn’t be misled.

I thought we both held our own, although I wish I would have answered his CO2 “fingerprint” claims better. There is no CO2 fingerprint of warming; warming due to any cause (say, a slight decrease in oceanic cloudiness) will look basically the same: stronger over land than ocean (a land-vs-ocean heat capacity issue); warming *should* increase with height in the troposphere (a moist convective adjustment issue).

What could cause a natural change in clouds (as I am sometimes asked by the other side)? Well, what causes chaos?

I agreed with Gavin that stratospheric cooling might well be a fingerprint of increasing CO2, but the stratosphere involves MUCH simpler physics than the troposphere/land/ocean system, with basically just radiation operating, no clouds, and a vanishingly small heat capacity. The coupled ocean/atmosphere climate system is a nonlinear dynamical system, thus chaotic, capable of causing changes all by itself. The past evidence for natural climate change on multidecadal, centennial, and millennial time scales is abundant.

The average energy imbalance associated with ocean warming since the 1950s — so widely attributed to our CO2 emissions — is only 1 part in 1,000 (around 0.25 Watts/m2 versus average flows closer to 250 W/m2)…do we really believe the climate system is incapable of causing such imbalances all by itself? Just based upon global warming theory, I believe part of the warming *is* anthropogenic, but as I said during taping, I don’t think we have a clue how much of it.

Talking with Stossel afterward, he said he thought Gavin did a good job of articulating his position. I hope Gavin is willing to return, although I could tell he was somewhat annoyed by the conservative/libertarian vibe he was surrounded by. It will also be interesting to see what Matt Ridley has to say.

Aqua AMSU ch. 5 Bites the Dust

Monday, March 25th, 2013

Many people have noted on the satellite temperatures webpage the plunge in temperatures as recorded by AMSU channel 5 on the Aqua satellite. Since it looked pretty suspicious, I decided to investigate.

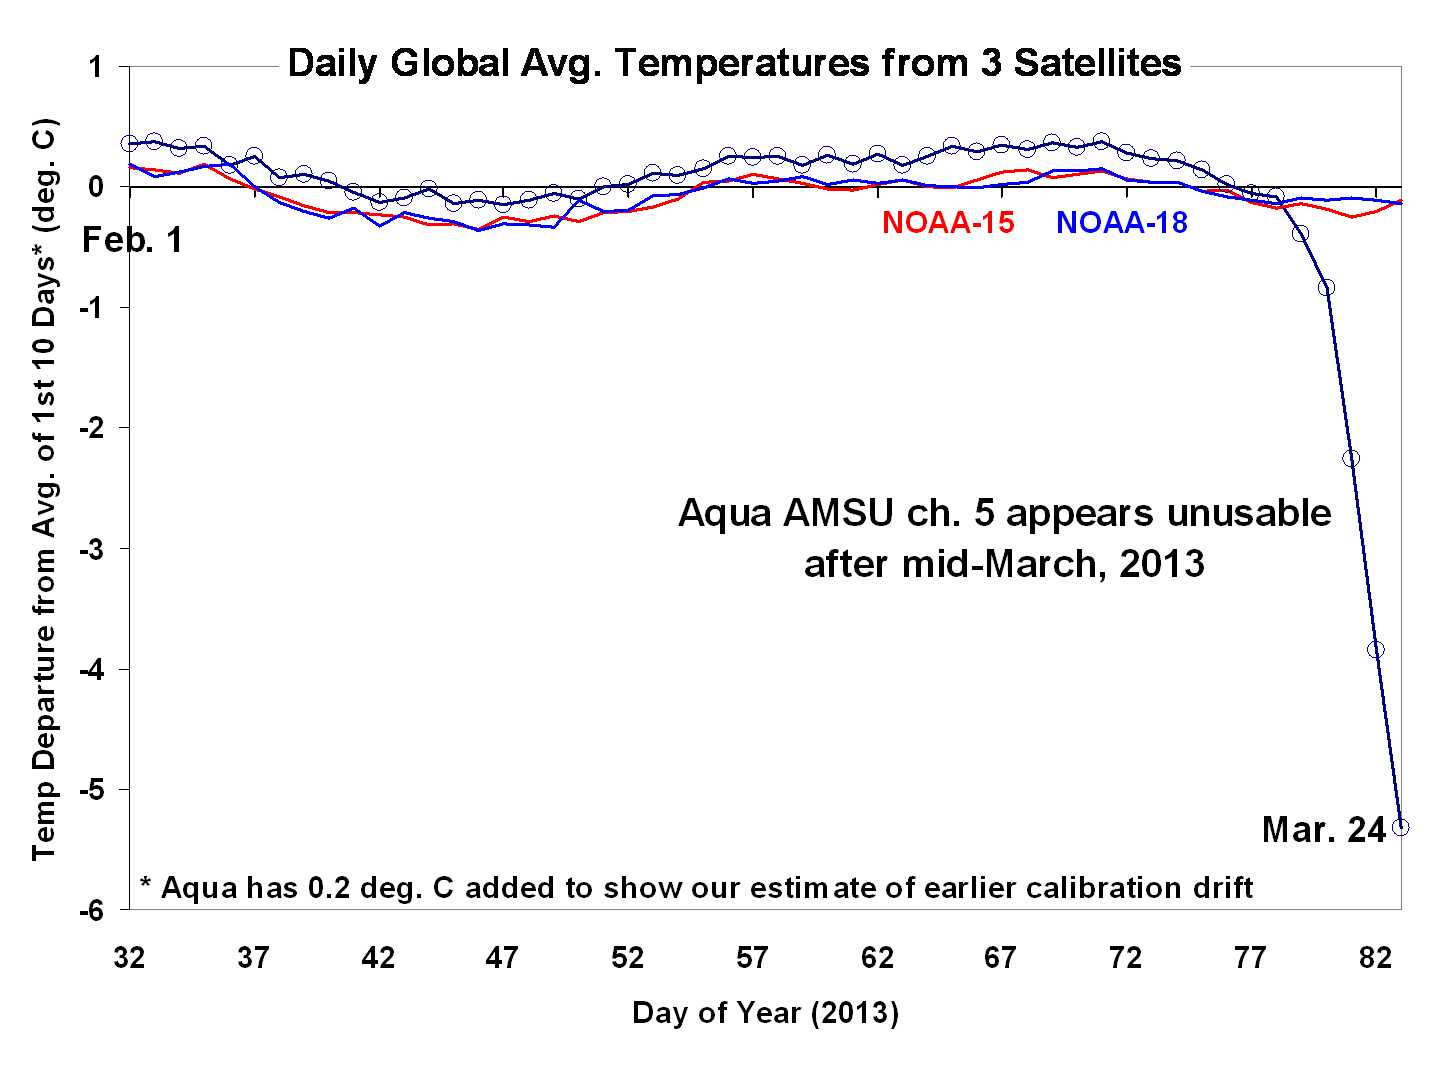
The following plot shows 3 satellites’ global AMSU5 measurements (Aqua, NOAA-15, and NOAA-18) that I computed this morning from the raw orbit files. The dates run from Feb. 1 through yesterday, March 24:

Aqua-AMSU5-drift-after-mid-March-2013

Clearly, Aqua AMSU ch 5 is now “out to lunch”. The reason why the plunge in Aqua temperatures in the above plot is so much stronger than what is displayed on the daily update website is that the latter shows running 3-day averages, and is only updated through March 23.

We knew that this channel has been slowly failing for a long time, which is why we have not been using it in our monthly updates. We will discuss the possibility of switching to the NOAA satellites on the website, although since the site is NASA-funded, they are reluctant to spend resources on NOAA satellite data. But, given the popularity of the page, we will work something out even if we have to make our own web page.

100 Years Ago Today: The Omaha Palm Sunday Tornado of 1913

Saturday, March 23rd, 2013

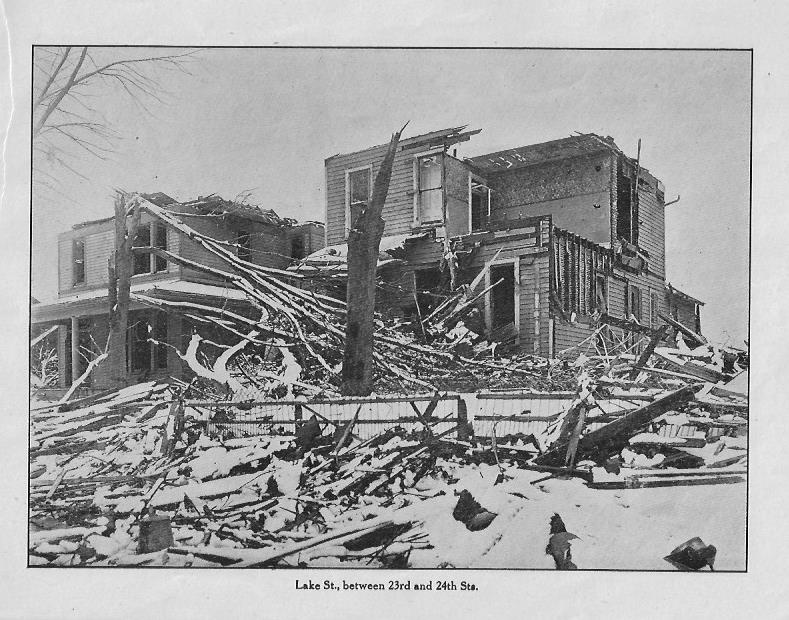
I ran across an old pamphlet with photos of the tornado which struck Omaha 100 years ago today, and thought I would post a few. The tornado killed 140, injured 350, and demolished 550 houses (click on the photos for the full-size versions).
Omaha-1913-tornado-cover
Here’s the 1st page description:
Nut-Shell Story of the Deadly Tornado
This most destructive windstorm hit Omaha about six o’clock in the evening, Easter Sunday, March 23, 1913. To the eye it had the distinctive funnel-shaped twisting character of the typical tornado, sweeping along at a furious rate of speed.

To the ear it conveyed the sound of a crashing din and a mighty rush of water. It was accompanied by a lurid brass-yellow luminous atmosphere followed immediately by dense darkness and a heavy downpour of rain lasting nearly an hour.

It came from the southwest, crossing the city diagonally striking the most densely populated residence districts, the poorer dwellings in the lowlands, and the most beautiful homes on the hills. It’s passage was almost without warning except a sharp fall of the barometer and temperature; it came and went within a few seconds, giving people scarcely time to get to their cellars.

The path of the tornado through the city is from two to six blocks wide and four and a half miles long. Its destructiveness is not uniform, being mostly noticeable at intervals indicating an undulating movement of the storm cloud, rising and falling each time it struck with full force.

The damage done and the desolation left in its wake are clearly portrayed by the photographs taken the next day, and by those taken a second day after a light snowfall.

The description suggests an isolated supercell thunderstorm merging with a squall line, which was followed by a cold air mass. Clearly, had they known about the science of tornadoes back then, the event would have been blamed on the methane emissions from their horses. /sarc

Check out the cool skull-tornado artwork:

Omaha-1913-tornado-stats

Omaha-1913-tornado-crowd-bodies

Note the board driven through the side of this upright piano:
Omaha-1913-tornado-board-thru-piano

Omaha-1913-tornado-old-cars

Omaha-1913-tornado-downtown

Omaha-1913-tornado-snow-and-houses

Omaha-1913-tornado-church

If the tornado had hit this area today, there would be much more damage simply because there are more structures. It is hard to say what the loss of life would be, though, with a higher population density but better warnings.

New Satellite Temperature Trends Page

Friday, March 22nd, 2013

AMSU-temp-trends-website-example

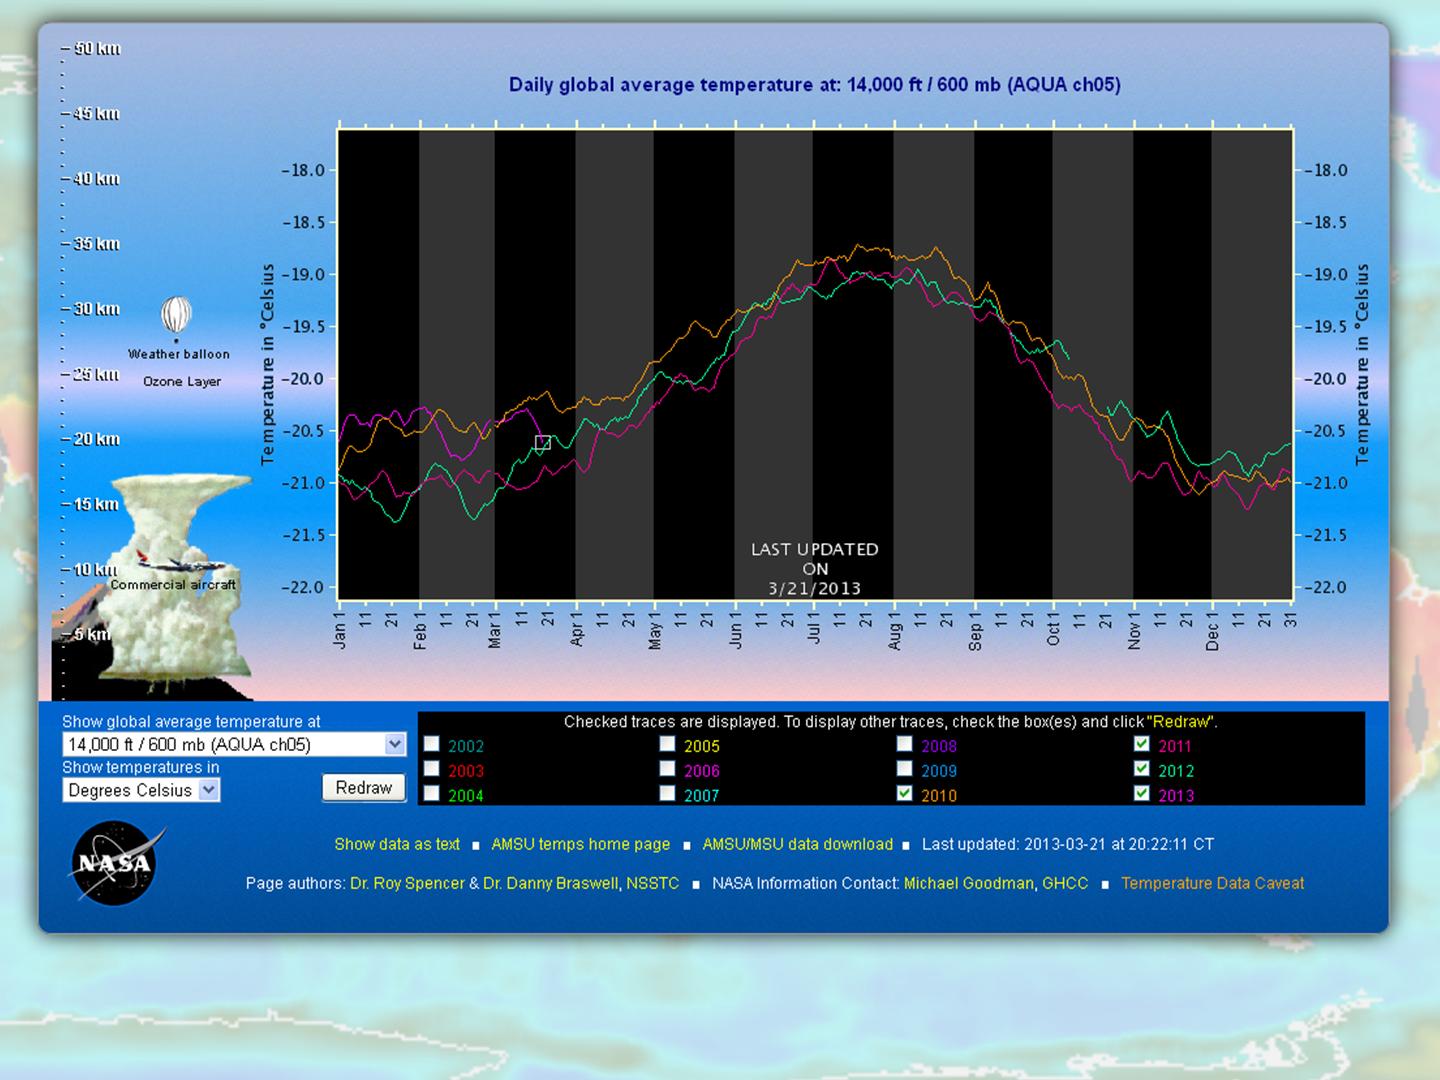
There is a new location for the daily global satellite temperature page:

http://ghrc.nsstc.nasa.gov/amsutemps/

Choose “ch. 5” to get the channel closest to our (UAH) lower tropospheric (LT) product that we update once a month. Use “ch. 9” if you are interested in the lower stratosphere.

As a reminder…this page shows data from the AMSU instrument flying on the Aqua satellite, which we don’t use anymore because it is drifting warm relative to other satellites. For ch. 5, it is currently running about 0.2 deg. C too warm, so keep that in mind when estimating how the current month is shaping up compared to the same calendar month in previous years.

PanSTARRS comet time lapse

Thursday, March 14th, 2013

I made this time lapse video of the PanSTARRS comet last night from just north of Hytop, Alabama. It gets noisy near the end due to the fixed exposure setting combined with a darkening sky. Taken with a Canon 5D Mk II, with a Canon 70-200 mm lens (200 mm at f2.8), ISO=250, 2.5 sec exposures taken every 4 seconds, HDR processing with Photomatix.

PanSTARRS comet time lapse video

Global Microwave Sea Surface Temperature Update for Feb. 2013: -0.01 deg. C

Monday, March 4th, 2013

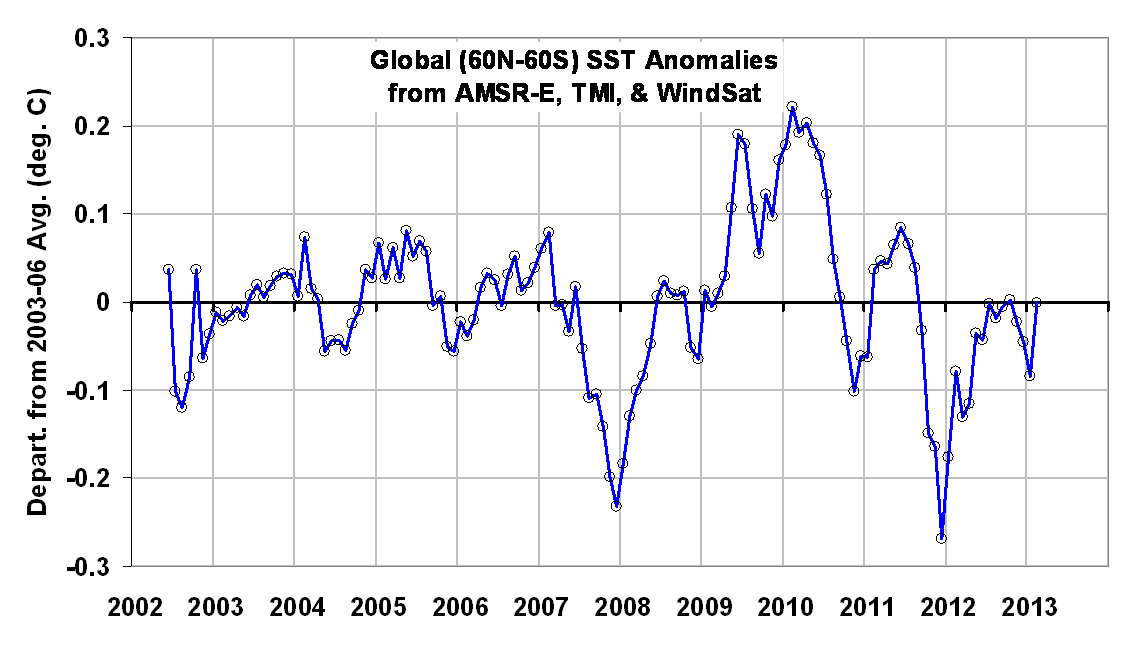
The global average sea surface temperature (SST) update for Feb. 2013 is -0.01 deg. C, relative to the 2003-2006 average: (click for large version)RSS_mwSST_2002_thru_Feb_2013

The anomalies are computed relative to only 2003-2006 because those years were relatively free of El Nino and La Nina activity, which if included would cause temperature anomaly artifacts in other years. Thus, these anomalies cannot be directly compared to, say, the Reynolds anomalies which extend back to the early 1980s. Nevertheless, they should be useful for monitoring signs of ocean surface warming, which appears to have stalled since at least the early 2000’s. (For those who also track our lower tropospheric temperature [“LT”] anomalies, these SST anomalies average about 0.19 deg. C cooler over 2003-2006.)

The SST retrievals come from Remote Sensing Systems (RSS), and are based upon passive microwave observations of the ocean surface from AMSR-E on NASA’s Aqua satellite, the TRMM satellite Microwave Imager (TMI), and WindSat. While TMI has operated continuously through the time period (but only over the tropics and subtropics), AMSR-E stopped nominal operation in October 2011, after which Remote Sensing Systems patched in SST data from WindSat. The various satellite datasets have been carefully intercalibrated by RSS.

Despite the relatively short period of record, I consider this dataset to be the most accurate depiction of SST variability over the last 10+ years due to these instruments’ relative insensitivity to contamination by clouds and aerosols at 6.9 GHz and 10.7 GHz.

UAH Global Temperature Update for February, 2013: +0.18 deg. C

Monday, March 4th, 2013

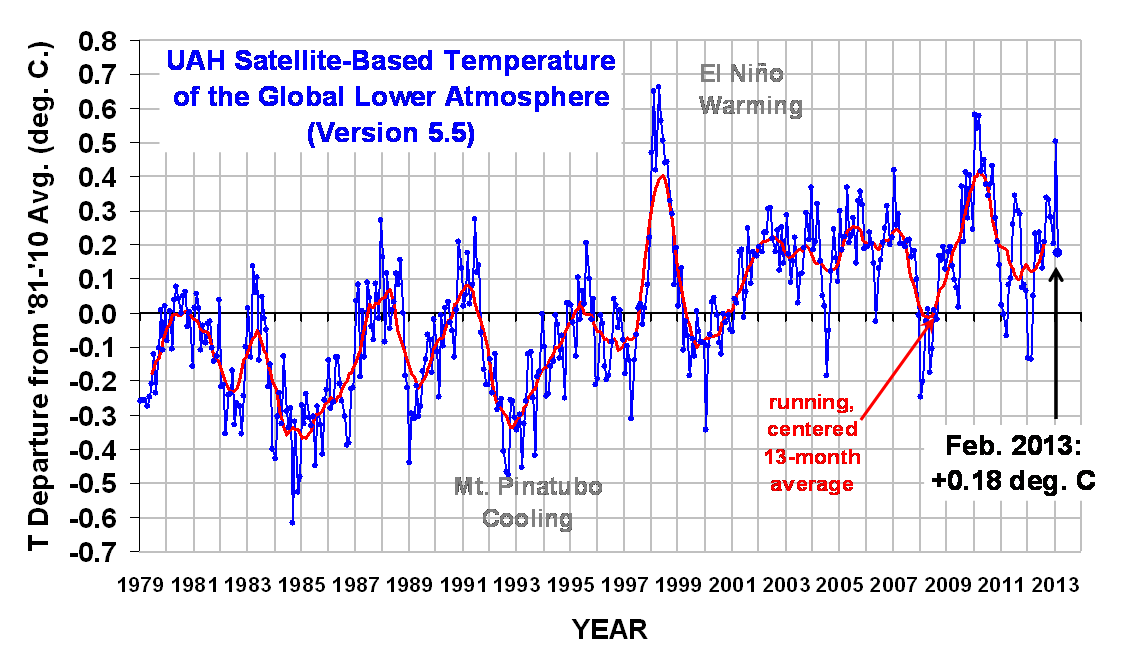
Our Version 5.5 global average lower tropospheric temperature (LT) anomaly for February, 2013 is +0.18 deg. C, a large decrease from January’s +0.50 deg. C. (click for large version):
UAH_LT_1979_thru_Feb_2013_v5.5

These large month-to-month changes are not that uncommon, especially during Southern Hemisphere summer, and are due to small variations (several percent) in the convective heat flux from the ocean surface to the atmosphere.

The global, hemispheric, and tropical LT anomalies from the 30-year (1981-2010) average for the last 14 months are:

YR MON GLOBAL NH SH TROPICS
2012 1 -0.134 -0.065 -0.203 -0.256
2012 2 -0.135 +0.018 -0.289 -0.320
2012 3 +0.051 +0.119 -0.017 -0.238
2012 4 +0.232 +0.351 +0.114 -0.242
2012 5 +0.179 +0.337 +0.021 -0.098
2012 6 +0.235 +0.370 +0.101 -0.019
2012 7 +0.130 +0.256 +0.003 +0.142
2012 8 +0.208 +0.214 +0.202 +0.062
2012 9 +0.339 +0.350 +0.327 +0.153
2012 10 +0.333 +0.306 +0.361 +0.109
2012 11 +0.282 +0.299 +0.265 +0.172
2012 12 +0.206 +0.148 +0.264 +0.138
2013 1 +0.504 +0.555 +0.453 +0.371
2013 2 +0.176 +0.369 -0.016 +0.169