Archive for October, 2012

What Is Making Frankenstorm Sandy Exceptional?

Monday, October 29th, 2012

NASA MODIS image of Hurricane Sandy on 10/28/2012
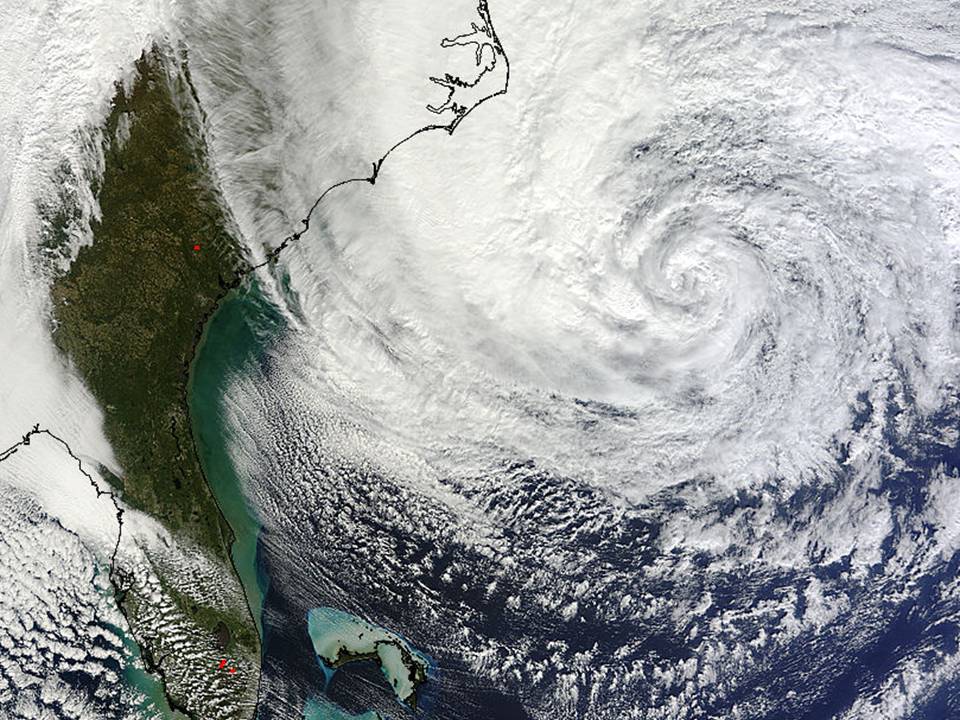
As Hurricane Sandy completes it’s transformation into a strong nor’easter (“Frankenstorm Sandy“), I think it will likely break a record for the lowest barometric pressure for a “winter” cyclone in the Northeast U.S. There will also be widespread heavy rain, which almost always leads to some local record rainfall amounts depending upon just where rain bands happen to sit for an extended period of time.

But I predict it won’t break any records for wind speeds or snowfall. A few locations might see record storm surges, but again those have a lot to do with the chance superposition of wind direction, long fetch, and lunar tides.

So what has made Sandy so exceptional?

It is basically the “perfect storm” scenario of the chance timing of a tropical cyclone merging with an extra-tropical winter-type storm. Without Hurricane Sandy off the coast, the strong trough over the eastern U.S. (caused by cold Canadian air plunging southward) would have still led to a nor’easter type storm forming somewhere along the east coast of the U.S. But since Hurricane Sandy just happens to be in the right place at the right time to merge with that cyclone, we are getting a “superstorm”.

This merger of systems makes the whole cyclone larger in geographical extent than it normally would be. And this is what will make the surface pressures so low at the center of the storm.

This type of event is certainly not unprecedented, and something like it happens just about every year…just not over the Northeast U.S. These events are somewhat more common in the northwest Pacific Ocean or farther north in the Atlantic Ocean. We did an internal study of these events about ten years ago (never published) using QuikScat, AMSU, and buoy data, and it is amazing just how strong some of these hybrid winter storms can get.

So, while Frankenstorm Sandy will indeed have great local significance, it is premature to claim it has any global significance, such as a response to global warming. We would need to see more of these events occurring over many years, on a quasi-global basis…and even then the increase would need to be shown to be unrelated to natural climate modes of variability, such as the Pacific Decadal Oscillation or Arctic Oscillation.

Frankenstorm Sandy Approaches

Friday, October 26th, 2012

Hurricane Sandy’s interaction with an approaching trough and cold front from the west looks like it will provide a near repeat of the infamous Perfect Storm event, almost exactly 21 years to the day that the Andrea Gail was lost on October 28, 1991.

Hurricane Sandy’s “attempted” path would be to recurve off the East coast and head out to sea, as most East Coast hurricanes do. But the chance timing of the approaching upper level trough and cold front, which would favor some amount of coastal storm development anyway, will merge with Sandy and drag her back to a landfall somewhere (it appears at this point) from Chesapeake Bay to Long Island.

The instability caused by the clashing cold air mass and the warm, moist tropical air associated with Sandy will create a massive nor’easter, and the resulting storm has already been dubbed Frankenstorm Sandy since it will ruin Halloween trick-or-treating for many in the mid-Atlantic states and New England.

The high wind field will cover a large area, with highest winds not necessarily near the low center, since this will not be a hurricane per se. Large, probably record-setting amounts of rain can be expected in some localized areas wherever atmospheric lifting becomes maximized and persistent.

Wet snow can be expected on the western periphery of the storm, which right now looks to be from West Virginia through western Pennsylvania and extreme western New York state.

A 100-Year Storm?
Some are already saying this will be a 100-year storm. But this is a rather meaningless term. If it means the worst storm to hit New England in 100 years, I would doubt that will be the case, since there have been many epic nor’easters.

It is more likely that a few locations will see 100-year class precipitation totals, or maybe record low barometric pressures, and maybe even record high wind speeds.

Nevertheless, the formation of this particular storm will indeed be unusual, owing to the unusual combination of both a pre-existing tropical hurricane with extratropical cyclogenesis. There is little doubt that the resulting storm will indeed be historic, if not a record-setter, in its geographic extent and intensity.

Climate of Doubt about PBS’s Objectivity

Wednesday, October 24th, 2012

UPDATE (10/25/2012 2:30 p.m. CDT): As can be seen from the comments below, Catherine at PBS/Frontline says they did not interview me for this show. If this is the case, then the video of me used in the trailer was taken from some other interview. While John Christy and I seemed to recall a visit from PBS, we get a lot of film crews come through our offices (almost always freelancers who are hired for the job), and so I will have to check my old calendars (which are at home) to make sure whether someone claiming to represent PBS was here or not.

Another commenter noted that my words could be taken as either supporting the skeptics or the alarmists, depending on whether they are viewed in the context of being mixed in with Monckton & Ebell, or in the context of the whole show. Granted.

A saddened Big Bird leaves PBS studios after learning of journalistic malpractice.

This is just one more reason to defund PBS. If a “journalistic” organization cannot even provide some level of objectivity, why should the taxpayer be forced to support it?

From 0:18 to 0:21 in this trailer for the show “A Climate of Doubt”, I am seen talking about the U.S. government funding only research which supports global warming alarmism:

…yet, the viewer of the entire show will come away with the mistaken impression that I was instead talking about skeptics of manmade global warming being funded by shady organizations.

Note that PBS only showed my mouth in the above clip…why? Maybe because if my face was shown, people would find out that it was skeptic Roy Spencer speaking, and not some informant supposedly revealing the dastardly deeds of skeptics.

As I recall, I spent at least an hour with the PBS film crew outlining the skeptics case and why we speak out. None of it was used…except the small clip above, with the apparent intent to deceive the viewer.

Shame on PBS. They have now joined, along with BBC, my blacklist of news organizations to never do an interview with again. Fool me once….

PBS’s “Climate of Doubt”, tomorrow night

Monday, October 22nd, 2012

Since my “talking mouth” is in the trailer for Frontline’s Climate of Doubt, airing tomorrow evening (October 23), I suspect I’ll be in this show.

Here’s how the website introduces the special:

Four years ago, climate change was a hot issue and politicians from both sides seemed poised to act. Today public opinion on the climate issue has cooled considerably. Politicians either ignore it or proclaim their skepticism. What’s behind this massive reversal? On Oct 23, FRONTLINE goes inside the organizations that fought the scientific establishment to shift the direction of the climate debate.

Now, I’ve been giving public talks all over the country for a lot longer than four years, and I can tell you that mainstream America has always been skeptical of the theory that humans are killing the planet with our CO2 emissions. Nevertheless, politicians and the popular press tend to control the narrative, and for a long time the public was misled about the strength of the science behind global warming theory.

Note I said the public was misled about “strength of the science”, not “strength of scientists’ beliefs”.

And may I remind you that we let politicians, especially Al Gore, tell us what the scientists believed? Many scientists didn’t like the way Gore presented his case, with such certainty, and making connections that couldn’t really be made (like hurricanes and global warming).

Anyway, I fear this will be a hit piece against skeptics in general, that we are a bunch of Big Oil or Koch brother-funded hacks. I hope I’m wrong. (Personally, I am still waiting for some of that Big Oil or Koch money to come my way.)

Finally, I wonder whether PBS will even address what really killed public concern over anthropogenic global warming: even if Al Gore was right, it’s the economics that ends up killing global warming policy. As it is, current “green” policy is driving up petroleum prices and helping Big Oil make even more money, since we can’t live without petroleum. We’re “addicted to oil” in the same way we are “addicted to food”.

So, the “Climate of Doubt” isn’t as much doubt over the science (which the PBS special will emphasize) as it is doubt over the ability of any energy policy change to produce a net beneficial outcome.

It’s Time for the 99% to Start Supporting the 1%

Wednesday, October 17th, 2012

A persistent misconception about our economy is that the same amount of stuff is going to be produced, no matter what government policies are implemented. If that was indeed true, then the political debate only becomes one over how all that stuff is divided up. And that is indeed what many people spend their time debating.

But economic productivity can vary tremendously between countries, and even within a country over time. In fact, there are many poor countries with much lower unemployment than the United States…yet they remain poor.

What really matters for a prosperous nation is what is produced for a given amount of labor. We could have near-zero percent unemployment tomorrow if the government mandated that half the people should dig holes in the ground and the other half fill them up again. But we would be a very poor country, with a very low standard of living.

A high standard of living requires efficiency of production of goods and services that the people want, which in turn requires large investments in facilities, machinery, raw materials, etc. In a competitive free market economy, those investments involve risk…risk that your investment will be lost if someone else figures out a more efficient way to build 10 million smartphones than you figured out.

Now, why would anyone choose to invest large sums of money? Only if they have some hope of receiving much more in return if they are successful. If that incentive provided by the hope for profit is lost, then they will not invest in new business enterprises. No business enterprise for them means no jobs for you.

Our number one priority should be to ensure that producers are allowed to produce, and that they are not penalized for their success. Jobs happen from the top-down (not from the middle-out) when businesses with the money to hire people are allowed the opportunity to succeed.

Yes, a few of them will become rich in the process…but their riches pale in comparison to the greater riches enjoyed by society as a whole through the higher standard of living the good ideas of the rich have enabled. And those profits aren’t kept under a mattress…they are reinvested in the economy, either through expanding the business, hiring more people, or even just buying more stuff which supports other businesses.

Demonizing the rich is demonizing the driving force which elevates the standard of living of the whole country. If you want prosperity, allow the producers to produce. Make it easier for them, not harder.

Not only does this raise our standard of living, it also increases tax revenue, because revenue is a percent of the action, and the more economic activity there is, the greater the tax revenue which is collected to support government services.

And this is how the budget “arithmetic” really works. Balancing the federal budget is not a matter of either (1) increasing tax rates or (2) decreasing spending. That erroneous view mistakenly equates tax rates with tax revenue. Tax revenue (the total number of dollars taken in by the government) is the tax rate multiplied by economic activity. Lowering tax rates, especially on businesses, stimulates economic activity, which then increases tax revenue.

You Don’t Really Want to Play by the Same Rules

For those who like the mantra “everyone should play by the same rules”, let me tell you: you don’t really want to play by the same rules as business. Business owners typically don’t take their share until all of their employees are paid and all of their other business bills are paid.

For every successful rich person, there were many more who tried to become rich but lost everything. Why is it that so many people want a greater share from those who have succeeded, but don’t want to share in the losses of those who failed to become rich?

What if the business you work for fails? How would you like to pay back all of the salary you earned? You got to keep the money, but the business owner or his/her investors lost that money. Do you really want to play by those rules?

And how would you like to work 12+ hours per day trying to abide by all of the regulations increasingly heaped upon businesses by the government?

It’s time for the 99% to start supporting the 1% a little better, because in the end it is the 1% who enables the 99% to maximize their standard of living.
_____________________________

You can learn more about basic economics from my book Fundanomics: The Free Market Simplified.

UAH V5.5 Global Temp. Update for Sept. 2012: +0.34 deg. C

Friday, October 5th, 2012

As discussed in my post from yesterday, the spurious warming in Aqua AMSU channel 5 has resulted in the need for revisions to the UAH global lower tropospheric temperature (LT) product.

Rather than issuing an early release of Version 6, which has been in the works for about a year now, we decided to do something simpler: remove Aqua AMSU after a certain date, and replace it with the average of NOAA-15 and NOAA-18 AMSU data. Even though the two NOAA satellites have experienced diurnal drifts in their orbits, we have found that those drifts are in opposite directions and approximately cancel. (The drifts will be corrected for in Version 6.0).

The new interim dataset, Version 5.5, has a September, 2012 global lower tropospheric temperature anomaly of +0.34 deg. C (click for large version):

Note that the new v5.5 dataset brings our monthly anomalies over the last few years somewhat more in line with those from RSS, which have been running significantly cooler than ours. The trend change from v5.4 to v5.5, however, only decreases by 0.001 deg. C/decade. This is partly because the time series is now almost 34 years in length, and adjusting the last several months by 0.1 deg or so is not going to affect the long-term trend substantially.

Evidence of the divergence of Aqua from the two NOAA satellites during 2012 is shown in the next plot:

The global monthly differences between v5.5 and v5.4 are shown next, which reveals the rapid divergence in the last couple months of Aqua AMSU from the average of NOAA-15 1nad NOAA-18 AMSUs:

The Version 5.5 hemispheric and tropical LT anomalies from the 30-year (1981-2010) average since January 2010 are:

YR MON GLOBAL NH SH TROPICS
2010 01 0.581 0.747 0.415 0.660
2010 02 0.542 0.623 0.461 0.738
2010 03 0.577 0.721 0.434 0.665
2010 04 0.416 0.609 0.223 0.596
2010 05 0.449 0.593 0.306 0.679
2010 06 0.376 0.430 0.321 0.464
2010 07 0.343 0.455 0.232 0.303
2010 08 0.376 0.480 0.273 0.216
2010 09 0.430 0.351 0.510 0.114
2010 10 0.278 0.232 0.324 -0.053
2010 11 0.208 0.316 0.100 -0.270
2010 12 0.141 0.207 0.075 -0.441
2011 01 0.022 0.036 0.007 -0.382
2011 02 -0.003 0.005 -0.011 -0.350
2011 03 -0.066 -0.013 -0.120 -0.336
2011 04 0.083 0.132 0.034 -0.233
2011 05 0.101 0.082 0.120 -0.061
2011 06 0.260 0.292 0.229 0.183
2011 07 0.343 0.290 0.396 0.169
2011 08 0.300 0.247 0.353 0.143
2011 09 0.290 0.280 0.301 0.128
2011 10 0.073 0.140 0.006 -0.152
2011 11 0.084 0.072 0.096 -0.060
2011 12 0.066 0.119 0.012 -0.033
2012 01 -0.134 -0.060 -0.203 -0.256
2012 02 -0.135 0.018 -0.289 -0.320
2012 03 0.051 0.119 -0.017 -0.238
2012 04 0.232 0.351 0.114 -0.242
2012 05 0.179 0.337 0.021 -0.098
2012 06 0.235 0.370 0.101 -0.019
2012 07 0.130 0.256 0.003 0.142
2012 08 0.208 0.214 0.202 0.062
2012 09 0.338 0.349 0.327 0.155

Again, Version 5.5 is only meant as an interim solution until our Version 6 is ready, which has new corrections for diurnal drift and an improved calibration strategy for the old MSU instruments.

Our reluctance to make these changes sooner is partly due to the flak we get when we are accused of adjusting temperatures downward for no good reason. There is now sufficient evidence (alluded to above) to make such adjustments.

UAH Global Temperature Update for September, 2012: +?.?? deg. C

Thursday, October 4th, 2012

I’ve been receiving an increasing number of e-mails asking, basically, is there something wrong with the Aqua satellite daily global temperatures which are posted at the NASA Discover website?

Well, John Christy and I are ready to say, “yes, there is”.

Over the last few years, the NASA Aqua satellite has been our “backbone”, or reference, satellite since it is kept in a stable orbit with on-board propulsion. This means there are no orbital decay adjustments or diurnal drift adjustments necessary for the AMSU measurements made from Aqua.

Because of this advantage Aqua has over the NOAA polar orbiters, the other satellites (NOAA-15 and NOAA-18) are basically forced to agree with the temperature trends from Aqua AMSU in our processing.

Unfortunately, it just so happens that the main channel we use for tropospheric temperature monitoring, AMSU channel 5, has been experiencing increasing noise in recent years on the Aqua satellite. Evidence of this can be seen in the following plot from those 3 satellites (NOAA-15, NOAA-18, and Aqua) over the last 3 years (click for large version):

The numbers plotted are the average absolute differences from each AMSU scan line to the next in our lower tropospheric temperature (LT) retrieval. With a scan line separation of about 50 km, even a noiseless instrument would produce non-zero values because the satellite is always passing over the tropics, then the poles, then the tropics, etc. In other words, the above plot contains both signal and noise.

Obviously, the noise in Aqua AMSU channel 5 has increased dramatically. In fact, the NASA AIRS Team stopped using Aqua AMSU ch. 5 in their temperature retrievals months ago. (BTW, the LT computation causes an amplification of the instrument measurement noise, but the relative increase in Aqua noise vs. the other satellites is not affected, which from the above plot looks like about a factor of 7 or 8).

So, you might ask, why include Aqua AMSU in our processing if the noise is so large? Well, because we use over 300,000 measurements to get a global monthly average. If the noise in Aqua AMSU ch. 5 was truly random, the huge increase in noise seen in the above plot should not cause a drift in the calibration of the instrument.

But increasing noise in a microwave radiometer can have different causes. And not all of the causes would result in truly random noise characteristics. That appears to be the case with Aqua AMSU ch 5.

So What Is the Corrected Temperature Anomaly for September, 2012?

Version 6.0 of our dataset will take care of the diurnal drift effects, but due to our other responsibilities, John and I have not quite finished v6.0. Nevertheless, we think we can we produce a preliminary update in the next couple weeks. The results suggest that there has been a spurious warming in Aqua AMSU LT which has reached close to 0.2 deg. C last month. It has been increasing over the last couple years. Do NOT expect the long term warming trend during 1979-2012 to decrease, though, because there are other changes to the long-term time series which cancels out the recent spurious warming.

Going to the movies? “Snows Of Superior”

Tuesday, October 2nd, 2012


I was recently contacted by a movie producer who expressed interest in a movie script based upon my life. Granted, this guy contacts many people with the same request, hoping someone will have an interesting story to tell.

For years I’ve had people encourage me to write an autobiography, so I took the opportunity of his request to take a few days off of work and write a spec movie script, instead. I needed the diversion anyway.

Wow, what a trip.

Instead of being a story about the global warming wars (which I don’t think would be a commercial success) it ended up being the true story of me starting out as a poor Black child (OK, well, that part is 2/3 true) in rural Amish country, growing up in a dysfunctional family. After moving to Iowa, my mother died unexpectedly (on my 13th birthday) and I was sent away to northern Michigan to live with relatives I didn’t know.

It’s a story of perseverance in spite of numerous obstacles, against a backdrop of the Viet Nam war tearing families apart. An epiphany provided by Mother Nature is what turns things around.

Along the way, I’ve been involved in historical events, and traveled around the world. There are recurring themes from the beginning to the end of the story: poverty and a chronic health problem to overcome, severe weather events, guns, and several brushes with death, to name a few. The global warming debate and congressional testimonies occur near the end of the story, but are mostly intended to support the recurring themes and the protagonist’s struggle to overcome. It’s not a global warming story.

I suppose the closest similarity to an existing movie would be to October Sky (which I love…it’s about Homer Hickham growing up to eventually become a NASA engineer). But I would say my story offers more in the way of personal challenges to overcome and interesting events along the way. And it’s funnier. (By sheer coincidence, Homer attends the church where I perform in a contemporary Christian rock band.)

The bottom line is, I am selfishly using the bully pulpit of my blog to announce that the script (93 111 pages), synopsis, etc. are all finished, so if there are any other movie producers out there who would like to take a look, just let me know.

“Destiny belongs to those who weather the storm.”

Hey, School Teachers: Those Greenhouse Effect Experiments Are Junk

Tuesday, October 2nd, 2012


Now that the kiddies are back in school, I’m seeing greatly increased traffic at my Weather Questions website. The most visited page is almost always the one explaining the greenhouse effect. (WARNING: comments posted in response to this article will undoubtedly include a few from people who claim the greenhouse effect is physically impossible, does not exist, etc. )

What amazes me are the number of science education web pages out there which claim to describe experiments that supposedly demonstrate the greenhouse effect using jars or other enclosures.

But these experiments can do no such thing.

There is no simple way to demonstrate the greenhouse effect of a small sample of air experimentally with a jar or any other enclosure because over the scale of inches to feet (or even tens of feet) the effect is so weak it cannot be measured with standard thermometers. (Our friend Anthony Watts tried to replicate one totally bogus experiment promoted by Al Gore and Bill Nye the Science Guy).

Now, the infrared absorption properties of small samples of greenhouse gases can indeed be measured with very expensive spectroscopic equipment in a laboratory, but there is no way I know of to do it with jars or other enclosures and a thermometer.

My favorite atmospheric greenhouse effect experiment that does actually work uses an inexpensive handheld infrared thermometer pointed at the sky. This is the most direct demonstration I know of. The reason it is a “direct demonstration” is that the IR thermometer measures tiny temperature changes within the handheld sensor resulting from changes in the amount of IR energy entering the sensor.

This is exactly what the greenhouse effect does to the surface temperature of the Earth: changes in downwelling IR radiation cause changes in surface temperature. It really is that simple.

(NOTE: Even though handheld IR thermometers are supposedly tuned to work at IR wavelengths where atmospheric greenhouse effects are weak, there is still a residual effect. Besides, even if IR thermometers could completely avoid greenhouse gas effects, they would still be sensitive to the greenhouse effect from clouds. Just point the IR thermometer at the clear sky, and then at a low cloud: the warmer IR thermometer reading from the cloud is due to the greenhouse effect from the cloud. Period. End of argument. QED.)

So, science teachers beware. Those greenhouse effect experiments are junk. Do not try them at home.