NOTE: The following post has led to many good comments. The best argument advanced that I am wrong is from a ~1,000 year record of CO2 from the Law Dome ice core (a record I was unaware of) which suggests the recent CO2 increase is almost entirely anthropogenic in origin.
I frequently get asked the question, if natural CO2 emissions are about 20 times what anthropogenic emissions are, how do we know that all of the atmospheric CO2 increase is due to human activities?
One answer often given (and the one I often use, too) is that since we emit twice as much as is needed to explain the atmospheric increase, there is no reason to look elsewhere. Just assume the huge natural sources and sinks of CO2 are in balance, and then humans are responsible for the small changes we see.
Natural Variations in CO2 are LARGE
But what if (I’m NOT necessarily advocating this) most of the CO2 humans produce, which is near the land surface, is absorbed by vegetation, and the observed global increase is partly or mostly due to outgassing of the oceans?
Scientists seem to make the assumption that nature is always in balance. But this clearly isn’t the case for natural sources and sinks of CO2 (you can find such plots in the IPCC reports, too):
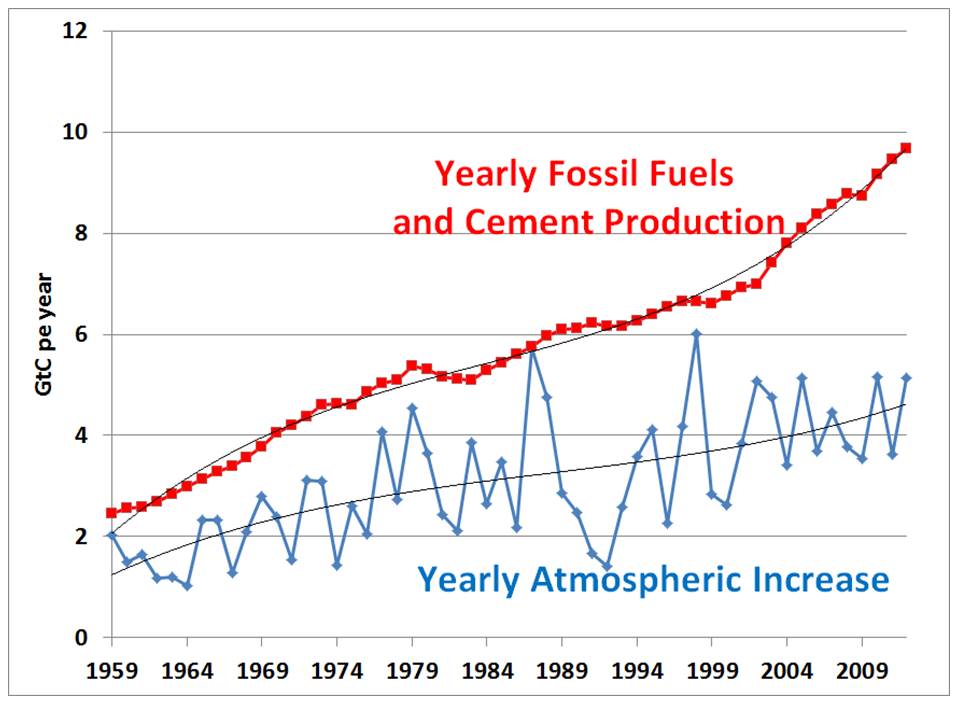
Fig. 1. Yearly anthropogenic CO2 emissions versus yearly increases in atmospheric CO2.
There are obviously some very large natural yearly imbalances in CO2 sources and sinks, with the atmospheric yearly increase ranging anywhere from 23% to 100% of anthropogenic emissions. If the yearly fluctuation are this large, how do we know that nature is in long-term balance for CO2 sources and sinks? The answer is, we don’t. This is why NASA launched the OCO-2 satellite, to try to get a better handle on the regional sources and sinks of CO2 around the world.
Furthermore, in contradiction to IPCC predictions, the ability of the Earth to absorb extra CO2 seems to be increasing with time: the equivalent of 40% of our emissions were being absorbed early in the record, a fraction which has increased to 50% late in the record.
Given these very large year-to-year variations, is it that unreasonable to hypothesize that there might be a long-term natural imbalance between natural sources and sinks of CO2, which is also contributing to the observed increase?
The trouble carbon budget modelers have with this possibility is that it would require that there are even stronger sinks of anthropogenic CO2 emissions at work, and the IPCC is already having trouble explaining where all of the �extra� CO2 is going.
For example, rather than nature normally being in perfect balance and then absorbing ~50% of our CO2 emissions, nature would have to be absorbing (say) 75% of our emissions but contributing the remainder to the observed atmospheric increase from a natural source elsewhere.
We really don�t know where these sources and sinks are�all we see is the net result of all of them expressed in the average atmospheric concentration. Like your bank balance representing the net effects of all deposits and withdrawals.
Carbon Isotopes
The arguments from carbon isotopes (C13…sorry for the unconventional notation) that fossil fuels are the source of all the atmospheric increase don�t hold water as far as I can tell. As I posted nearly 6 years ago, the C13 fraction in the long-term trends of atmospheric CO2 are not inconsistent with a natural source, after I examined the observed C13 variations at three time scales: seasonal, interannual, and long-term trends:
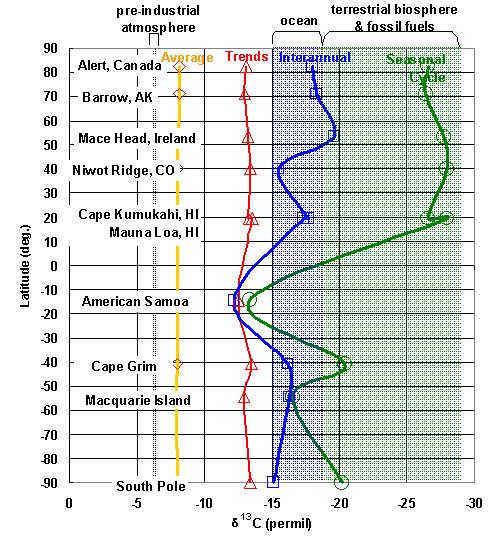
Fig. 2. C13 fraction variations contained in seasonal versus, interannual versus decadal variability, compared to known geophysical sources.
I believe that pointing this out is part of the reason why Murray Salby got into trouble recently. The scientific community doesn’t take kindly to some of us suggesting nature itself might be causing “carbon pollution”. Baaad scientist.
If I am misunderstanding something about the C13 arguments, someone please let me know, since I�m not an expert in atmospheric chemistry. Ferdinand Engelbeen kindly responded to my post from 2009, and if he would like to provide an updated argument I would be glad to post it here.
A Simple Analysis: Could 40% of the CO2 Increase be Natural?
I downloaded from CDIAC the latest spreadsheet with the yearly global CO2 source and sink estimates, for the period 1959 through 2012. I wanted to address the question: from a statistical point of view, how much of the year-to-year changes in atmospheric CO2 can be explained by different sources and sinks?
The spreadsheet includes yearly estimates of (1) atmospheric increase in CO2, (2) fossil fuel and cement production of CO2, (3) an estimate of the ocean CO2 sink, (4) an estimate of land use change emissions CO2 source, and I added to these variables (5) global land surface temperature [CRUTem4], and (6) global sea surface temperature [HadSST3].
As a first step, if we do simple correlations between the atmospheric CO2 variations with the other variables we find the highest correlation between temperature and CO2, and a little lower correlation with anthropogenic emissions:
Correlations with Yearly Atmospheric CO2 increases (1959-2012)
T_ocean : 0.70
T_land: 0.71
Fossil Fuels: 0.67
Ocean sink: 0.63
Land Use: -0.36
The fact that temperature has a higher correlation with yearly CO2 changes than does the anthropogenic source shows just how strongly the temperature variability affects atmospheric CO2 content.
But correlating data with substantial trends in the data can be deceiving. Strictly speaking, all linear trends are perfectly correlated with each other, even those which have no causal relationship whatsoever between them.
So, we can detrend all of the data, and see what information is contained in the departures from the linear trends. This reduces the correlations substantially, since the variability associated with the trends has been removed:
Correlations with Yearly Atmospheric CO2 variations (1959-2012, detrended)
T_ocean : 0.35
T_land: 0.34
Fossil Fuels: 0.13
Ocean sink: 0.01
Land Use: 0.00
We see that the correlation between atmospheric CO2 and temperature remains the strongest, but the fossil fuel signal is very small, possibly because the detrended variations in anthropogenic emissions are quite small, and so subject to greater errors.
The ocean sink and land use estimates seems to have no correlation with atmospheric variations after detrending, and so were excluded from further analysis.
If we then perform a multiple regression between atmospheric CO2 versus the anthropogenic source and 2 temperature terms (all detrended), and apply the resulting coefficients to the original (not detrended) data, we get the following plot:
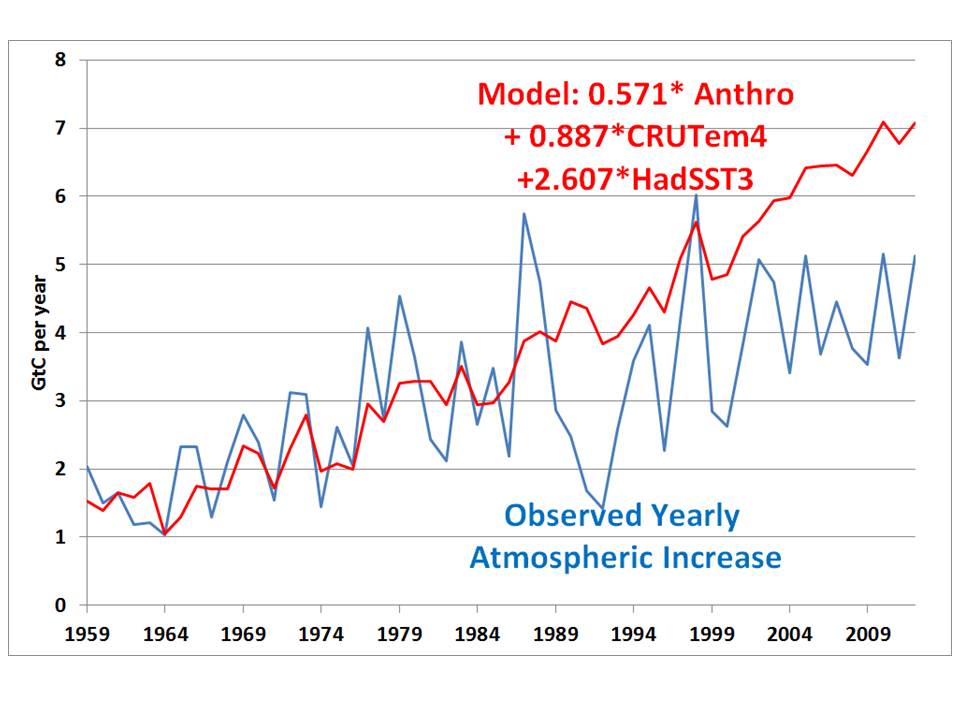
Fig. 3. Yearly changes in atmospheric CO2 in observations versus a simple statistical model trained with detrended anthropogenic emissions and temperature data.
At face value, what this plot shows is that the observed increase in atmospheric CO2 can be easily explained (actually, �over-explained�) with a combination of anthropogenic emissions and increasing temperatures, where the quantitative relationships are based upon detrended data. The contributions to the model trend in atmospheric CO2 is 61% anthropogenic, 22% ocean temperature, and 17% land temperature.
The model overshooting of the trend could be due to some unknown carbon sink which isn�t directly related to surface temperature. Or, it could just be an artifact of the poor assumptions inherent in the simple statistical model (e.g. that the interannual relationship between temperature and CO2 applies to long-term trends).
Conclusions
By itself I don�t think this �proves� anything. But it does show that since warm years tend to cause greater natural emissions of CO2 into the atmosphere, we should at least consider the possibility that the long-term warming trend (whatever its cause) is contributing to the increase in atmospheric CO2.
What caused the warming that caused the CO2 increase? Well, as I have been saying for years, chaotic circulation-induced changes in cloud cover can cause global warming or cooling. Or pick some other mechanism. Maybe that big ball of fire in the sky.
My point is, the climate system is not static.
We should remember how much we have anthropomorphized recent warming: Human activities produce CO2 in reasonably well known amounts, humans do the monitoring of CO2, then humans do the modeling. Since we really don�t understand the natural sources and sinks very well — not to the <1% level needed to document that a �natural balance� exists (since human emissions are now close to 5% of natural sources and sinks) -- we just assume they are “in balance”. There, problem solved.
So, we impose a human explanation on what we observe in nature. A common tendency throughout human history. We are searching for answers at night under the only streetlamp where we can see.
UPDATE: I didn’t address the fact that atmospheric O2 concentrations have fallen commensurate with the rise in atmospheric CO2, which is supposedly “proof” of fossil fuel burning being the 100% cause of atmospheric CO2 increase. But increased oxidation of organic matter has the same effect on O2.
Update #2:Just to clarify…even if all of the atmospheric CO2 increase is manmade, I continue to believe it is more beneficial than harmful.

 Home/Blog