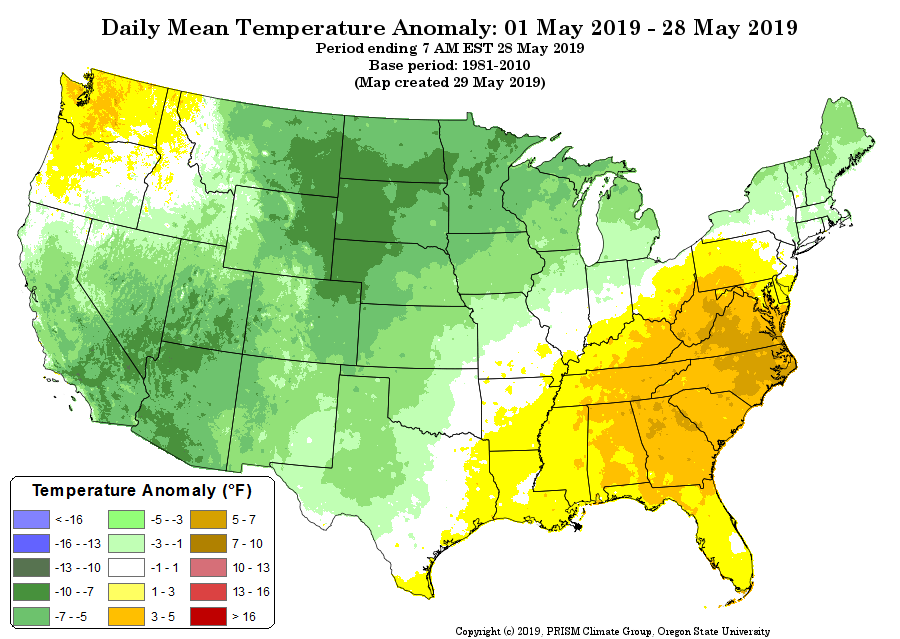
I had an op-ed published at Foxnews.com yesterday describing the reason why we have had so many tornadoes this year. The answer is the continuing cold weather stretching from Michigan through Colorado to California. A persistent cold air mass situated north and west of the usual placement of warm and humid Gulf air in the East is what is required for rotating thunderstorms to be embedded in a strong wind shear environment.
The temperature departures from normal so far this month show evidence of this cold:
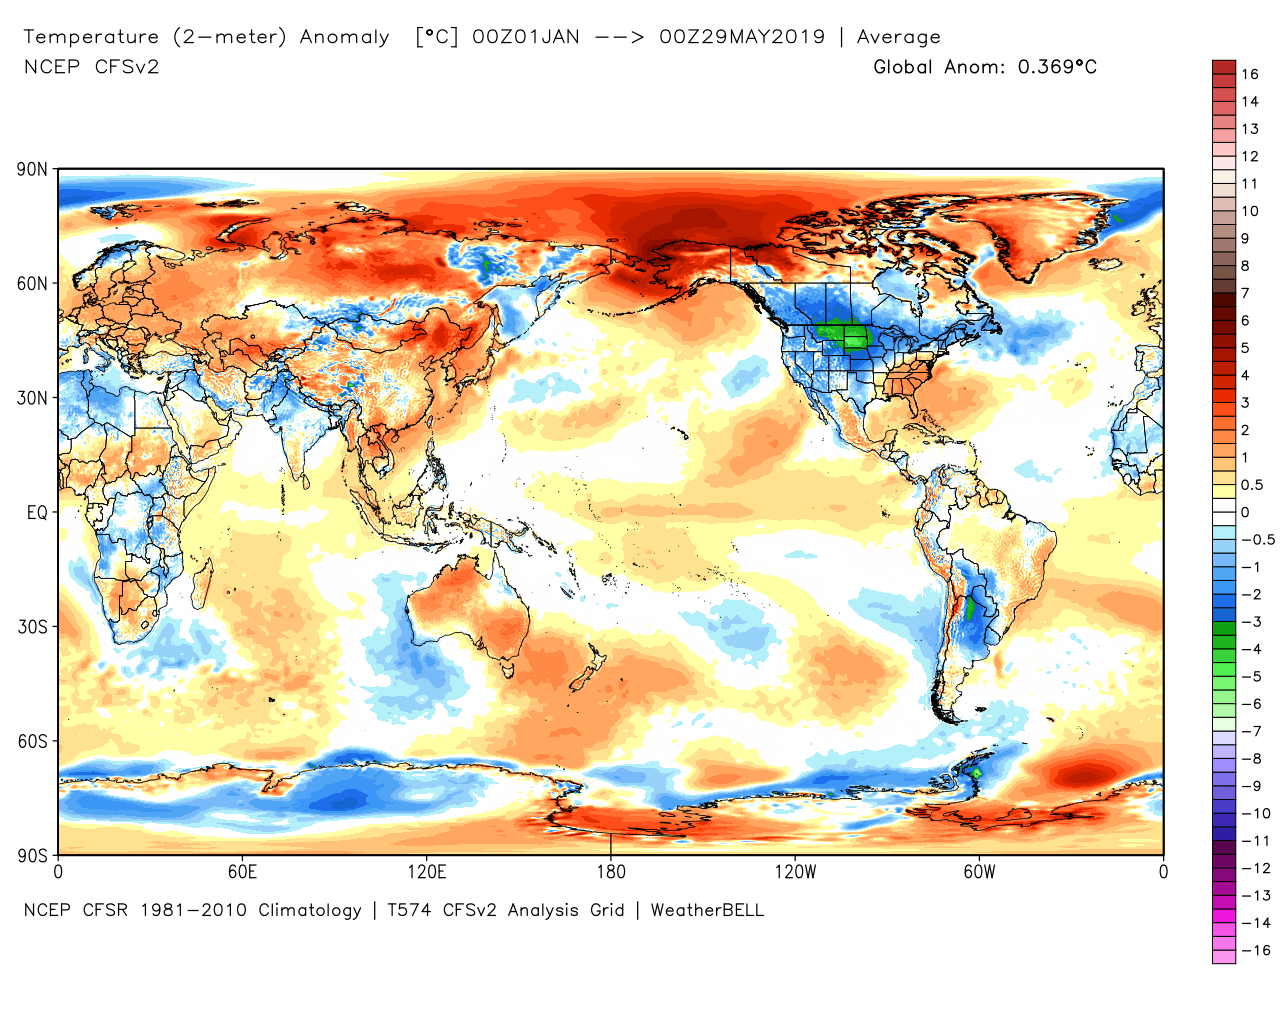
In fact, in terms of departures from normal, so far this year the Northern Plains has been the “coldest place on Earth”, averaging 5-10 deg. F below normal:
The strong wind shear and warm advection provided at the “tightened” boundary between the warm and cold air masses is the usual missing ingredient in tornado formation, unlike Alexandria Ocasio-Cortez’s claim that a New Jersey tornado warning was somehow tied to global warming.
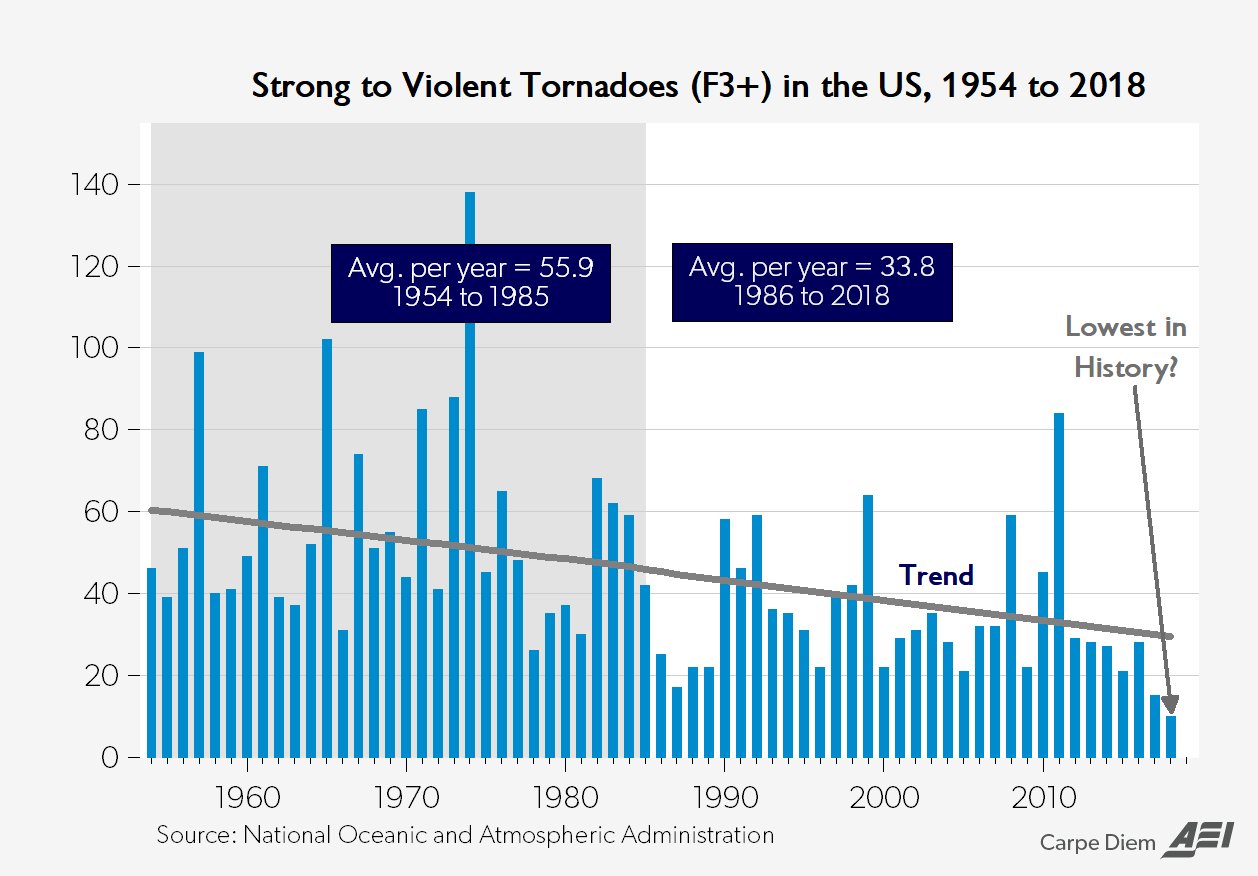
As has been pointed out elsewhere, a trend line fit to the number of strong to violent U.S. tornadoes has gone down from 60 in 1954 to 30 in 2018. In other words, the number of most damaging tornadoes has, on average, been cut in half since U.S. statistics started to be compiled:
Or, phrased another way, the last half of the 65-year U.S. tornado record had 40% fewer strong to violent tornadoes than the first half.
To claim that global warming is causing more tornadoes is worse than speculative; it is directly opposite to the clear observational evidence.
A major uncertainty in figuring out how much of recent warming has been human-caused is knowing how much nature has caused. The IPCC is quite sure that nature is responsible for less than half of the warming since the mid-1900s, but politicians, activists, and various green energy pundits go even further, behaving as if warming is 100% human-caused.
The fact is we really don’t understand the causes of natural climate change on the time scale of an individual lifetime, although theories abound. For example, there is plenty of evidence that the Little Ice Age was real, and so some of the warming over the last 150 years (especially prior to 1940) was natural — but how much?
The answer makes as huge difference to energy policy. If global warming is only 50% as large as is predicted by the IPCC (which would make it only 20% of the problem portrayed by the media and politicians), then the immense cost of renewable energy can be avoided until we have new cost-competitive energy technologies.
The recently published paper Recent Global Warming as Confirmed by AIRS used 15 years of infrared satellite data to obtain a rather strong global surface warming trend of +0.24 C/decade. Objections have been made to that study by me (e.g. here) and others, not the least of which is the fact that the 2003-2017 period addressed had a record warm El Nino near the end (2015-16), which means the computed warming trend over that period is not entirely human-caused warming.
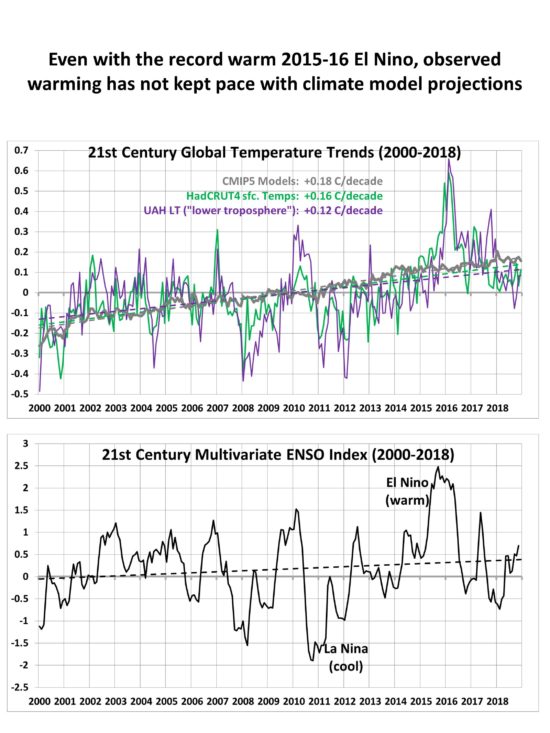
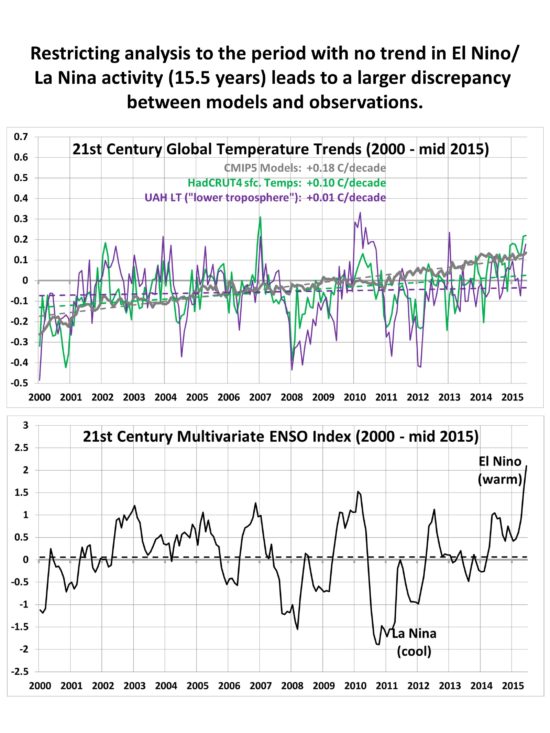
If we look at the warming over the 19-year period 2000-2018, we see the record El Nino event during 2015-16 (all monthly anomalies are relative to the 2001-2017 average seasonal cycle):
Fig. 1. 21st Century global-average temperature trends (top) averaged across all CMIP5 climate models (gray), HadCRUT4 observations (green), and UAH tropospheric temperature (purple). The Multivariate ENSO Index (MEI, bottom) shows the upward trend in El Nino activity over the same period, which causes a natural enhancement of the observed warming trend.
We also see that the average of all of the CMIP5 models’ surface temperature trend projections (in which natural variability in the many models is averaged out) has a warmer trend than the observations, despite the trend-enhancing effect of the 2015-16 El Nino event.
So, how much of an influence did that warm event have on the computed trends? The simplest way to address that is to use only the data before that event. To be somewhat objective about it, we can take the period over which there is no trend in El Nino (and La Nina) activity, which happens to be 2000 through June, 2015 (15.5 years):
Fig. 2. As in Fig. 1, but for the 15.5 year period 2000 to June 2015, which is the period over which there was no trend in El Nino and La Nina activity.
Note that the observed trend in HadCRUT4 surface temperatures is nearly cut in half compared to the CMIP5 model average warming over the same period, and the UAH tropospheric temperature trend is almost zero.
One might wonder why the UAH LT trend is so low for this period, even though in Fig. 1 it is not that far below the surface temperature observations (+0.12 C/decade versus +0.16 C/decade for the full period through 2018). So, I examined the RSS version of LT for 2000 through June 2015, which had a +0.10 C/decade trend. For a more apples-to-apples comparison, the CMIP5 surface-to-500 hPa layer average temperature averaged across all models is +0.20 C/decade, so even RSS LT (which usually has a warmer trend than UAH LT) has only one-half the warming trend as the average CMIP5 model during this period.
So, once again, we see that the observed rate of warming — when we ignore the natural fluctuations in the climate system (which, along with severe weather events dominate “climate change” news) — is only about one-half of that projected by climate models at this point in the 21st Century. This fraction is consistent with the global energy budget study of Lewis & Curry (2018) which analyzed 100 years of global temperatures and ocean heat content changes, and also found that the climate system is only about 1/2 as sensitive to increasing CO2 as climate models assume.
It will be interesting to see if the new climate model assessment (CMIP6) produces warming more in line with the observations. From what I have heard so far, this appears unlikely. If history is any guide, this means the observations will continue to need adjustments to fit the models, rather than the other way around.
I present comparisons between both the UAH and RSS global lower troposphere (LT) temperature variations and LT computed from the vertical temperature profiles retrieved from the NASA AIRS instrument flying on the Aqua satellite. This follows up on the recent newsworthy announcement by NASA researchers, Recent Global Warming as Confirmed by AIRS published in Environmental Research Letters in which it was claimed the AIRS surface skin temperature retrievals validated the GISTEMP record of surface air temperatures during 2003-2017.
The data I use are the AIRS Version 6 monthly average gridpoint retrievals covering September 2002 through March 2019 (16.6 years, NASA registration required). To compute LT from the AIRS profiles I have taken into account the somewhat different vertical profiles of sensitivity in the UAH and RSS LT weighting functions, as well as the different southern extent of the “global” domains (UAH extends to 82.5 deg. S, while RSS is to 70 deg. S) in the global averages.
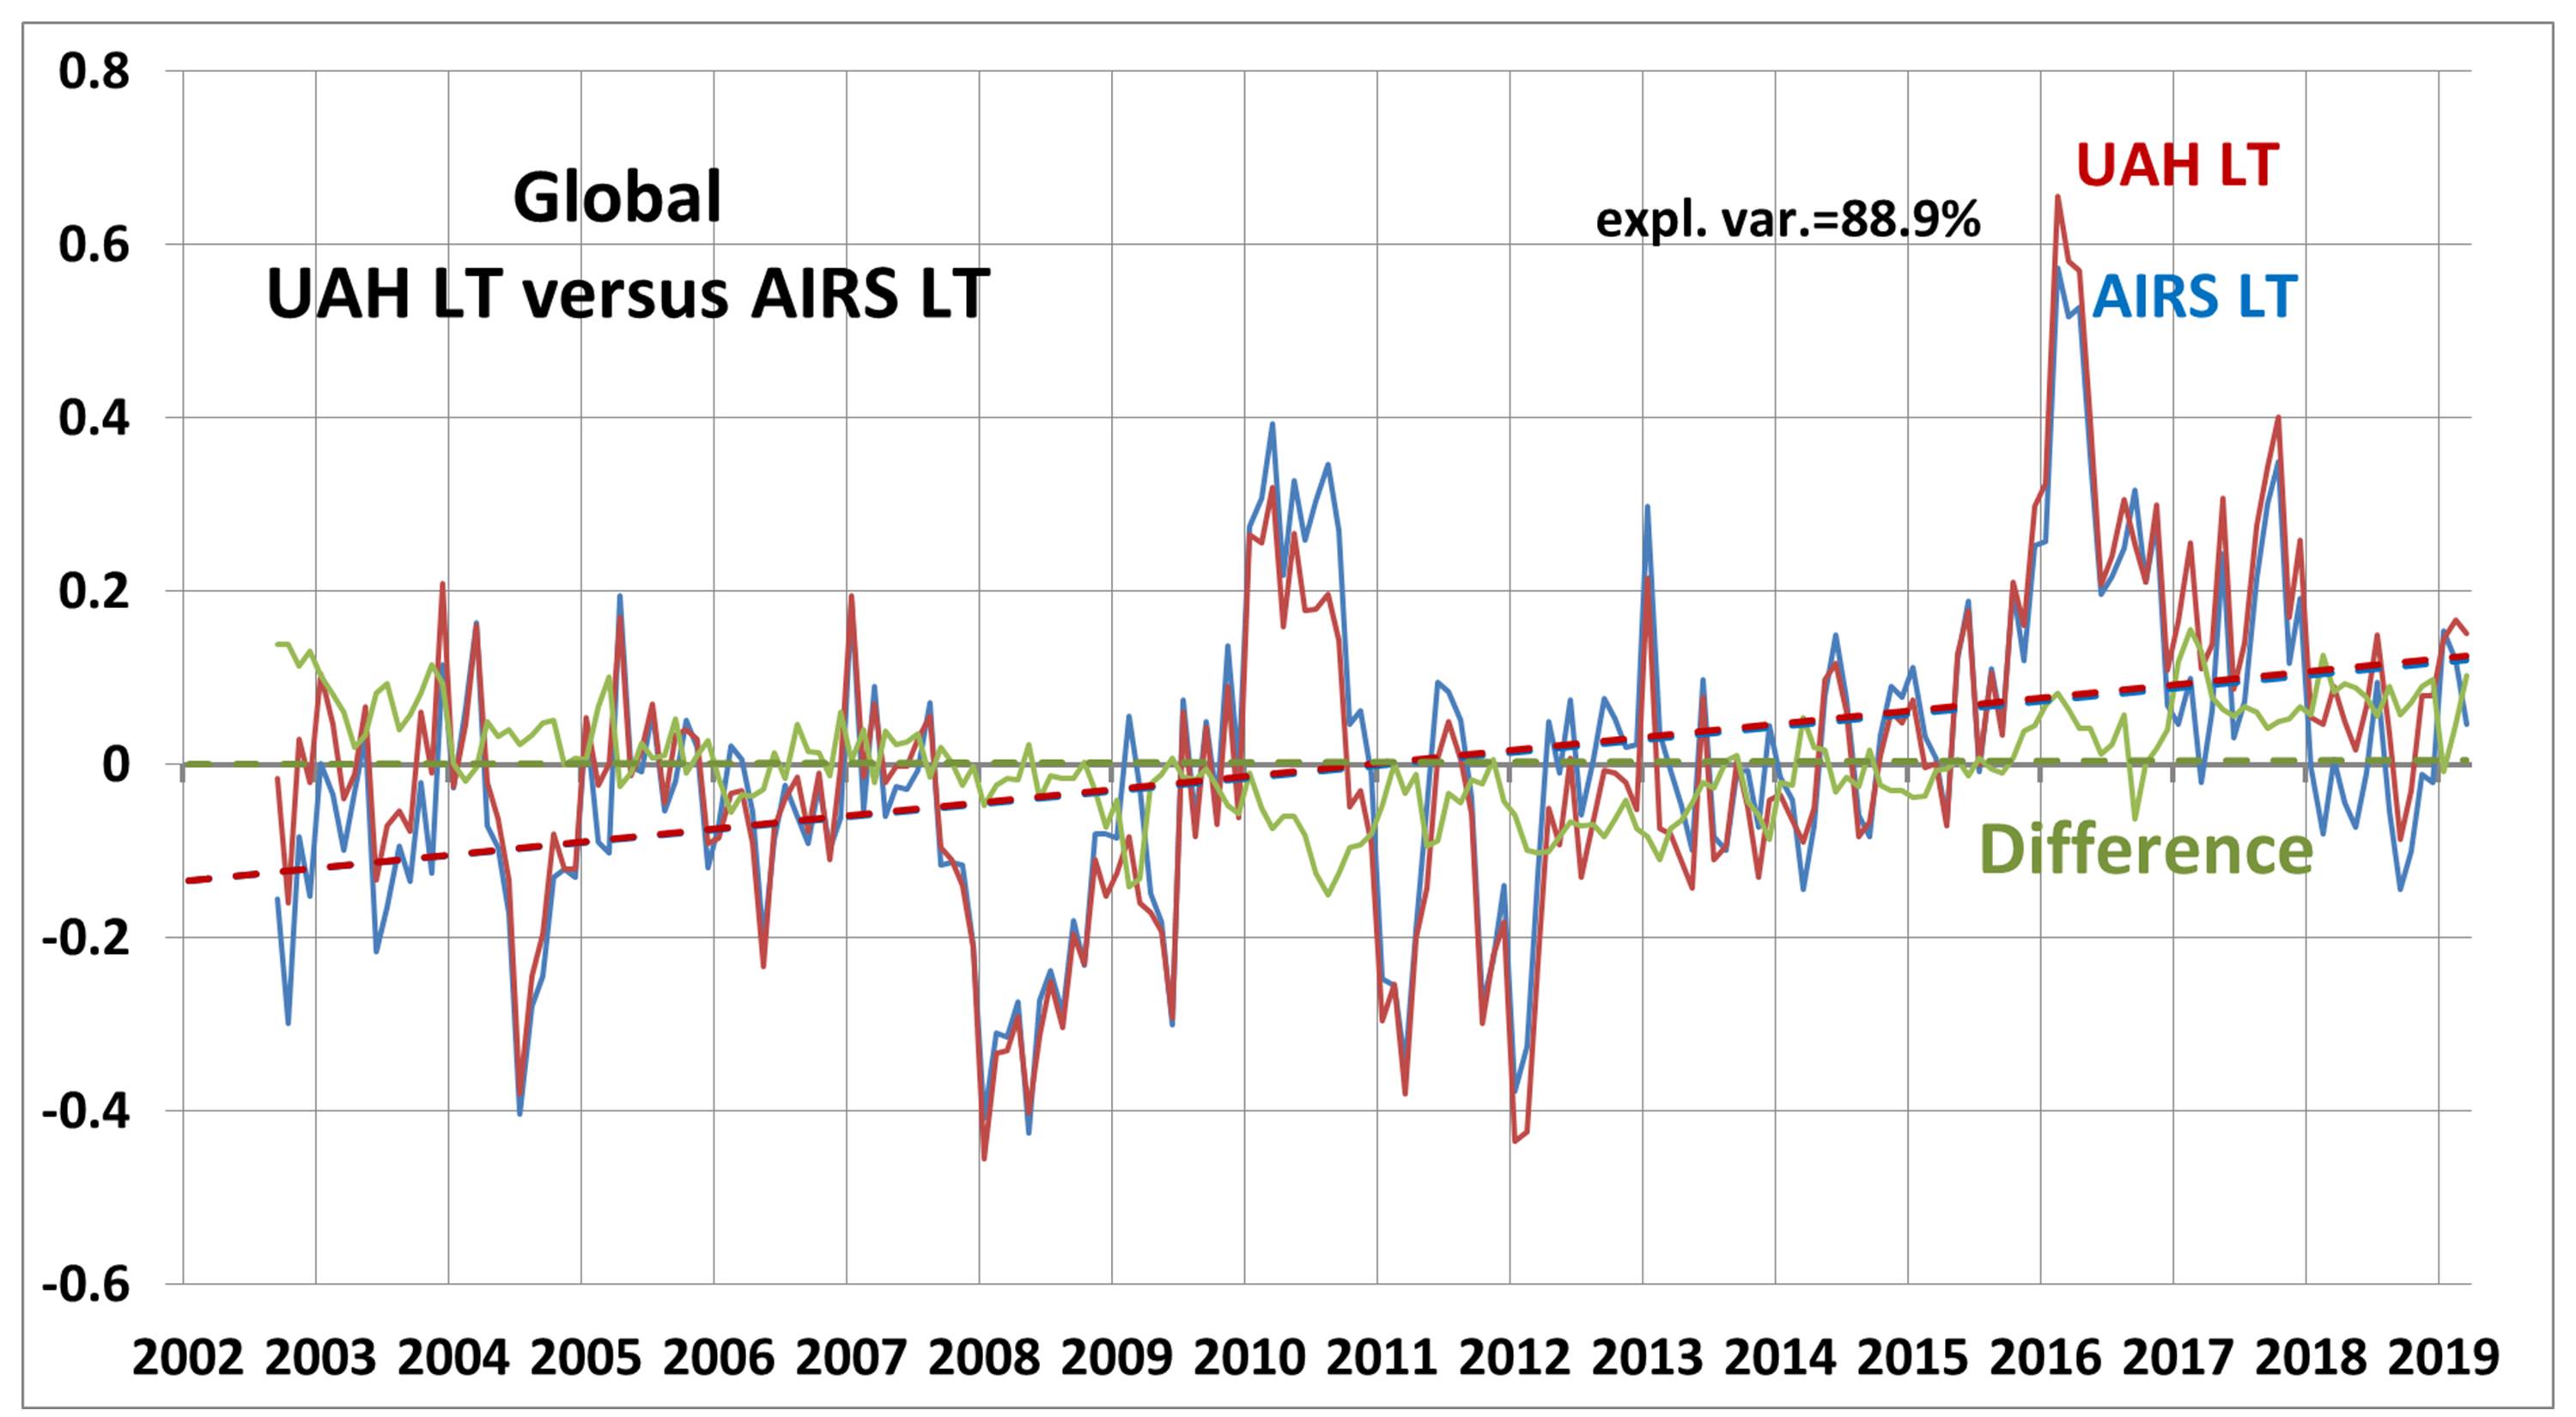
First up is the comparison of UAH LT versus LT computed from the AIRS profiles:
Fig. 1. Global (82.5N-82.5S) lower tropospheric temperature variations (deg. C) about the 2003-2018 mean annual cycle for UAH Version 6 LT and Version 6 LT computed from the NASA AIRS temperature profiles over the same region.
Note that El Nino and La Nina variations dominate this short period of record, and much of the warming trend (+0.15 C/decade) is due to this activity. The agreement is very good, with nearly identical trends in UAH and AIRS and an explained variance of 88.9%.
The agreement is rather remarkable given that the AIRS is an infrared instrument with much more serious cloud contamination effects than the UAH LT which is totally microwave-based from the Advanced Microwave Sounding Units (AMSUs) flying on 5 different satellites during this period. The AIRS cloud effects are removed in processing through a “cloud clearing” algorithm when scattered clouds are present, but temperatures in the lower troposphere cannot be measured in extensive cloud regions.
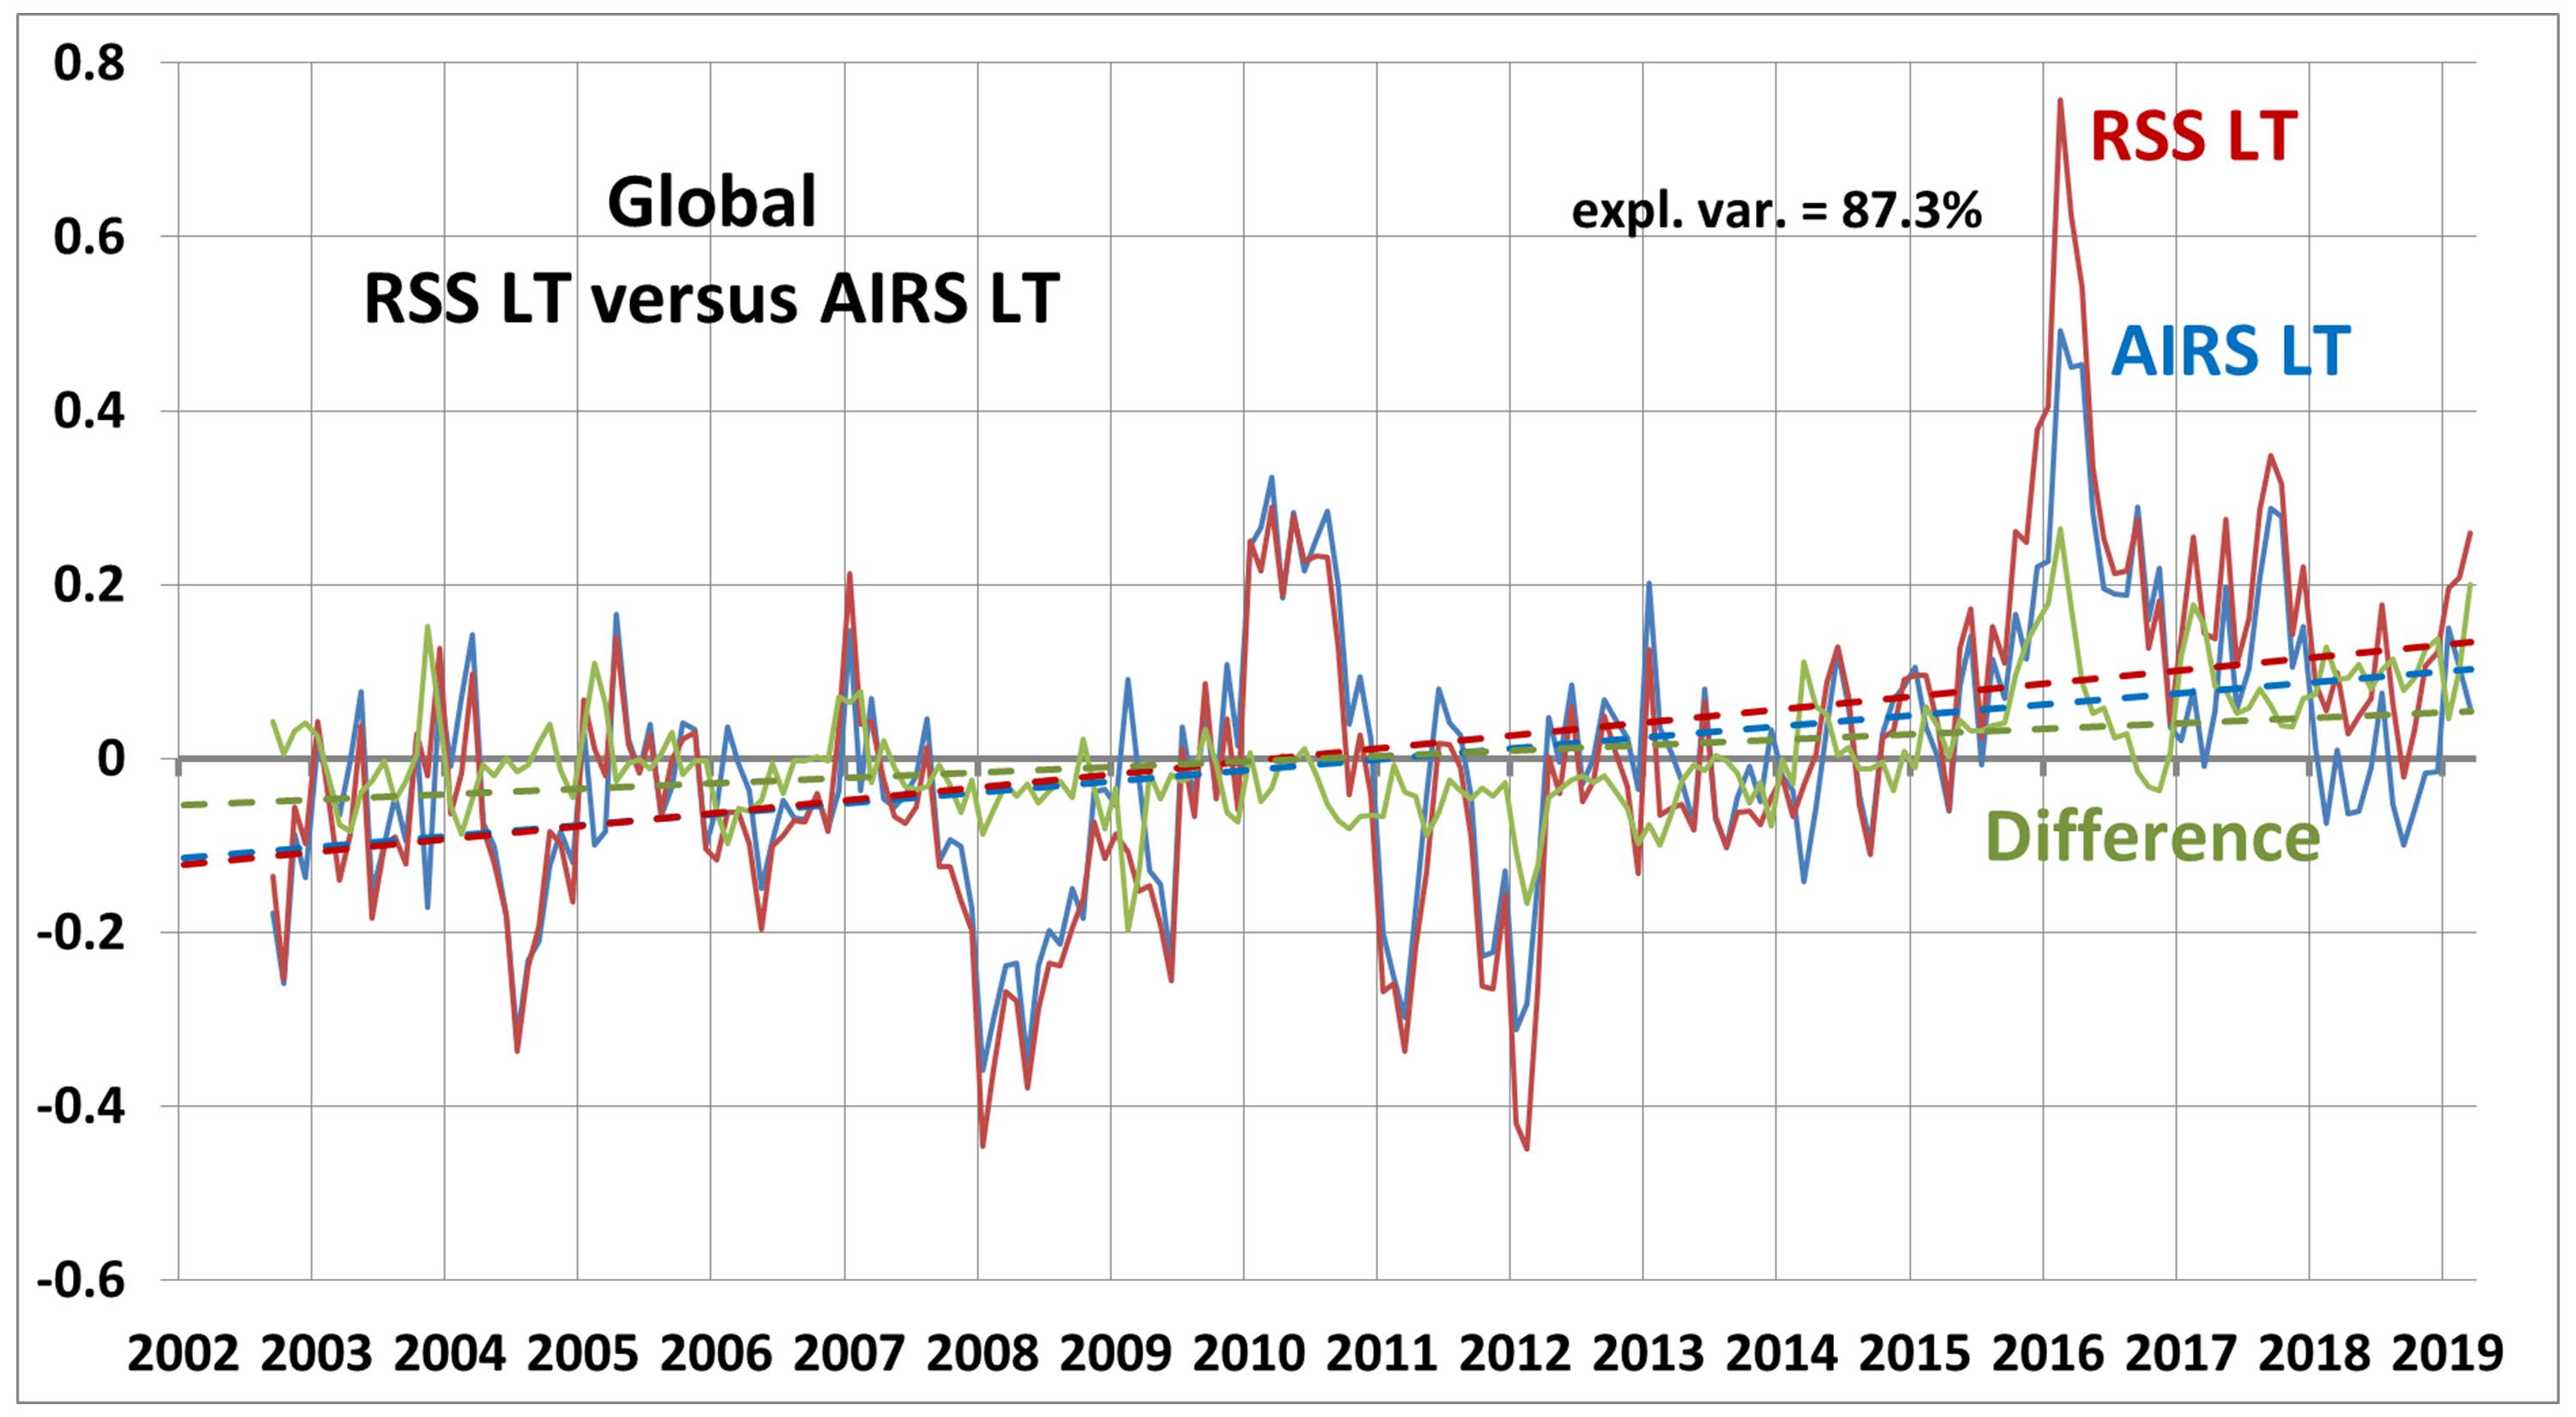
Next let’s look at a similar comparison for the RSS LT product. It also shows very good agreement with AIRS (87.3% explained variance), but with a somewhat greater trend compared to AIRS (by 0.07 C/decade). Again, the record is rather short (16.6 years) and so this trend difference should not be assumed to apply to the whole 40-year satellite record of RSS LT:
Fig. 2. Global (82.5N-70.0S) lower tropospheric temperature variations (deg. C) about the 2003-2018 mean annual cycle for RSS Version 4 LT and Version 4 LT computed from the NASA AIRS temperature profiles over the same region.
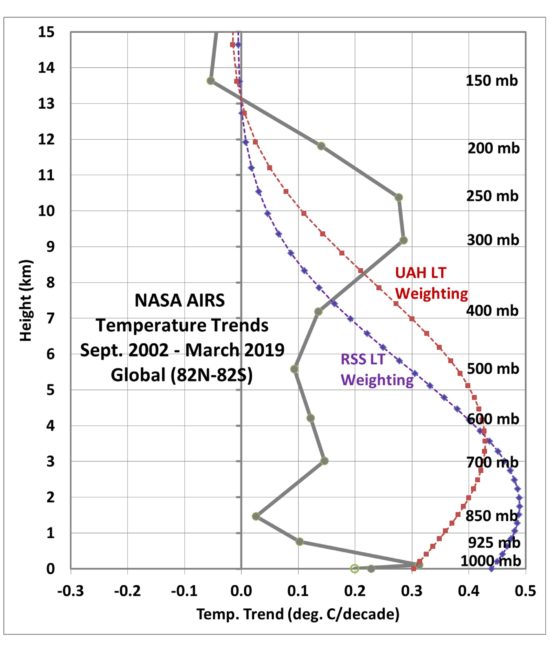
Again, the LT layers measured by UAH and RSS are somewhat different. The UAH LT layer is deeper, and so it picks up more of the enhanced warming in the 250-300 mb layer, as seen in the vertical profile of AIRS global temperature trends:
Fig. 3. AIRS global temperature trends (gray) as a function of height, during the period Sept. 2002 through March 2019. The solid point at the bottom is the surface skin temperature, while the open circle is the surface air temperature. Also shown are the different weighting profiles of the UAH and RSS “lower tropospheric” (LT) products which are applied to the AIRS temperature profile to obtain LT estimates from AIRS.
Given the rather high level of agreement between the microwave and infrared measures of global-average tropospheric temperatures, I see no reason why the AIRS data should not be used as a way to do periodic checks on the UAH and RSS LT global temperature variations.
Finally, since J. Susskind and Gavin Schmidt have proclaimed AIRS as confirming the GISTEMP record of substantial surface warming (“Recent Global Warming as Confirmed by AIRS”), I am similarly going to proclaim Fig. 1 as evidence that AIRS also validates the UAH LT record of only modest tropospheric warming.
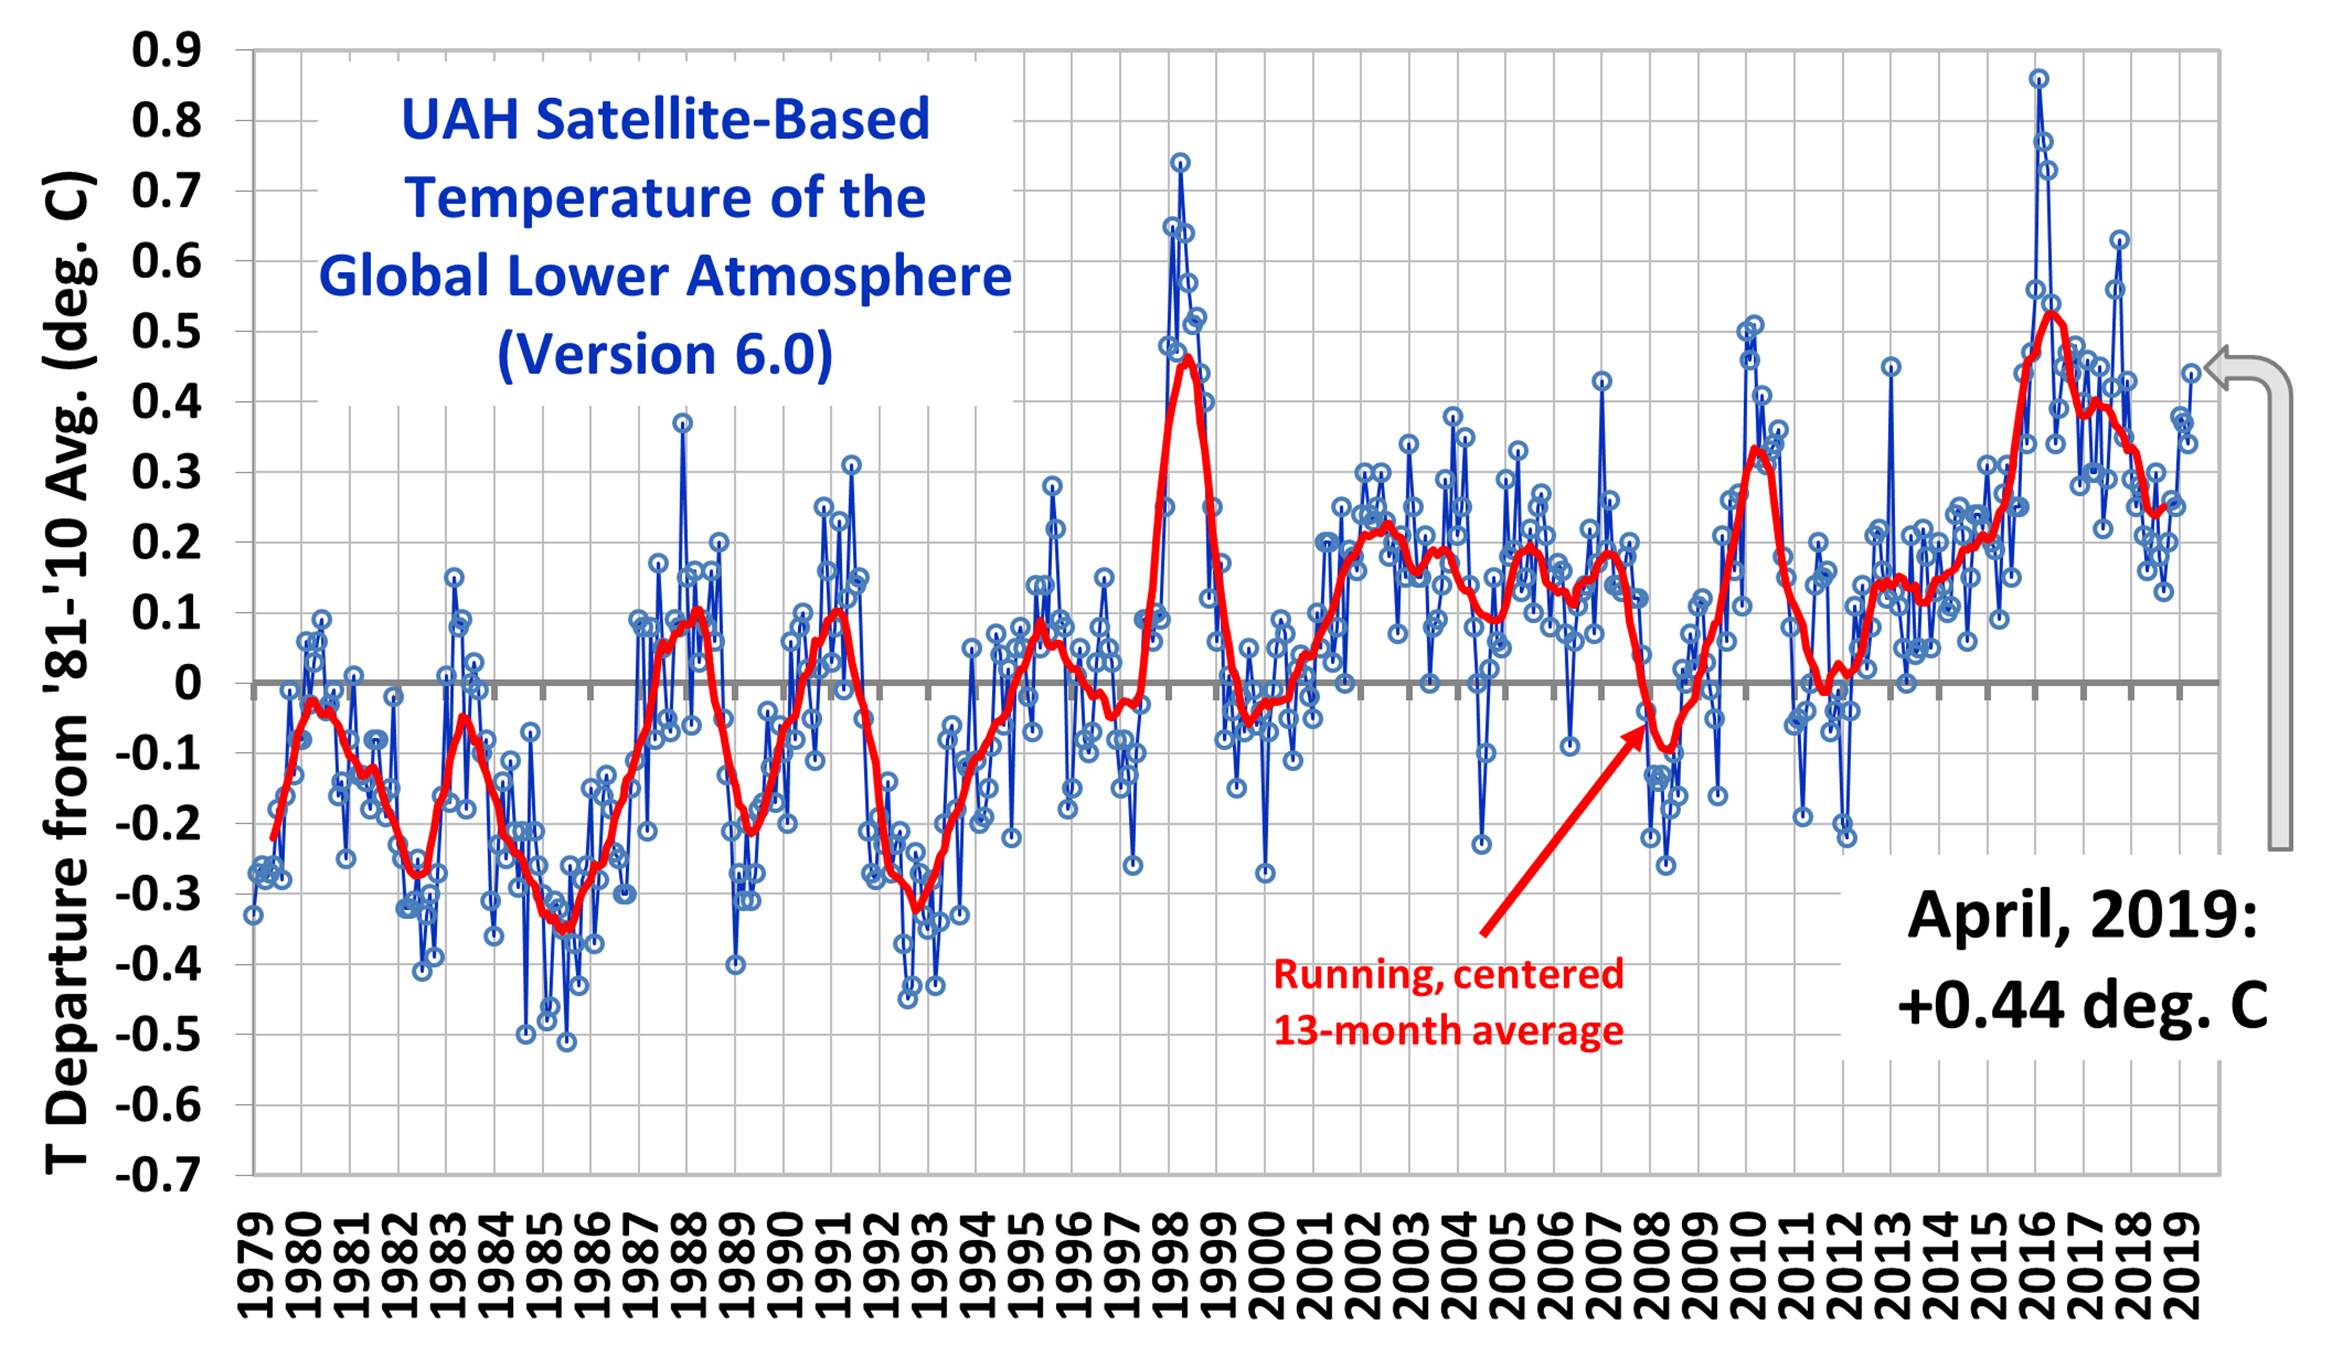
The Version 6.0 global average lower tropospheric temperature (LT) anomaly for April, 2019 was +0.44 deg. C, up from the March, 2019 value of +0.34 deg. C:
Various regional LT departures from the 30-year (1981-2010) average for the last 16 months are:

 Home/Blog