Half of 21st Century Warming Due to El Nino

May 13th, 2019 by Roy W. Spencer, Ph. D.

A major uncertainty in figuring out how much of recent warming has been human-caused is knowing how much nature has caused. The IPCC is quite sure that nature is responsible for less than half of the warming since the mid-1900s, but politicians, activists, and various green energy pundits go even further, behaving as if warming is 100% human-caused.

The fact is we really don’t understand the causes of natural climate change on the time scale of an individual lifetime, although theories abound. For example, there is plenty of evidence that the Little Ice Age was real, and so some of the warming over the last 150 years (especially prior to 1940) was natural — but how much?

The answer makes as huge difference to energy policy. If global warming is only 50% as large as is predicted by the IPCC (which would make it only 20% of the problem portrayed by the media and politicians), then the immense cost of renewable energy can be avoided until we have new cost-competitive energy technologies.

The recently published paper Recent Global Warming as Confirmed by AIRS used 15 years of infrared satellite data to obtain a rather strong global surface warming trend of +0.24 C/decade. Objections have been made to that study by me (e.g. here) and others, not the least of which is the fact that the 2003-2017 period addressed had a record warm El Nino near the end (2015-16), which means the computed warming trend over that period is not entirely human-caused warming.

If we look at the warming over the 19-year period 2000-2018, we see the record El Nino event during 2015-16 (all monthly anomalies are relative to the 2001-2017 average seasonal cycle):

Fig. 1. 21st Century global-average temperature trends (top) averaged across all CMIP5 climate models (gray), HadCRUT4 observations (green), and UAH tropospheric temperature (purple). The Multivariate ENSO Index (MEI, bottom) shows the upward trend in El Nino activity over the same period, which causes a natural enhancement of the observed warming trend.

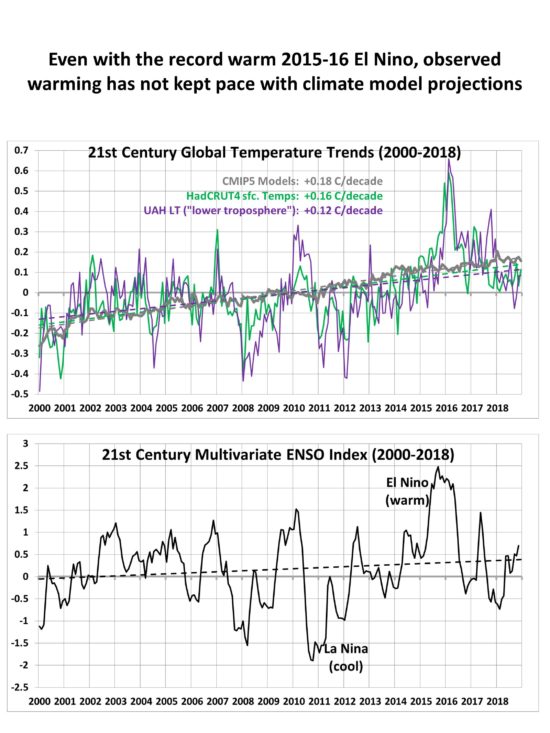
We also see that the average of all of the CMIP5 models’ surface temperature trend projections (in which natural variability in the many models is averaged out) has a warmer trend than the observations, despite the trend-enhancing effect of the 2015-16 El Nino event.

So, how much of an influence did that warm event have on the computed trends? The simplest way to address that is to use only the data before that event. To be somewhat objective about it, we can take the period over which there is no trend in El Nino (and La Nina) activity, which happens to be 2000 through June, 2015 (15.5 years):

Fig. 2. As in Fig. 1, but for the 15.5 year period 2000 to June 2015, which is the period over which there was no trend in El Nino and La Nina activity.

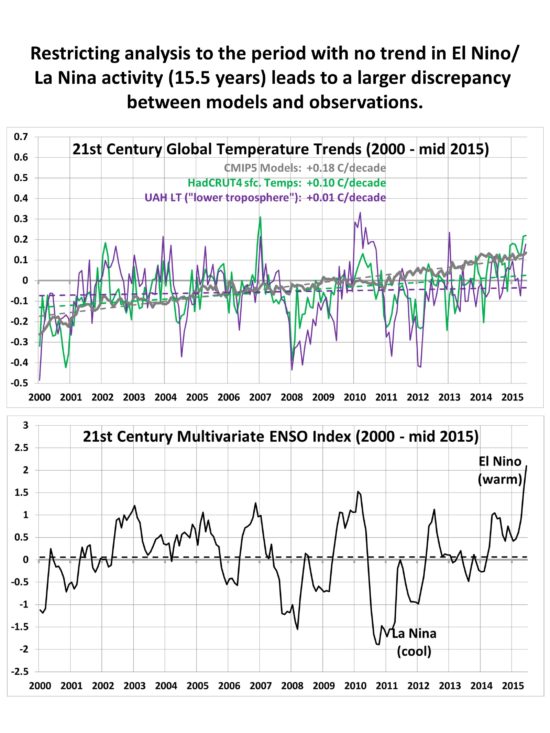
Note that the observed trend in HadCRUT4 surface temperatures is nearly cut in half compared to the CMIP5 model average warming over the same period, and the UAH tropospheric temperature trend is almost zero.

One might wonder why the UAH LT trend is so low for this period, even though in Fig. 1 it is not that far below the surface temperature observations (+0.12 C/decade versus +0.16 C/decade for the full period through 2018). So, I examined the RSS version of LT for 2000 through June 2015, which had a +0.10 C/decade trend. For a more apples-to-apples comparison, the CMIP5 surface-to-500 hPa layer average temperature averaged across all models is +0.20 C/decade, so even RSS LT (which usually has a warmer trend than UAH LT) has only one-half the warming trend as the average CMIP5 model during this period.

So, once again, we see that the observed rate of warming — when we ignore the natural fluctuations in the climate system (which, along with severe weather events dominate “climate change” news) — is only about one-half of that projected by climate models at this point in the 21st Century. This fraction is consistent with the global energy budget study of Lewis & Curry (2018) which analyzed 100 years of global temperatures and ocean heat content changes, and also found that the climate system is only about 1/2 as sensitive to increasing CO2 as climate models assume.

It will be interesting to see if the new climate model assessment (CMIP6) produces warming more in line with the observations. From what I have heard so far, this appears unlikely. If history is any guide, this means the observations will continue to need adjustments to fit the models, rather than the other way around.


1,256 Responses to “Half of 21st Century Warming Due to El Nino”

Toggle Trackbacks

  1. ren says:

    The global temperature will not increase when the temperature in the southern hemisphere decreases.
    http://www.bom.gov.au/archive/oceanography/ocean_anals/IDYOC007/IDYOC007.201905.gif
    https://www.tropicaltidbits.com/analysis/ocean/nino34.png

    • Svante says:

      And in the long term it matches the green line in fig. 3.
      https://tinyurl.com/y7c37cyh

      With volcanoes added in fig. 10 a).
      The 60 year AMO cycle is shown in fig. 10 c).
      Problems in the instrumental record are shown in fig A2.

      • Bill Hunter says:

        Svante says:
        May 13, 2019 at 11:35 PM
        “And in the long term it matches the green line in fig. 3.”

        Yep but it didn’t anytime before 1980. Might be able to make a better argument on this in say another 30 years.

        • Svante says:

          Well you already have 240 years there.

          The residual is sorted out in Ch. 3. A lot of it corresponds to the sixty year AMO cycle, which Berkeley Earth estimated at +/- 0.17 C, a swing of 0.34 C from top to bottom.

          See fig. 10.

          • Bill Hunter says:

            Svante says:
            May 14, 2019 at 11:18 PM
            “Well you already have 240 years there.”

            Yeah, just like I said. You have 210 years where it didn’t align with 60-70 year temperature cycles and now you have aligning with the warmside of one of those cycles. Big Problem! Not only do you have a model-modified temperature record to catch up with the models, but you have another 30 years to see if the 60-70 year cycles continue and go the other way like it has in the past.

            Bottom line is we should expect some correlation of atmospheric CO2 with rising temperatures and warming oceans outgas CO2.

            The temp records get adjusted. . . .why? Isn’t the science settled? If its settled then thats OK! And for the most part its the exceptional person, especially one who is struggling to compete in the climate science industry, who can actually stand up and say “The Emperor Has No Clothes”

          • Svante says:

            They analyze ENSO, AMO, volcanoes and GHGs, and there is hardly anything left to explain after that.

            Only GHGs have a trend, the others are cyclic or random.

            They verify the instrumental record against proxy data, and find only a few statistical outliers:

            Although it is premature to infer that the instrumental record may be inaccurate in the 19371945 section, it is known that particularly in the war years, much of the tropical SST estimates are restricted to U.S. Navy ships, and there is a known bias in records from this time [Kennedy et al., 2011]. This does not automatically mean that the instrumental measurements are in error, but our results might heighten interest in better understanding the way temperatures were taken in the engine rooms of the war ships, especially because all our efforts have so far failed to support very large warming in the 19431945

          • Bill Hunter says:

            Svante, you are not looking at the graphic. For 200 years the CO2 line was increasing and temperature was increasing but not following multidecadal regime changes that affected the temperature but not the CO2 line. In the past 60 years CO2 has been increasing but for the first 20 of those years the temperature remained declining from one of those multidecadal regimes. Now the emergence of likely a new multidecadal regime temperature also started moving up again and following the CO2 greenline. The question is if part of that temperature increase is due to CO2 emissions since this is the 5th time that temperature upturned, 4 times it turned up far higher than the greenline and today in the face of orders of magnitude more emissions the lines are going up at the same rate.

            So when do you figure CO2 became sensitive to multi-decadal ocean regimes or can you admit to a good deal of uncertainty regarding what has caused recent warming?

          • Svante says:

            The impact of more GHGs is logarithmic, so you need orders of magnitude more emissions to stay linear.

            The AMO can pull temperatures down by 0.35 C, so it can offset most GHG warming for thirty years. In the long run it has no impact because it is cyclic.

            CO2 is not very sensitive to multi-decadal ocean regimes, that connection has been overwhelmed by anthropogenic emissions.

            The uncertainty is +/+ 0.15 C in fig. 10.

            Temperatures would be like fig. 9 without GHG emissions.

          • Bill Hunter says:

            Svante – you explained why the temperature record regularly far exceeds the greenline and why it regularly runs far below it.

            But you didn’t explain why it stopped doing that since 1980.

            Underlying natural variations should still be forming that pattern unless the correlation of the greenline with warming is spurious.

            What is required is to wait until the cold cycle plays out and see what it looks like then. We saw the cold cycle go sideways in the 1950’s arguably because of the record solar cycle 19. In 30 years we will know if we get a cold cycle and what affect it will have.

          • Craig T says:

            “you explained why the temperature record regularly far exceeds the greenline and why it regularly runs far below it.
            But you didnt explain why it stopped doing that since 1980.”

            In figure 3 you can see temperatures responding to both “multidecadal regime change” and CO2. Until 1870 CO2 is almost flat and the rise and fall of temperatures matches the trends of figure 6. By mid – 20th century CO2 is heading upward. Temperatures rise more during natural warming trends and cool less. The temperature during the 50’s is warmer than 1880. After 1980 CO2 is rising at a faster rate and less of multidecadal trends show.

            The last two decades should have been a down turn based on figure 6 but troposphere temps went flat while ground temps kept climbing. Every decade GHE is a bigger factor in the temperature.

          • Svante says:

            Bill Hunter says:

            “But you didn’t explain why it stopped doing that since 1980.”

            If warming doesn’t slow down soon then I think feed backs are taking over.

            The AMO turned negative in 2015 according to fig. 1 this paper:
            Emerging negative Atlantic Multidecadal Oscillation index in spite of warm subtropics.

            If warming does slow down now it will come back with a vengeance in 2050.

          • Bill Hunter says:

            Svante – “If warming does slow down now it will come back with a vengeance in 2050.”

            Assuming of course that the assumptions you embrace are correct which I take to be belief in model outputs rather than observations.

            As it is Roy is showing not just with his satellite record but with all the surface temperature services that observations, even considering a warm phase of both Atlantic and Pacific ocean indexes, are under preforming.

            A slowdown would in fact make observation trends even lower than now and increasing the gap that already exists between models and observations.

            I am in Lindzen’s camp. Longterm climate modeling work should be deemphasized as its not an appropriate tool for the job at this point in time. With the modeling assumptions built on Santer’s 17 years being a bust it has been revealed that climate modeling simply isn’t going to teach us much. Split the baby in half and put half of it into enhanced weather modeling and the other half into enhanced labwork on heat transfer through gases at temperatures common to the atmosphere.

          • Bill Hunter says:

            Svante says:
            May 16, 2019 at 2:24 PM

            “If warming doesnt slow down soon then I think feed backs are taking over.

            The AMO turned negative in 2015 according to fig. 1 this paper:
            Emerging negative Atlantic Multidecadal Oscillation index in spite of warm subtropics.”

            Well Roy’s paper shows there really is no significant warming going on. Pretty rock solid stuff. I suspect what we are seeing is feedbacks since warming from any source is going to have feedbacks.

            In fact, some scientists believe we are still seeing feedbacks from the recovery of the LIA. That seems pretty certain to be true especially in light of the recent ocean study that shows portions of the Pacific Ocean are still cooling from the LIA. No surprise there since a large number of experts believe that it takes millennia for the oceans to adjust.

          • Svante says:

            What I said here has nothing to do with models, it’s just how it has been for 250 years.

            Berkeley Earth got the same result here:
            http://static.berkeleyearth.org/papers/Results-Paper-Berkeley-Earth.pdf

            In fig. 5 you have their temperature record plotted against volcanoes and ln(CO2). One third is CH4, but adding that did not improve the fit (since they go up in parallel).

            The main residual is the AMO, which is shown in fig. 6.

            You are right that the future is uncertain. In 1815 you have Tambora preceded by the mystery volcano. That could happen again but the effect will not last as you can see in the record.

          • Craig T says:

            “Svante ‘If warming does slow down now it will come back with a vengeance in 2050.’
            Assuming of course that the assumptions you embrace are correct which I take to be belief in model outputs rather than observations.”

            I can’t speak for Svante but a lot of factors cause temperatures to go up and down over a period of 15 years or less. Observations show that we’re in a warming trend on the 30 year plus scale.

          • Bill Hunter says:

            Svante – My mention of models was alluding to your prediction “If warming does slow down now it will come back with a vengeance in 2050.”

            Vengeance? or Come back like it always has?

            And I am not a fan of all the data processing and data manufacturing that all the surface temperature records go through. That is something one would be compelled to do only if they were looking for a value for absolute mean temperature of the earth. Mean anomaly would be best detected by the raw data without processing or the manufacturing of data to fit between stations. All that does is introduce opportunities for errors, biases, and gamemanship. The raw data might show an erroneous total anomaly because of a concentration of stations of a certain nature but there isn’t really anyway to improve on that problem by manufacturing data between stations and instead there is the opportunity to introduce variable sets into the computer calculations that maximizes the outcome. I understand that completely as I have experience with data systems and actually desiring to maximize certain parameters like least economic impact with largest ecological return. Its incredibly easy to reverse that into largest economic impact possible with whatever ecological return that produces. And then the whole purpose of creating new game maps is political at its core.

            A great exercise would be to take all the available temperature databases, use the same variables and assign one team to maximize them and another to minimize them in the data processing step and see what comes out. It would be fairly easy to do like with duplicate stations in different databases where the data has been adjusted by various teams. Then your main concern would be lost original data as reported by Phil Jones at UEA whose global data has been used in all the reconstructions.

          • Bill Hunter says:

            Craig T says:
            May 17, 2019 at 6:43 AM
            “I can’t speak for Svante but a lot of factors cause temperatures to go up and down over a period of 15 years or less. Observations show that we’re in a warming trend on the 30 year plus scale.”

            I don’t disagree but would add that there are two well known cycles that last a lot longer than 30 years. The PDO and AMO. These appear to operate on a 66 to 72 year scale and are related to the original sources (embraced by the likes of Benjamin Franklin) of the 2 Farmer’s Almanacs. NOAA recognized the necessity for longterm smoothing of temperature data 60 years plus before endorsing global warming and had a website up showing the correlation to solar activity with 60 year smoothing to take out shorter term rises and falls.

            So I agree with you and fully endorse at least an 80 year cycle to encompass most of the alternative theories and recognize that may be way too short also as it has been over a 100 years since solar activity was so low as today. I endorse the comments of solar scientists that the current cycle the sun is going through will teach us something. Allowing for feedbacks one has to be very patient in coming to conclusions about the effects of current solar activity on the climate. Ten to twelve years for above the thermocline effects with ice effects on albedo perhaps taking a century or more and deep ocean affects perhaps a millennia. It is abundantly clear to anybody with an open mind that there has been a lessening of the warming trend. Looking at the dominant mid-length cycle, a sine wave for a 72 year cycle you have sequentially 18 years of warming, 18 years of flat warm temperatures, 18 years of cooling temperatures, and 18 years of flat cool temperatures. Of course climate is not a perfect sine wave with a lot of short term influences as you have noted in addition to a lack of understanding of the basic mechanisms of these mid range termed cycles. Emeritus Director Professor Dr. Syun Akasofu pointed out that a LIA recovery could entail hundreds of years. So if things are really dire. . . .what we should expect is an acceleration in warming rather than the deceleration we have been seeing and more deceleration may be just beyond the horizon. But the one thing you can absolutely guarantee is that the advocates of dangerous warming will be endorsing whatever cycle they can find at least 17 years long that gives the greatest amount of warming and completely ignore the timing of shorter term changes within that as demonstrated very clearly in the post we are replying to. What the sane mind needs to do is cut through the BS. Not doing so only proves you are stupid or corrupt. And I don’t mean corrupt as in criminal I mean corrupt as in honesty.

          • Svante says:

            My mention of models was alluding to your prediction “If warming does slow down now it will come back with a vengeance in 2050.”

            It is not a model, it what we have had for 240 years.

            Vengeance? or Come back like it always has?

            First you have GHG-AMO, then you have GHGs+AMO.
            The AMO does not matter in the long run because the ‘O’ means oscillation.
            CO2 wins because it is long term.

            And I am not a fan of all the data processing and data manufacturing that all the surface temperature records go through. That is something one would be compelled to do only if they were looking for a value for absolute mean temperature of the earth. Mean anomaly would be best detected by the raw data without processing or the manufacturing of data to fit between stations. All that does is introduce opportunities for errors, biases, and gamemanship. The raw data might show an erroneous total anomaly because of a concentration of stations of a certain nature but there isn’t really anyway to improve on that problem by manufacturing data between stations and instead there is the opportunity to introduce variable sets into the computer calculations that maximizes the outcome. I understand that completely as I have experience with data systems and actually desiring to maximize certain parameters like least economic impact with largest ecological return. Its incredibly easy to reverse that into largest economic impact possible with whatever ecological return that produces. And then the whole purpose of creating new game maps is political at its core.

            The first paper verifies the instrumental temperature record against proxies.
            They paint the same picture.

            A great exercise would be to take all the available temperature databases, use the same variables and assign one team to maximize them and another to minimize them in the data processing step and see what comes out. It would be fairly easy to do like with duplicate stations in different databases where the data has been adjusted by various teams. Then your main concern would be lost original data as reported by Phil Jones at UEA whose global data has been used in all the reconstructions.

            Phil Jones threw out bad data.
            Berkeley Earth had a brilliant statistical method that uses virtually all data without manual bias.
            The result was the same, so Phil Jones did a good job.

            I don’t disagree but would add that there are two well known cycles that last a lot longer than 30 years. The PDO and AMO. These appear to operate on a 66 to 72 year scale and are related to the original sources (embraced by the likes of Benjamin Franklin) of the 2 Farmer’s Almanacs. NOAA recognized the necessity for longterm smoothing of temperature data 60 years plus before endorsing global warming and had a website up showing the correlation to solar activity with 60 year smoothing to take out shorter term rises and falls.

            Why do you say this again? You saw exactly what the AMO did in the two papers.
            The PDO was not needed, so it’s impact is either small or synchronized with the AMO.
            The BEST method:
            https://tinyurl.com/h5z2vkx

            So I agree with you and fully endorse at least an 80 year cycle to encompass most of the alternative theories and recognize that may be way too short also as it has been over a 100 years since solar activity was so low as today. I endorse the comments of solar scientists that the current cycle the sun is going through will teach us something.

            In the BEST paper you read that adding solar did not improve the fit.
            Stands to reason because the solar forcing is an order of magnitude less than the GHG forcing.

            Allowing for feedbacks one has to be very patient in coming to conclusions about the effects of current solar activity on the climate. Ten to twelve years for above the thermocline effects with ice effects on albedo perhaps taking a century or more and deep ocean affects perhaps a millennia. It is abundantly clear to anybody with an open mind that there has been a lessening of the warming trend. Looking at the dominant mid-length cycle, a sine wave for a 72 year cycle you have sequentially 18 years of warming, 18 years of flat warm temperatures, 18 years of cooling temperatures, and 18 years of flat cool temperatures.

            That would be the AMO.

            Of course climate is not a perfect sine wave with a lot of short term influences as you have noted in addition to a lack of understanding of the basic mechanisms of these mid range termed cycles. Emeritus Director Professor Dr. Syun Akasofu pointed out that a LIA recovery could entail hundreds of years. So if things are really dire. . . .what we should expect is an acceleration in warming rather than the deceleration we have been seeing and more deceleration may be just beyond the horizon. But the one thing you can absolutely guarantee is that the advocates of dangerous warming will be endorsing whatever cycle they can find at least 17 years long that gives the greatest amount of warming and completely ignore the timing of shorter term changes within that as demonstrated very clearly in the post we are replying to. What the sane mind needs to do is cut through the BS. Not doing so only proves you are stupid or corrupt. And I don’t mean corrupt as in criminal I mean corrupt as in honesty.

            Yes, cut through the BS, this is not a LIA recovery:
            http://railsback.org/FQS/FQS22katoFutureTemps03.jpg

          • Bill Hunter says:

            Svante – Yes, cut through the BS, this is not a LIA recovery:

            So you say. Marcott 2013 is far from the only estimate of historic temperatures.

            Further, as I understand it, Marcott is just another hockey stick construction created by pasting high resolution thermometer record on the end of low resolution long period time series.

            Here is a corrected Marcott that puts the instrument record on the same resolution as Marcott’s choice of long term proxies. http://i90.photobucket.com/albums/k247/dhm1353/Marcott6_zps514231d3.png

            https://wattsupwiththat.com/2013/03/11/a-simple-test-of-marcott-et-al-2013/

            So to put it another way Marcott is right if and only if the models are correct, the current surface temperature, used by Marcott, is correctly adjusted, and that all the warming we have seen in the past 70 years is due to human CO2 emissions. If you buy that I have a bridge for sale you might be interested in.

          • Bill Hunter says:

            Svante says:
            May 18, 2019 at 3:17 AM
            My mention of models was alluding to your prediction “If warming does slow down now it will come back with a vengeance in 2050.”

            It is not a model, it what we have had for 240 years.

            OK its not a model but 240 years of the past doesn’t tell us what is going to happen in the future. So we are left with nothing to support your prediction.

            Svante says:
            “The first paper verifies the instrumental temperature record against proxies.
            They paint the same picture.”
            First paper where?

            Svante says:
            “Phil Jones threw out bad data.
            Berkeley Earth had a brilliant statistical method that uses virtually all data without manual bias.
            The result was the same, so Phil Jones did a good job.”

            Steve McIntyre spent a couple of years or so trying to get the raw data that Phil Jones wouldn’t give him because Jones said McIntyre might find something wrong with it. Finally the court ordered him to give McIntyre the data and Jones claimed he lost it. If he lost it Berkeley Earth had to of used Jones processed data if they used any Jones data at all. And getting the same result isn’t exactly a difficult thing to do if you know how everybody else processed the data, or you used the processed data.

            I don’t disagree but would add that there are two well known cycles that last a lot longer than 30 years. The PDO and AMO. These appear to operate on a 66 to 72 year scale and are related to the original sources (embraced by the likes of Benjamin Franklin) of the 2 Farmer’s Almanacs. NOAA recognized the necessity for longterm smoothing of temperature data 60 years plus before endorsing global warming and had a website up showing the correlation to solar activity with 60 year smoothing to take out shorter term rises and falls.

            Svante says:
            “Why do you say this again? You saw exactly what the AMO did in the two papers.
            The PDO was not needed, so it’s impact is either small or synchronized with the AMO.
            The BEST method:
            https://tinyurl.com/h5z2vkx

            The PDO is a strong fit and a far larger reservoir of heat. Oceans manifest themselves in weather and climate in many ways. Ocean current shifts are likely the cause of the PDO and AMO. What drives those shifts are largely unknown. But it doesn’t take much to make rivers run in the oceans. The predominant currents in the ocean are driven by a slight Coriolis Effect. Small solar variation could significantly affect the major convection loops providing forces that shift currents that are significant enough to show up in the global mean temperature record. None of these ideas are controversial its understanding exactly how they operate is the challenge and thats a huge challenge.

            Svante says:
            “In the BEST paper you read that adding solar did not improve the fit.
            Stands to reason because the solar forcing is an order of magnitude less than the GHG forcing.”

            You are just buying into an argument designed to influence the ignorant. Several things wrong with that. The Coriolis Effect is extremely small but it moves entire oceans. Other magnetic effects between the Sun and Earth could have completely unknown effects. Frequency variation of solar output could have effects on evaporation. And those same variations are tagged as the root cause of the Svensmark Theory which is a theory of cloud change resulting from every small changes in total solar forcing much like the Coriolis Effect results in huge effects on the ocean from a very small force. We are talking about mixing unmixed gases in the atmosphere and mixing waters of the ocean. If you ever stirred and exotic alcoholic beverage with various colored additives you should know intuitively how chaotic that can appear.

            Svante says:

            “That would be the AMO.” And the PDO.

          • Svante says:

            https://en.wikipedia.org/wiki/Pacific_decadal_oscillation:
            “the west Pacific becomes cooler and part of the eastern ocean warms; during a ‘cool’ or ‘negative’ phase, the opposite pattern occurs.”

            That means it has little influence on global temperature, as the first paper showed.

            First paper where?

            The paper you read first, where the instrumental record is compared to proxies:
            https://tinyurl.com/y7c37cyh

            Svensmark had an interesting theory, the paper shows it has little explanatory power.

            Bill Hunter says:
            Further, as I understand it, Marcott is just another hockey stick construction created by pasting high resolution thermometer record on the end of low resolution long period time series.

            No, no thermometers, but others have added them. The first paper fills that gap.
            Marcott is based on 73 different studies using Boreholes, Diatom MAT, Foram MAT, Foram transfer function, Ice Core δ18O, δD, MBT, Mg/Ca, Pollen MAT, Radiolaria transfer function, Chironomid transfer function, TEX86, UK’37.

            Here is a corrected Marcott that puts the instrument record on the same resolution as Marcott’s choice of long term proxies. http://i90.photobucket.com/albums/k247/dhm1353/Marcott6_zps514231d3.png
            https://wattsupwiththat.com/2013/03/11/a-simple-test-of-marcott-et-al-2013/

            Grant’s pass is not global, and will be affected by the PDO.
            Yes, the Marcott resolution is low, but I find it unlikely that an excursion of the current magnitude would leave no trace.
            The accompanying CO2 excursion would be found because it lasts for millenia.

            So to put it another way Marcott is right if and only if the models are correct, the current surface temperature, used by Marcott, is correctly adjusted, and that all the warming we have seen in the past 70 years is due to human CO2 emissions. If you buy that I have a bridge for sale you might be interested in.

            No, Marcott is right if the majority of the proxies are right.

            OK its not a model but 240 years of the past doesn’t tell us what is going to happen in the future. So we are left with nothing to support your prediction.

            Salvatore thinks it will change next month, how likely is that when it has been going on for 240 years?

            Steve McIntyre spent a couple of years or so trying to get the raw data that Phil Jones wouldn’t give him because Jones said McIntyre might find something wrong with it. Finally the court ordered him to give McIntyre the data and Jones claimed he lost it. If he lost it Berkeley Earth had to of used Jones processed data if they used any Jones data at all. And getting the same result isn’t exactly a difficult thing to do if you know how everybody else processed the data, or you used the processed data.

            Jones asked people to get the data themselves, and Berkeley Earth did:
            http://berkeleyearth.org/about-data-set/

          • Bill Hunter says:

            Svante says:
            May 20, 2019 at 4:17 PM
            “the west Pacific becomes cooler and part of the eastern ocean warms; during a cool or negative phase, the opposite pattern occurs. That means it has little influence on global temperature, as the first paper showed.”

            That is an ill considered conclusion.

            As I just stated in another comment above, having warm water in the western Pacific could put a lot of moisture in the air that would drift across the entire Pacific before being dumped at the North American coastal mountain ranges vs a much shorter route if that process is in the eastern Pacific.

            Bottom line is internal variation from ocean current patterns can change global mean surface temperatures via both the greenhouse effect and the effect of clouds on albedo. There is no rule that global mean temperature can only occur either externally or via variation in CO2 or by Atlantic ocean overturning.

            “Yes, the Marcott resolution is low, but I find it unlikely that an excursion of the current magnitude would leave no trace.
            The accompanying CO2 excursion would be found because it lasts for millenia.”

            Well I am not attributing the CO2 excursion to purely natural causes like some do. However, there is a pretty significant seasonal effect in the CO2 data. Again ocean processes are important. There is an immediate effect of the warming of ocean surfaces within the mixing zone. Mixing zones in the ocean have multiple processes. You have convection from the thermocline to the surface from variation of sunlight shining on the oceans. Fully compensating this zone with the very small wattage inputs that reach to 150meters have been estimated to take around 10 years. Then there is the upper mixing zone affected by wind and swells. That extends perhaps 35 meters into the ocean max.

            Average residency of CO2 in the atmosphere has been estimated at around 5 to 7 years or something like that. But thats just the CO2 moving back and forth between plants and the surface mixing zones of the ocean into and out of the atmosphere on a seasonal basis. The millennial claim is related to how long the ocean bottoms take to warm or cool.

          • Svante says:

            As I just stated in another comment above, having warm water in the western Pacific could put a lot of moisture in the air that would drift across the entire Pacific before being dumped at the North American coastal mountain ranges vs a much shorter route if that process is in the eastern Pacific.

            Yes it could, but it didn’t have much effect globally, read the papers.

            Bottom line is internal variation from ocean current patterns can change global mean surface temperatures via both the greenhouse effect and the effect of clouds on albedo. There is no rule that global mean temperature can only occur either externally or via variation in CO2 or by Atlantic ocean overturning.

            Yes it could, but it didn’t, read the papers.

            Well I am not attributing the CO2 excursion to purely natural causes like some do. However, there is a pretty significant seasonal effect in the CO2 data. Again ocean processes are important. There is an immediate effect of the warming of ocean surfaces within the mixing zone. Mixing zones in the ocean have multiple processes. You have convection from the thermocline to the surface from variation of sunlight shining on the oceans. Fully compensating this zone with the very small wattage inputs that reach to 150meters have been estimated to take around 10 years. Then there is the upper mixing zone affected by wind and swells. That extends perhaps 35 meters into the ocean max.

            Yes, I was talking long term. The seasonal variation is due to the northern hemisphere growing season.
            I do suspect ocean overturning explains the CO2 pause at the beginning of the hiatus 1940-1970, but I haven’t seen any science on that.

            Average residency of CO2 in the atmosphere has been estimated at around 5 to 7 years or something like that. But thats just the CO2 moving back and forth between plants and the surface mixing zones of the ocean into and out of the atmosphere on a seasonal basis. The millennial claim is related to how long the ocean bottoms take to warm or cool.

            Yes, or ocean mixing rather.

            There are of course many other factors, it’s just that they don’t explain the long term trend, e.g.:
            Aerosols (direct and indirect), Black Carbon, Ozone, Stratospheric H2O, Land Use, Snow Albedo, Solar Intensity.

          • Bill Hunter says:

            Svante says: “Yes it could, but it didnt, read the papers.”

            Read what papers? Can’t you do better than that and simply say why you don’t think the PDO has an effect on global temperatures?

            Svante says: “There are of course many other factors, its just that they dont explain the long term trend, e.g.:”

            The longterm warming of the ocean bottoms in a recovery from the LIA can explain the longterm trend.

            The projected warming for a millenium after we stop adding CO2 is the same kind of feedback that you will see no matter what forcing warms the atmosphere (at least beyond a few thousand ocean bottom volcanoes going off at the same time).

            Such a result occurs with climate change from any source and continues to be an influence as long as the oscillation (if its an oscillation) is still in phase 1 or 2 (rising, high and flat) and will forestall observed cooling in phase 3 until phase 3 cooling can overpower the delayed warming.

            So if after 320 years of delayed warming from the recovery from the bottom of the LIA in the late 17th century the question today is how much is that delayed warming contributing to the 130 year warming trend seen since 1878 of approximately .07deg/decade and how much is being contributed by CO2?

          • Svante says:

            Bill Hunter says:

            Read what papers?

            [1] Recent global temperature ‘plateau’ in the context of a new proxy reconstruction.
            [2] A New Estimate of the Average Earth Surface Land Temperature Spanning 1753 to 2011.

            Cant you do better than that and simply say why you dont think the PDO has an effect on global temperatures?

            Yes, https://en.wikipedia.org/wiki/Pacific_decadal_oscillation:
            During a “warm”, or “positive”, phase, the west Pacific becomes cooler and part of the eastern ocean warms.
            During a “cool” or “negative” phase, the opposite pattern occurs.

            The PDO has a warm side and a cold side at the same time, so the global net is in between, i.e. small.
            Furthermore it is an oscillation, that means the long term net is zero.
            Lastly, residuals are small in ref. [1] and [2], so the PDO has little influence.

            The longterm warming of the ocean bottoms in a recovery from the LIA can explain the longterm trend.
            The projected warming for a millenium after we stop adding CO2 is the same kind of feedback that you will see no matter what forcing warms the atmosphere (at least beyond a few thousand ocean bottom volcanoes going off at the same time).

            Such a result occurs with climate change from any source and continues to be an influence as long as the oscillation (if its an oscillation) is still in phase 1 or 2 (rising, high and flat) and will forestall observed cooling in phase 3 until phase 3 cooling can overpower the delayed warming.

            So if after 320 years of delayed warming from the recovery from the bottom of the LIA in the late 17th century the question today is how much is that delayed warming contributing to the 130 year warming trend seen since 1878 of approximately .07deg/decade and how much is being contributed by CO2?

            Some recovery! How can a recovery over shoot like this:
            Holocene variation in atmospheric CO2 and global temperature.

            If it was a return to a previous equilibrium it would slow down as the difference is closed.
            This one sped up after it exceeded the previous high.
            Oceans are warming too, so they are not the source.
            Volcanic input is orders of magnitude too small.

            In physics warming has a reason, ref. [1] and [2] explain the warming without this mysterious force, the residual is small.

          • bill hunter says:

            Craig T says:
            May 22, 2019 at 6:02 AM
            The difference between scientists and Nostradamus is how the predictions are made. Technically scientists make hypotheses that test theories.

            Then are climate scientists scientists? If so kindly provide a citation to the test that proves CO2 warms the surface with a pre-feedback sensitivity of 1 deg C per doubling.

            Nope can’t do that? The main difference between todays scientists and astrologists is they have computers to handle a lot more data but that isn’t necessarily a help if your theory is hogwash.

          • Bill Hunter says:

            Svante – There must literally thousands of temperature reconstructions. The one thing they all have in common are error bars that extend from no warming to a lot of warming. Since the LIA can be verified by such things as recorded dates of ice breakups, freeze overs, crop failures, ice skating on the Thames, and literally thousands of examples of such we know warming occurred but are unsure as to when. Thermometers in the UK suggest a lot of warming in the early 18th century, followed by a lot of cooling then warming again in the second half of the 19th century.

            I am rather keen on a theory floating around NOAA for a long time of magnetic changes in the earth sun relationship that steers ocean currents. That along with identification of a possible solar oscillations at 11 year and 88 year periods (if they are not just randomly created as the 88 year period is roughly in time with the orbit of the largest planet in the solar system Jupiter) Magnetic and/or cosmic ray disturbances could account for the gentle long term warming trend we have seen of .7degC/century over the course of the last 130 years. Yes, take shorter periods and you can find a lot more warming and a lot less and even cooling. My guess is about the time we get a handle on the 88 year cycle if it exists will probably be about the time we get slammed with something a lot longer than comes right out of the dark. My view is allow the human race to decide these things individually. A bit more warming is almost certain to be a net good thing. the naysayers have a far lousier track record. And if you really want to botch it up give the job to the government. . . .especially a world government that would be controlled by the representatives of the people in the world who don’t have a vote.

          • Svante says:

            Which paragraphs did you like the best in the two papers?

          • Svante says:

            You didn’t read them, did you?

            Because it’s all about a world government conspiracy trying to control you.

          • Bill Hunter says:

            I read those things years ago. I am not going to reread them to pick out my favorite paragraph.

            Look I will give you a rough version of my take on the temperature records in summary form.

            UAH – A temperature record that for some periods of time have almost identical warming rates to the surface records. A representative sampling. Probably good estimates on satellite drift and the effects on the instruments as that is a day and night easier job than second guessing 10’s of thousands of daily station manager thermometer reads. A single adjustment that treats all the data evenly that if wrong and too low now would push historic trends higher than the surface records when they were performing the way the climate alarmists wanted them to perform. OK so maybe they still have boo boos in their system. But they pass almost all the quality checks.

            Surface records in general – Gee when the pause came and old versions of their station choices, station rejects, and their old quality checks are now suspect. . . .what do they do? They make almost 100% warming adjustments. They change the area of the globe by adding the poles which they determined years ago they needed to eliminate because of insufficient data but now are aware of rapid warming connected to the loss of ice in the arctic ocean there and need it as a pause buster.

            So they pull out climate models and run backwards calculations for what the temperatures were before they had adequate stations to estimate historic temperatures. They have rendered the surface records as really not being reliable for validating the models, not completely but to some lesser but unquantified amount. And of course their network is NOT representative. Was not designed randomly established nor with any for consistency of coverage. So they pass hardly none of the quality checks. Or in the words of Kevin Trenberth a travesty indicating our monitoring systems are in need of replacement!

            Ultimately though I accept the general temperature patterns and their error bars and all the various points of view on historic temperatures knowing that most of the time the stuff I mention above is an indicator of bias but often what effects that bias adds up to is very difficult to detect.

            So rather than go on forums and say one temperature record is correct and all others are wrong is not in my nature, but I have noted that nature a lot here among the other posters.

            I even like James Hansen. His honesty is refreshing and he doesn’t try to cover up what he is doing, for example, changing homogenization algorithms to get the temperature trends he wants out of the data. Hansen will tell you what he did and tell you why too. . . .he is sure CO2 has X forcing.

            Some one just posted a Hansen prediction and its a steep redline of temperature increases to 1400ppm and a corresponding temperature curve that takes off from the current record like a hockey stick blade. At least when Ben Santer did it he had the first 17 years of the warmest temperature increases already in the bag. Near as I can tell from the graph, Hansen doesn’t have a day yet. Hansen is so passionate he doesn’t even think about dressing it up. Its just BLAT its out there. As I say I like the guy. I am sure David Appell is already perusing Hansen’s prediction and going “what great science”.

            The object of uncertain science is to get a lot of opinions. The fact that people invest huge amounts of time and effort and want recognition for a winning ideas supplies tons of passion.

            But folks need to just get off their hobby horses and step back and look at the range of estimates. They also need to read deeply into work that actually purports to explain how the greenhouse effect works. To this auditor its a lot like a soup sandwich, all over the place.

            I actually think climate science is actually trying to understand the climate. Its a lot better than the IPCC at that which isn’t a science process at all. Its premature to go for grandiose treaties and only unsubstantiated soapbox doomsday rhetoric is saying we should. What the US needs to concentrate on is keeping its people employed building stuff you don’t have to subsidize and doing R&D on the rest to get it competitive.

            The amount of human progress over the past 100 years is astounding, thats the answer to any of our problems. The free enterprise machine is the greatest machine known to man. It has to be wisely regulated but we shouldn’t sell it out.

            A wealthy population will pay a lot extra if they see a benefit in it. Politicians and activists need to learn how to do that. And it isn’t pursuing pipe dreams and making choices from your living room sofa in front of the TV. Its a lot of hardwork of understanding what is and what is speculative. The precise job of a skeptical auditor.

          • Svante says:

            Now you sound quite reasonable.

            Roy recently said that AIRS is consistent with UAH.
            Another paper showed AIRS consistent with GISTEMP.
            Proxies support the instrumental record.
            So both UAH and the instrumental record are reasonably OK, they just measure different things.

            Trenberths concern is fixed by ARGO. Now we can see that ocean heat content accelerates when surface warming slows, and vice versa.

            Hansen did a good job but he didn’t know the Montreal CFC agreement would be such a success:
            https://tinyurl.com/y9c6e4lh

            I say there is enough evidence and risks to act, the sooner we start the less disruptive it will be to the world economy.

            I can agree to the rest of what you say.

          • Bill Hunter says:

            Svante says: —- Trenberths concern is fixed by ARGO. Now we can see that ocean heat content accelerates when surface warming slows, and vice versa. —–

            Like no sht. Water vapor, clouds, are all ocean effects and as we know its a seething mass with uneven distribution of heat, currents that change course and often reverse, except for the greatest ones driven by the Coriolis Effect. When ocean heat is plus exit its going to get warmer. When the ocean is uptaking heat its getting colder. There is enough heat in the ocean to go into one phase should the physics allow it to influence our climate for a millennium. We talk about melting ice caps then find that at the current melt rate it will take something like 100,000 years to melt and that water can raise sea levels a few hundred feet but we have to remember the oceans are an average of
            12,100 feet deep.

            The bottom half of the ocean isn’t monitored. We don’t know if the oceans are gaining heat or losing heat by measuring only the top half at most and polluting the ARGO data with adjustments and inferior measurements. I would go grab the ARGO data myself if I thought I could derive anything globally relevant out of it but what we are learning from ARGO is just a lot of oceanography about surface currents and temperatures in the top half.

            My theory is that the oceans are colder than the envelope they exist in because of cold water and brine input. That cold water and brine input increases dramatically when ice is stripped off the surface of the ocean by a warming climate. You can see it in the annual refreeze data. That water both cold and very saline creeps like the blob across the ocean floor and forms the basis of what is known as the thermohaline circulation system, which eventually runs to shallower zones of the ocean and becomes susceptible to being pulled up into the Coriolis effect circulation. Anybody is just guessing as to why that might influence ocean oscillations on any time scale because there is so close to zero ocean depth monitoring. ARGO is working on a plan to get down there when they do I think its going to explain a lot.

            Svante says: —– “I say there is enough evidence and risks to act, the sooner we start the less disruptive it will be to the world economy.”

            I am fine with whatever your personal choices are. But we must first identify clear problems, not every problem we are mostly ignorant about. And I can assure you that we are more than half ignorant about climate and I just explained why.

            In the meantime I think we should up the ante on research. Take all these whine and cheese tour folks off the budget, keep maybe 2 or 3 modeling projects going, closely examine the relevancy of what we are learning from each monitoring project and cut back on the programs that are redundant and not adding significantly different and relevant information. I am a strong believer in ground truthing data and doing it independently of big special interest non-independent groups. Its an excellent role for an independent civil service. Academic freedom is a great concept for our universities but like financial accounting in the free enterprise system it needs far more independent oversight before the stuff is introduced into public policy.

          • Svante says:

            Bill Hunter, I think I’m wrong about the AMO.

            This paper says the AMO (or any other ocean cycle) is not an independent variable:
            https://www.carbonbrief.org/guest-post-why-natural-cycles-only-play-small-role-in-rate-of-global-warming

  2. John Baylor says:

    Why are not the temps from the 1930s included ? Is it because of the warm temps? John

    • Richard M says:

      Remember, this is satellite data. No satellites in 1930.

    • Gordon Robertson says:

      john…”Why are not the temps from the 1930s included ? Is it because of the warm temps? John”

      Besides what Richard M claimed, that the sats have only been around since 1979, NOAA has been working overtime re-writing the historical record to align it with the IPCC AGW propaganda. NOAA has de-emphasized the 1930’s record heat waves and created a trend from 1998 – 2012 that the IPCC claimed was not there. They can’t even agree with propaganda.

      NOAA claimed 2014 the warmest year ever based on a 48% confidence level that they were telling the truth.

      See the picture?

      • Craig T says:

        “NOAA claimed 2014 the warmest year ever based on a 48% confidence level that they were telling the truth.”

        Why so much emphasis on 2010 being within the margin of error of warmer than 2014? Currently 2014 is the 5th (or 6th) hottest year after 2016, 2015, 2017 and 2018 based on GISTEMP surface measurements.

  3. Jurpo says:

    Most of the warming went into the sea – please plot against ocean heat content to see if your hypothesis has any merit.

    • Richard M says:

      Where is the evidence that any greenhouse gas warming has gone into the sea. Sorry, but you are repeating unsupported conjectures and not science.

      • Entropic man says:

        Richard M

        Lots of available evidence that ocean heat content is increasing. It is even consilient. The rate of ocean heat content increase matches the imbalance in the global energy budget and matches the thermal expansion portion of sea level rise.

        https://en.m.wikipedia.org/wiki/Ocean_heat_content

        • Bill Hunter says:

          So are they still throwing out suspected “cold” buoys and mixing in “hot” engine intake figures?

        • barry says:

          Bill, no buoys or intakes were thrown out. Someone has been telling you porkies.

          And you are talking about sea surface temps, when the reply was about ocean heat content – that’s temps down to hundreds of meters.

          • bill hunter says:

            Barry – “Bill, no buoys or intakes were thrown out. Someone has been telling you porkies.”

            https://journals.ametsoc.org/doi/10.1175/2008JTECHO608.1

            Here buoys are being thrown out on an examination of the data they returned as opposed to an examination of the floats. “Further investigation of the data returned by these instruments uncovered a flaw that caused temperature and salinity values to be associated with incorrect pressure values.” Statement lacks a source one would think if you had even one source footnoted in the entire paper it would be this one.

          • Craig T says:

            “Statement lacks a source one would think if you had even one source footnoted in the entire paper it would be this one.”

            Here’s what the paper says:
            “It is important to note that these systematic errors were caused by improper processing of data by a small subset of floats, and they do not reflect an inherent flaw in the observing system. About one-half of the affected profiles have been corrected exactly, and the remainder may eventually be corrected to a good approximation. Corrected profiles have been uploaded to the Global Data Archive Centers for a large number of the floats. Profiles that have not been corrected are now flagged as ‘3 bad data that are potentially correctable,’ in the variable ‘PRES_QC.’ (Further details regarding the status of these data, as well as complete lists of the affected floats, may be found online at http://www-argo. ucsd.edu/Acpres_offset2.html.)

            The paper has a full page discussing the problem besides the link to more information. This is a long way from “throwing out suspected ‘cold’ buoys and mixing in ‘hot’ engine intake figures.”

            By the way, the paper shows the defective Argo floats gave higher surface temperatures than the fully functioning floats.

          • Craig T says:

            You said they were “throwing out suspected ‘cold’ buoys,” implying the reason they threw out the data was it went against the results they wanted. You also said “Ultimately the reasoning works its way around to being inconsistent with models.”

            The paper you linked threw out warm data not cold, and for a specific reason. “These probes do not measure pressure or depth but instead record temperature as a function of time since the probe entered the water. They are designed to fall at a known rate, and fall-rate equations are used to convert elapsed time into depth.”

            The data was thrown out to increase accuracy not meet an agenda.

          • Bill Hunter says:

            Craig T says: The paper you linked threw out warm data not cold, and for a specific reason.

            Nope! You have to actually read the paper and not just skip to what you want to read. The paper outlines 2 biases and says so in the first line of the paper.

            Bias 1. Cold reading ARGO buoys that provide current ocean heat profiles.
            Bias 2. Warm reading XBT buoys that establish historical ocean heat profiles.

            The first adjustment raises the current ocean temperatures and the other adjustment lowers the old ocean temperatures at the beginning of the trend.

            Net result is two adjustments that both serve to increase the warming trend of the ocean. Something that was perceived as being direly needed as the answers being returned did not comport with various ocean computer models.

            I haven’t looked for support on the XBT adjustment but did note the only justification provided for the ARGO adjustment was a lack of consistency with the results with sea level models. Those models also contain large doses of uncertainties, such as a function of isostatic rebound to account for the fact that tide gauges have come up short in view of how much ocean rise we should be getting as indicated by ocean warming and ice melting models.

            Presumably although they don’t even tell us as much, they identified the defective floats from some sort of statistic review of individual floats. That would make for a very interesting paper and would provide support for the adjustments they did make. If anybody ever sees it let me know. They certainly didn’t reference it in this report.

            So while I am not saying the paper is wrong but one has to be aware of how bias creeps in. The whole motivation for the review comes from a circular reasoning between ocean temperatures and ocean expansion. With an actual speculative variable to help out the ocean expansion figure like this isn’t exactly the first rodeo for this data.

            Willis indicates the motivation at the end of the paper: “Nevertheless, some discrepancy remains in the globally averaged sea level budget, and observations of the rate of ocean mass increase and upper-ocean warming are still too small to fully account for recent rates of sea level rise (Willis et al. 2008). Temperature changes in the deep ocean (e.g., Johnson et al. 2007) may account for some of that discrepancy, at least over multidecadal time scales (Domingues et al. 2008)” Sea level rise modeling and current estimates of trends is very much dependent upon assumptions of ocean heat uptake.

            And then finally you have to factor in the really biggest dog in this whole game. . . .that ARGO nor anything else measures at all the bottom 1/3rd of the ocean where highly saline net cold input is what keeps the oceans cooler than the earths crust and the climate at the surface. So stuff could be going on down there without any awareness on our part from ocean shrinkage to expansion, yet those figures are assumed in ocean sea level rise and then used here to influence ocean temperature measurements for a full circle approach. At least there are some plans to expand ARGO into that area in the future.

        • Bill Hunter says:

          raig T says:
          May 17, 2019 at 7:39 AM

          Heres what the paper says:
          It is important to note that these systematic errors were caused by improper processing of data by a small subset of floats, and they do not reflect an inherent flaw in the observing system.”

          That’s just repeating the other quote in the paper. Both statements are offered without any support whatsoever except an assumption that some floats are flawed. I read a paper by a French group that tossed out specific floats out for bad processing because they believed they were wrong. Ultimately the reasoning works its way around to being inconsistent with models. This is the key finding to the corrections that were made and there is no study on it.

          I could be mistaken on the engine intake perhaps confusing it with the hot XBTs. Don’t have the time to go back searching for it now.

          • barry says:

            “I read a paper by a French group that tossed out specific floats out for bad processing because they believed they were wrong. Ultimately the reasoning works its way around to being inconsistent with models.”

            No, YOUR OPINION is that the reasoning is to make observations consistent with models, but you have zero evidence of that, and I bet if you actually linked the paper we would find, as we did with the paper you did link, that this is not the case. Why would ‘they’ (a lazy intellectual construct) throw out data that would provide a warmer conclusion?

            The paper you provided is 12 years old. Recent revision include plenty of buoy data, as well as ship intake. Obviously, faulty equipment or processing is either corrected or discarded. Anything less is negligence.

      • Jurpo says:

        The planet is warming and there was no hiatus. Look at the ocean heat content or sea level data.

        • Gordon Robertson says:

          jurpo…”The planet is warming and there was no hiatus. Look at the ocean heat content or sea level data.”

          More blatant alarmist propaganda. The IPCC admitted in 2013 than no significant global warming occurred from 1998 – 2012. Thats 15 years of no warming and the UAH record extends that to 18 years.

          Where did all your fictitious warming come from?

          • Jurpo says:

            IPCC might or might not have said that about the atmospheric warming. Meanwhile 90% of the heat went into the oceans without any kind of a hiatus. Stop learning climate science from blogs please.

          • Mike Flynn says:

            J,

            You wrote –

            “IPCC might or might not have said that about the atmospheric warming.”

            According to your research, which was it? I assume you know, and are just being silly by pretending you don’t know.

            Cheers.

          • mike flynn says:

            J,

            You wrote –

            “IPCC might or might not have said that about the atmospheric warming.”

            According to your research, which was it? I assume you know, and are just being silly by pretending you don’t know.

            Cheers.

        • Matthew Bruha says:

          From your link “the total ocean heat anomaly in 2018, relative to a 19812010 baseline, and for the upper 2000 m of the worlds oceans, is (19.670.83)10^22 J”.

          On the surface this appears to be an ‘alarmingly’ high anomaly. The anomaly in 2017 was 18.760.8010^22 so there was an increase of 0.91×10^22J increase.

          The earths oceans contain approx 1.26×10^21 litres of water. 4,184 j of energy is required to heat 1 litre of water by 1C so the amount of energy required to heat the oceans by 1C is 5.27×10^24 J.
          So the increase is the equivalent of raising the heat of the ocean by 0.0017 degrees C, or extrapolated out, about 0.2 C/century.

          Not very alarming to me

        • Matthew Bruha says:

          Ooops.didn’t realise the ‘+/-‘ would be lost in cut and paste…

          From your link “the total ocean heat anomaly in 2018, relative to a 1981 – 2010 baseline, and for the upper 2000 m of the worlds oceans, is (19.67 +/-0.83)10^22 J”.
          On the surface this appears to be an ‘alarmingly’ high anomaly. The anomaly in 2017 was (18.76+/-0.80)10^22 so there was an increase of 0.91×10^22J increase.
          The earths oceans contain approx 1.26×10^21 litres of water. 4,184 j of energy is required to heat 1 litre of water by 1C so the amount of energy required to heat the oceans by 1C is 5.27×10^24 J.
          So the increase is the equivalent of raising the heat of the ocean by 0.0017 degrees C, or extrapolated out, about 0.2 C/century.
          Not very alarming to me

        • barry says:

          A change of that much for a mass of that size requires an enormous amount of energy.

          As an exercise, see if you can work out how much the same amount of energy would change the temperature of the troposphere.

          It would be quite a bit more than 0.0017 C.

        • bdgwx says:

          Matthew, the warming rate is about 10e21 joules/year. That works out to about a +0.6 W/m^2 imbalance on the planet. That’s an enormous amount of energy by the way. Like barry said it’s an easy and fun exercise to calculate how much that amount of energy would warm the troposphere if all of it went directly into the troposphere.

          • Mike Flynn says:

            b,

            After four and a half billion years of sunlight, how many joules do you believe the Earth has accumulated? How hot is the surface now?

            According to me, the surface has cooled since it was molten. That would indicate a net loss of energy form the Earth, unless you can produce some pseudoscientific climatological magic to show that cooling is actually heating.

            Off you go – how hard can it be?

            Cheers.

          • Matthew Bruha says:

            The point of my response was in relation to the paper that was linked which relates to ocean temperatures not troposphere temperatures. It shows some very big numbers which, when put in perspective, are of little consequence

            Down-thread there was a comment that I should look at 0-700m warming. NOAA numbers indicate the temperature anomaly rose from 0.168C in 2017 to 0.177C in 2018 which extrapolates to an ocean temperature rise of about 0.9C per century….again, nothing to be alarmed about

          • barry says:

            “NOAA numbers indicate the temperature anomaly rose from 0.168C in 2017 to 0.177C in 2018 which extrapolates to an ocean temperature rise of about 0.9C per century… again, nothing to be alarmed about”

            There’s so much wrong with this comment it’s hard to know where to start.

            1) Can’t establish a trend from 2 data points.
            2) The oceans have massive heat capacity compared to the atmosphere, and will always significantly lag atmospheric changes.
            3) The amount of energy required to make that amount of change in the ocean temperature is truly enormous.

            It is well the oceans absorb so much of the energy in the system. An increase of 0.01C in ocean temps, were the same amount of energy immediately transferred from the ocean to the atmosphere, would result in a 40C increase in atmospheric temps.

    • Gordon Robertson says:

      jurpo…”Most of the warming went into the sea please plot against ocean heat content to see if your hypothesis has any merit”.

      More political bs. That lame theory came from Trenberth after he was caught admitting in the Climategate email scandal that the warming had stopped. He had egg on his face and needed a ploy to divert from his gaffe.

      • barry says:

        Anyone can make up stories, but it takes a real fool to actually believe this patent BS.

        • Craig T says:

          And anyone can come up with excuses to ignore information they don’t like.

        • barry says:

          If people would cite original sources the claims could be checked. But skeptics never get their info form original sources, they just get BS from blogs and foolishly believe it.

          I’ve gone to the original source for this claim. But I’m sick and tired of doing the legwork for idiots. If Gordon wants to substantiate his story, he is welcome to. But as it’s BS, he won’t be able to. He’ll cite some blog if he even bothers to do more than just spout and run.

        • Mike Flynn says:

          Begone troll!

        • barry says:

          Looks like Gordon heard you.

  4. Entropic man says:

    Over a longer time period El Nino and La Nina define a variation either side of the trend without affecting the size of that trend ie ENSO does not affect the trend.

    Your 21st century data is only 18 years.I suggest that the apparant 21st century amplification of the trend by ENSO is an artefact of your small sample size.

    • Richard M says:

      Funny, the short period of time did not stop Gavin and the other alarmists from claiming validation of their data.

      Actually, Roy is being generous. He is still starting the data with a La Nina (2000) and ending the data during the first year of a two year El Nino. That El Nino started in Oct 2014 so probably started affecting the LT in 2015. He really should have looked from 1/2001-1/2015. That would have better minimized the effects of ENSO.

      Of course, that would have made it even more obvious that ENSO has driven all of the warming trend in the 21st century. There has been no warming of the climate itself.

      • Entropic man says:

        Richard M

        Gavin Schmidt is on record as regarding thirty years as the minimum period over which long term trends can be usefully distinguished from short term noise like ENSO.

        Statistically, the 95% confidence limits for all the temperature trend datasets are about +/-0.1C.

        A statistically significant least squares linear trend line would change by at least 0.2C. That would take 16 years at the UAH 0.13C/decade.

        • Bill Hunter says:

          Gavin Schmidt used to be on board with Ben Santer’s 17 years. I realize he changes his position frequently. Here the reason is obvious as most of the warming occurred in Santer’s 17 years even now with a 30 year measurement. But I tend to favor a 70 year trend, unfortunately we don’t have a satellite record that goes back that far but hey in another 30 years we will be there.

        • barry says:

          Santer’s 17 years was never stated as a standard for assessing climate change, and the conclusion of the study where that figure appeared in the abstract, stated that generally multidecadal periods were required.

          From the conclusion:

          “In summary, because of the effects of natural internal climate variability, we do not expect each year to be inexorably warmer than the preceding year, or each decade to be warmer than the last decade, even in the presence of strong anthropogenic forcing of the climate system. The clear message from our signal‐to‐noise analysis is that multi‐decadal records are required for identifying human effects on tropospheric temperature.

          https://agupubs.onlinelibrary.wiley.com/doi/full/10.1029/2011JD016263

          The lesson for you, Bill – don’t trust blogsites – read the source material. I’ve provided it for you. If the blog site doesn’t give you a straight link to a paper it’s discussing, it’s virtually certain that the reporting is BS.

          • Bill Hunter says:

            Barry – Obviously you failed in reading your entire reference..

            Maybe you should at least read the abstract of your link where Santer concludes:

            “Our results show that temperature records of at least 17 years in length are required for identifying human effects on global‐mean tropospheric temperature.”

          • barry says:

            You failed both at reading the whole paper, and also at reading my whole post, where I note the 17-year figure is in the abstract. How else do you think I knew which paper you were talking about?

            The paper takes on the question of whether an anthropogenic signal can be deduced from a 10-year period of global temperature data (satellite, in this case). 10 years was too short. The researchers tested multiple time frames. 17 years was the minimum requirement to potentially get a clear result. Multidecadal time frames (they went up to 32 years), as they state, are required to get an unambiguous signal.

            Note the qualifiers:

            “at least” 17 years
            “the clear message” is multidecadal timescales are needed

            But you have to have read the paper to understand that.

            And you can’t ignore whatever you don’t like the look of when you’re citing a paper.

          • barry says:

            Bill, you wrote:

            “Gavin Schmidt used to be on board with Ben Santer’s 17 years”

            I’ve linked to the paper you mentioned. Could you return the favour by substantiating what you’ve said here? I think it’s false.

          • Bill Hunter says:

            Sure thing Barry just go sift through the archives at Real Climate.

          • barry says:

            So you’re not serious about the discussion. No worries then.

        • Gordon Robertson says:

          entropic…”Gavin Schmidt is on record as regarding thirty years as the minimum period over which long term trends can be usefully distinguished from short term noise like ENSO.”

          You are talking about one of the clowns of climate science. He could not explain positive feedback and had to be corrected by engineer Jeffrey Glassman.

          That would not be so bad if the catstrophic warming projected by his climate models at GISS did not depend so heavily on positive feedback.

  5. Entropic man says:

    I tried to put up the relevant graph, but the site rejected the link.

  6. Entropic man says:

    “the CMIP5 surface-to-500 hPa layer average temperature averaged across all models is +0.20 C/decade, so even RSS LT (which usually has a warmer trend than UAH LT) has only one-half the warming trend as the average CMIP5 model during this period.”

    This is not a valid comparison. An “average” CMIP5 model run used estimated forcings since 2005 larger than actually occured. Thus an average of all the CMIP5 runs overestimates the warming to be expected.

    In practice the runs which came closest to reality were those which matched the observed forcing since 2005, about 25% of the range below the average.

  7. bdgwx says:

    For me…the best comparison would be with forcing adjusted CMIP5 runs that way we can eliminate the inputs as the cause for the discrepancy. I’m more interested in how well the model physics is performing as opposed to how well our guesses at the inputs are.

    The other thing I’m not particularly satisfied with is that the troposphere represents…what…a couple of percent of the total thermal mass of the geosphere. I’d also like to see the comparison with OHC since that captures 90%+ of the heat accumulation. I do concede that troposphere is an important metric so I’m not in any way suggesting that it was a flaw to focus on it here.

    And one last thing…I’m not a big fan of removing any warming or cooling from the record of any kind. I’m skeptical of these techniques that try to remove ENSO variation because that procedure is dependent upon the assumption that the secular warming force has little or no influence on ENSO itself. Don’t get me wrong…I like to try to eek out the secular warming signal by cancelling out the natural variation noise as well. I’m just saying that the procedure could have an unintended consequence. At the end of the day a plain old fashioned trend line is still in the short list of best tools for analyzing warming trends IMHO.

    This is still a really informative blog post though. Thanks Dr. Spencer!

  8. pochas94 says:

    We may be at the top of the DeVries solar cycle. If so, and if temperatures follow solar activity, after an interval the temperature will drop until 2100 when they will be about where they were in 1900.

    • Entropic man says:

      A 1C drop is unlikely.

      The difference in output between an active 150 sunspot Sun and a quiet Sun is 1W/M^2 at Earth’s orbit. Unless our climate is much more sensitive than we think, that would produce a surface temperature change around 0.3C.

      • Eben says:

        Always the same idiotic argument the total sun energy radiance as the only mechanism affecting the earth temperature

      • pochas94 says:

        My catalog of solar derived effectors:
        a) Solar spectral composition (Ultraviolet radiation)
        UV generates ozone which absorbs UV radiation,
        heating and expanding the stratosphere, affecting the
        Brewer-Dobson circulation, the polar vortex,
        and global weather patterns in general.
        b} Tidal forces
        The same tidal forces that produce solar activity
        variations also act on the earth directly, affecting
        oceanic and atmospheric currents, and volcanism.
        Additionally, the moon enters into this melange
        of gravitational forces as a major player.
        c) Solar Wind
        Solar wind impacting earths magnetic field causes
        charged particles to be trapped by the d layer.
        These then precipitate into the troposphere
        resulting in auroras and raising the negative
        space charge affecting water droplets as they
        coalesce into raindrops.
        d) TSI
        Constantly deprecated as too tiny to matter
        while ignoring these related extremely important
        moieties.

  9. Nabil Swedan says:

    I thought that there is a cooling cycle, L Nina, everytime there is a warming El Nino. Do they cancel out or not in a full cycle?

    • Entropic man says:

      Nabil Swedan

      “Do they cancel out or not in a full cycle?”

      They cancel out. This is why there is no lnk betewwen the long term (30 year+) temperature trend and ENSO.

      • Jim Ross says:

        It’s funny how this view (cancelling out) is generally accepted and yet a quick check of the Oceanic Nino Index (ONI, as reported by NOAA) does NOT show this. Since 1950, cumulative positive values are ahead of cumulative negative values by 8.5%. Whether or not that is a material difference is a separate question.

        • bdgwx says:

          I agree. If ENSO was a zero sum cycle then you’d expect observations to confirm that. I believe that this can cause a material difference in the way trends are analyzed when the ENSO noise is being removed since it can, depending on the technique, remove part of the warming signal. It’s not that I’m against these techniques. It’s just that the proper context needs to be placed on any conclusions drawn from such an analysis. It would also be nice if these analysis offered some justification for assuming that global warming does not materially impact the behavior of the ENSO cycles.

        • barry says:

          “Since 1950, cumulative positive values are ahead of cumulative negative values by 8.5%. Whether or not that is a material difference is a separate question.”

          That would suggest to me that you should see a clear positive trend with ENSO data from 1950. I would do the quick linear regression myself, but I’m trying to figure out how to convert non-CSV text files to CSV for Libre Office on a new PC (Excel handled txt files just fine).

          Here’s the monthly data if anyone wants to have a crack at checking for the trend (the trend result would be great, too).

          https://www.cpc.ncep.noaa.gov/products/analysis_monitoring/ensostuff/detrend.nino34.ascii.txt

          ENSO anomalies are in the 3rd column.

          • Craig T says:

            The data from the link shows the slightest downward trend from 1950 to 2019 – only a -0.003 drop in the index per decade.

            If you open a file like that in Word then do some find-replace gymnastics you can turn it to a tab delimited file. I start by replacing the largest number of spaces between columns with a tab (use “^t” to replace with a tab.) Repeat with one less space until all spaces are gone. Finally replace two tabs in a row with a single tab and everything lines up again.

          • Craig T says:

            Now that trend was for the Anomaly data in column 4. The data in column 3 has a slight upward trend of 0.082 per decade.

          • barry says:

            Thanks for the tips. My issue is that the Libre Office spreadsheet can’t handle txt. files like Excel can. I need to find a handy way to convert the txt. files to csv. , and just changing the file handle doesn’t seem to work.

            And thanks for the results. I don’t know what the 3rd column is meant to represent. It’s not a 1 for 1 with the anomalies. There will be a doc somewhere explaining it, but pages have been moved and I can’t find the source page.

            Not unexpectedly, the ENSO record from 1950 is a pretty flat trend. That’s the point in reply to the posts above.

          • Jim Ross says:

            I have not found an explanation of the txt file that barry posted, but I think I now understand what may be going on. Happy to be proven wrong, however. Key to this is Craig’s comment down-thread that: “The ONI is based on SST anomalies in the Nino 3.4 region and compared to a sliding 30 year average.”

            I think that column 3 is probably the “raw” SST temperature data, column 4 is the “sliding 30 year average” and column 5 is the calculated anomaly, i.e. the difference between them. I am also unsure exactly how ONI is determined, but it is virtually 1:1 with the temperature anomaly values (gradient of 0.96 on a cross-plot). Since the sliding 30 year average is effectively detrending the data, the ONI data should show net zero, but the method leaves a small positive bias in the cumulative data as I noted above. To answer my own question, then, I do not believe this small positive bias is material. On the other hand, it is hardly meaningful to claim that the ONI values indicate that the temperature effect of ENSO is neutral, since this would seem to be primarily a consequence of detrending the input temperature data.

            Incidentally, if I assume that column 3 is indeed the actual SST data and compute the climatology for 1950-1979 (fixed 30 year period, averaging each month), a linear regression of the anomaly data then show a warming trend of 0.08C per decade.

          • Craig T says:

            That is what’s going on.

            “Due to a significant warming trend in the Nino-3.4 region since 1950, El Nino and La Nina episodes that are defined by a single fixed 30-year base period (e.g. 1971-2000) are increasingly incorporating longer-term trends that do not reflect interannual ENSO variability. In order to remove this warming trend, CPC is adopting a new strategy to update the base period.

            There will be multiple centered 30-year base periods that will be used to define the Oceanic Nino index (as a departure from average or ‘anomaly’). These 30-year base periods will be used to calculate the anomalies for successive 5-year periods in the historical record:

            The monthly Nino-3.4 index (which is used to calculate the ONI values) that uses these new centered 30-year base periods (‘ClimAdjust’) are provided in this text file: [barry’s link]

            https://origin.cpc.ncep.noaa.gov/products/analysis_monitoring/ensostuff/ONI_change.shtml

          • Jim Ross says:

            Thanks for the clarification, Craig.

            There are a number of commenters here claiming that a neutral ONI over the longer timeframe is evidence of a balanced ENSO (from a temperature perspective). It seems to me that it does not do that. It removes any longer term trend and leaves behind a balanced ONI virtually by definition. This looks like it might be a circular argument to me. Am I missing something?

          • bill hunter says:

            I don’t know why this is so complicated for so many. The ENSO index is an indicator for how much heat the ocean is expelling. Its a powerful enough process in the Pacific that it frequently overrides all other current effects that regulates the release of heat from the ocean. Obviously the ocean can only release heat it receives but it stores huge amounts of energy that are released primarily by surface evaporation and that is not a steady process.

          • barry says:

            You get the same result using other ENSO indicators, like the Southern Oscillation index, or the MEI, which uses a variety of sources. ENSO fluctuations do not continually add heat to the system, is transfers heat from the ocean to the atmosphere (el Nino) and back again (la Nina).

            Anyone arguing that el Ninos consistently add heat to the atmosphere, and la Nina does not remove it, has to contend with the logical consequence that 1000 years ago the Earth should then be 10C cooler.

  10. CO2isLife says:

    Has Antarctica warmed at all in the 21st Century? If it hasn’t, one can make the statement that 0.00% of the warming in the 21st Century is due to CO2. There is absolutely no plausible explanation as to why CO2 would cause warming elsewhere, but not Antarctica.

    CO2 is 410 ppm at every latitude and longitude, there is no way for it to turn on and turn off the GHG effect. If Antarctica isn’t warming, a location void of water vapor and the urban heat island effect, then one can’t claim CO2 is causing warming anywhere unless the laws of physics cease to exist in Antarctica.

      • Mike Flynn says:

        b,

        Another pointless and irrelevant link, perhaps? Why do you bother?

        Cheers.

        • Svante says:

          The GHE is defined in formula 2) Mike.

          • Mike Flynn says:

            S,

            Another pointless and irrelevant link, perhaps? Why do you bother?

            I assume there is no useful description of the GHE, otherwise it is probable someone would have managed to paste it on this blog, at least. A formula? What fresh nonsense is this?

            Oooooh! Mathematics! How impressive is that?

            If you are too lazy to paste your wondrous formula, why do you expect me to do what you refuse to do? What a Wally! Back to Stupid Troll school for you.

            Cheers.

          • Craig T says:

            “Greenhouse gases (GHGs) act on the climate by absorbing terrestrial surface radiation and provoking long‐wave (LW) emission from the atmosphere. This is radiated in two directions, back toward the surface and out into space. Generally, the surface is warmer than the atmosphere. Thus, radiation emitted from the surface through the atmospheric window is higher compared to radiation from the stratosphere. This is clearly visible looking at the CO2 band around 15 µm, where the emission originates mostly from the stratosphere. The spectra give an emission minimum in the CO2 band.

            However, above Antarctica the top‐of‐atmosphere (TOA) spectra look different; the spectra yield a maximum in the CO2 band. This observation is consistent with the finding that in the interior of the Antarctic continent the surface is often colder than the stratosphere; therefore, the emission from the stratospheric CO2 is higher than the emission from the surface.”
            https://agupubs.onlinelibrary.wiley.com/doi/full/10.1002/2015GL066749

          • Craig T says:

            “In order to investigate the absorρtion and reemission of the LW radiation within the atmosphere, the greenhouse effect (GHE) can be defined as the difference between the surface emission and FTOA:

            GHE = σ T4surf − FTOA”

          • Mike Flynn says:

            CT,

            What is the point of your post? Mindless appeals to pseudoscientific authority are not convincing, without at least a little explanation.

            The Earth has cooled over the last four and half billion years – even the surface is no longer molten. No GHE involved, by the look of it. You quote “GHE = σ T4surf − FTOA” which is quite meaningless. The sort of thing which looks quite sciency but is devoid of useful information, or even uses completely misleading units in an attempt to mislead readers. For example, using irradiance or flux density, as a substitute for temperature.

            This leads to bizarre situations where some pseudoscientific climate cultist might assert that some mythical “energy imbalance” will create a change in measured temperature in some unspecified place, at some unspecified time, of some unspecified amount. Ridiculous, eh?

            This is all about as stupid as expecting ice emitting 300W/m2, directed at a shiny teapot containing tea at 80 C, emitting 90 W/m2, to make the tea hotter! W/m2 are not directly useful as a substitute for temperatures. Only pseudoscientific bumblers would attempt such stupid misrepresentations.

            Over to you.

            Cheers.

      • Craig T says:

        “Another pointless and irrelevant link, perhaps?”

        “For this region, the emission to space is higher than the surface emission; and the greenhouse effect of CO2 is around zero or even negative, which has not been discussed so far. We investigated this in detail and show that for central Antarctica an increase in CO2 concentration leads to an increased long‐wave energy loss to space, which cools the Earth‐atmosphere system.”

        Only pointless and irrelevant if you don’t want your opinion sullied by facts.

      • Stephen P Anderson says:

        Amazing how all these studies close their minds to anything other than CO2. They start with the premise that it is CO2 and there are no other potential explanations. If they would only accept that the warming has caused the CO2 and not the other way they might actually be able to understand what causes temperature change.

        • bdgwx says:

          SPA, the scientific consensus already provides a reasonable understanding of the causes for the changes in both CO2 and T. This understanding is a manifestation of CO2’s dependence on T and T’s dependence on CO2. If you know of a model that provides a better match to reality for ALL observations (not just CO2 and T) which ignores the 150+ years of evidence demonstrating T’s dependence on CO2 then can you post a link to it so that we can review it?

          • Stephen P Anderson says:

            BGDWX,
            There is no such thing as scientific consensus. If you would actually read and pay attention to real scientists you would know this. And, again if you can explain how all the warming for 150+ years is due to 1% of the energy budget, then please put forward your explanation.

          • bdgwx says:

            Can you post a link to a publication from a real scientist who ignores T’s dependence on CO2 and who can provide better explanations for Earth’s climate than what is already available? I would be happy to read it.

        • Craig T says:

          “Amazing how all these studies close their minds to anything other than CO2.”

          Here’s a link to another forcing that affects climate.

          Cooling of the Arctic and Antarctic Polar Stratospheres due to Ozone Depletion
          https://journals.ametsoc.org/doi/pdf/10.1175/1520-0442(1999)012%3C1467%3ACOTAAA%3E2.0.CO%3B2

          CO2isLife made a broad statement claiming everything needs to warm if CO2 causes warming and bdgwx supplied a link to research how CO2 actually affects the bottom of the world. There is a logic to that.

        • Richard Greene says:

          The theory of the coming global warming crisis requires these beliefs:

          Natural causes of climate change for 4.5 billion years

          Aerosols controlled the climate from 1940 to 1975, with no visible CO2 warming.

          All the aerosols fell out of the air in 1975 (they didn’t but you MUST believe), and then CO2 controlled the climate
          from 1975 to 1997.

          From 1998 to the end of 2018, El Nino’s controlled the climate — there was a flat trend without the huge 1998 and late 2015 / early 2016 ENSO heat peaks — pretty close to a flat trend WITH those heat peaks.

          So the “climate controller keeps changing, like a mafia don getting bumped off, and someone else taking over.

          Except the smarmy global warmunists can’t explain why, or how, 4.5 billion years of natural climate change would have stopped, and only man made climate change remained after 1940.

          They can’t explain because there is no logical explanation.

          So they don’t try.

          • Craig T says:

            “Except the smarmy global warmunists can’t explain why, or how, 4.5 billion years of natural climate change would have stopped, and only man made climate change remained after 1940.”

            You’re talking about the people that studied the last 4.5 billion years to see how climate changes. Literally wrote the books on it.

    • Mike Flynn says:

      The NSF suspended Archimedes’ Principle in the Arctic for six and a half years. Maybe the pseudoscientific climate cultist community has declared a no-physics zone in the Antarctic, to give Mother Nature a well deserved rest.

      Tricky thing this GHE. It’s supposed to cause cooling in the Antarctic, I believe.

      A multi-purpose non effect.

      Cheers.

    • barry says:

      “Has Antarctica warmed at all in the 21st Century?”

      I’m suspicious as to why one would specify the last 18 years when there is data both satellite and land for twice that length and more. Sounds like someone has found a cherry-pick.

      Based on UAH v6, yes there has been warming in Antarctica over the satellite period (since 1979). It’s only slight, but there are confounding factors, such as increased CFCs and depleted ozone during that period, with still elevated levels of CFCs and depleted ozone. Also, the Antarctic is relatively thermally isolated from the rest of the globe by by circumpolar winds and currents.

      Land temps for Antarctica since the early 1950s have been found to be warming, even by a group of ‘skeptics’ who took issue with a study (Steig et al) that made that assessment. Their own attempt found warming, but only half as much as Steig.

  11. fah says:

    Perhaps there will be an erratum wave that they were “just joking,” that it was dry humor and why didn’t we all get the joke?

  12. Terry says:

    Roy
    I am curious to know how much of the more recent El-Nino effects are actually being driven by the ocean warming, and is it therefore justifiable to remove all of the effect to get a lower trend. For example the apparent long term increase in El-nino intensity depending on which parameter you use to compare, would suggest that El-Nino events are linked to overall warming. The NOAA Nino index shows the slow trend in El-Nino intensity. https://ggweather.com/enso/oni.htm . Just my musings

    • Craig T says:

      The ONI is based on SST anomalies in the Nino 3.4 region and compared to a sliding 30 year average. Since it’s tied to temperature it can’t be used accurately to subtract from the overall warming trend.

      Even though not human caused, the worldwide warming seen during an El Nino is caused by the greenhouse effect. Increased water vapor reduces the Earth’s outgoing longwave radiation.

      Look of this graph of OLR versus GISTEMP monthly land and ocean temperature anomolies. El Ninos are easy to spot by the spikes in temperature. When OLR goes down the temperature goes up – as you would expect from the greenhouse effect. (The bottom graph is detrended temperatures, making it easier to see how OLR is related to temperature changes.)

      https://i.imgur.com/Wwp5mSj.jpg

  13. PhilJ says:

    Dr. Spencer,

    “this means the observations will continue to need adjustments to fit the models, rather than the other way around.”

    Bingo.
    But models built on a funamentally flawed assumption are doomed to fail, no matter how many ‘epicycles’ are added to them.

    • Craig T says:

      So was AIRS adjusted to fit both GISSTEMP and UAH? A lot of posters here regularly claim fraud but I’m surprised to see Dr. Spencer make that suggestion.

    • bdgwx says:

      That’s a pretty interesting statement considering that the analysis in this blog entry literally adjusts (by removing a lot of the warming nonetheless) to make the discrepancy appear larger than it really is. Nevermind that UAH (and satellite datasets in general) already employ some rather large adjustment techniques to even be able to publish an accurate global mean temperature.

      • Craig T says:

        Not to mention the largest warming adjustment was made to UAH data. Like all the other adjustments it was made to improve accuracy not to fit any model.

    • David Appell says:

      PhilJ says:
      But models built on a funamentally flawed assumption are doomed to fail, no matter how many epicycles are added to them.

      Models are built on the laws of physics — mainly, conservation of energy.

      So which assumptions do you think are flawed, and why?

      NASA GISS GCM Model E: Model Description and Reference Manual
      http://www.giss.nasa.gov/tools/modelE/modelE.html

      “Description of the NCAR Community Atmosphere Model (CAM 3.0),” NCAR Technical Note NCAR/TN464+STR, June 2004.
      http://www.cesm.ucar.edu/models/atm-cam/docs/description/description.pdf

  14. Chris Hanley says:

    “… if history is any guide, this means the observations will continue to need adjustments to fit the models, rather than the other way around …”.
    The mainly up-adjustments since say 2015 particularly to GISS and RSS series seemed to have been accepted without much ado, it will be interesting to see how future apparent ‘model-fitting’ adjustments are accepted, not only within the ‘brotherhood’ but also in wider scientific circles.
    Given the vast present and proposed prescriptive policy effects on economic growth etc. surely, eventually, many in other unrelated fields will start to ‘smell a rat’.

    • bdgwx says:

      Can you provide some information or further context regarding “The mainly up-adjustments since say 2015 particularly to GISS and RSS series”?

      • Chris Hanley says:

        No problem, go to climate4you -> global temperature -> temporal stability of global air temperature estimates.

  15. Chris Hanley says:

    “It will be interesting to see if the new climate model assessment (CMIP6) produces warming more in line with the observations …”.
    My guess is that the inflection or take-off point will simply be shifted accordingly making the curve steeper and therefore action even more urgent.
    https://curryja.files.wordpress.com/2013/02/afig6.jpg

  16. Olof R says:

    This blog post is interesting, but Dr Spencer draws the wrong conclusions.

    The observed temperature trend in the 21st century is _not_ an even poorer comparison to models when accounted for ENSO.

    On the contrary, observations agree with models in the 21st centrury, because observations and models have similar trends in ENSO during this period.

    The 2000-2018 SST trend in the Nino 3.4 region is 0.19 C/decade (ERSST5), and that of the rcp4.5 average (average tos of 37 models) is also 0.19 C/decade.

    Here’s a comparison of ERA5 and rcp4.5 model average for various atmospheric levels:

    http://postmyimage.com/img2/511_ERA5levelsvsrcp45.png

    The agreement is good in the 21st century, but the observed warming was less than the models in 20th century. The latter can be explained by lower Nino3.4 SST trend 1979-1999, -0.02 C/decade in ERSST5 compared to +0.11 C/decade in the rcp4.5 average.

    Another more worrying conclusion is that the global warming has accelerated from the 20th to the 21st century. It has accelerated up to the level forecasted by CMIP5 models.
    It seems likely that the warming was held back earlier by prevailing la Nina conditions, but that is over now..

    • pochas94 says:

      Olaf, the models are wrong and any warming has less to do with CO2 and more to do with mendacious data adjusting (and maybe a little natural variability).

      • David Appell says:

        UAH adjusts more than the surface measurements do.

        And how would you prefer to account for the biases they’re taking into account?

      • David Appell says:

        pochas94: By the way, adjustments to surface station data reduce the long-term warming trend.

        1) See the graph in Karl et al, Figure 2b (“With Corrections Versus Without Corrections”) for the temperature data with and without adjustments. Compare the trends bias corrections REDUCE the long-term global warming trend.

        “Possible artifacts of data biases in the recent global surface warming hiatus,” Thomas R. Karl et al, Science 26 June 2015: Vol. 348 no. 6242 pp. 1469-1472.
        DOI: 10.1126/science.aaa5632
        https://www.nas.org/images/documents/Climate_Change.pdf

        2) “Turns out that global temperature adjustments actually reduce the long-term warming trend, mostly due to oceans.”
        – Zeke Hausfather, BEST analyst, 2/9/15, https://twitter.com/hausfath/status/564921572096348160

  17. Nate says:

    Is this analysis really statistically meaningful?

    2000-2015.5 Trends according to Cowtan’s trend calculator.

    UAH: 0.025 +- 0.194

    RSS: 0.117 +- 0.202

    So for troposphere there is ~ 0.1 of systematic uncertainty and 0.2 of random uncertainty.

    FYI

    Had*Cr 0.095 +- 0.123

    Gi*ss 0.130 +- 0.127

    Berk* 0.123 +- 0.122

    So, none of these trends are different from the Model trend, (which has its own large error), with statistical significance.

  18. The “era of man made CO2 emissions” started roughly after 1940.

    We have measured the global average temperature changes after 1940.

    I’m not satisfied with all the infilling required for surface compilations, so I use the UAH satellite data starting in 1979, whenever possible.

    The ACTUAL warming rate, cause unknown, in the 78 years from 1940 through 2018, is less than +0.8 degrees C. per century.

    The average climate model, excluding the Russian model that is obviously colluding with Donald Trump, predicts a FUTURE warming rate of about +3 degrees per century — QUADRUPLE the ACTUAL warming rate while lots of CO2 was added to the atmosphere
    from 1940 through 2018.

    Any start point other than 1940 (1950 would be okay too) is data mining.

    This article, with a focus on only 19 years, IS DATA MINING … that actually makes the computer games, er I mean climate models, look better than they are ! And they still look bad.

    Any period of time that has warming close to +0.3 degrees C. per decade will make the average climate model look good.

    The only period of time that really counts is 1940 through 2018 — the entire period with lots of man made CO2 emissions.

    I could also accept 1950 through 2018, since CO2 emissions ramped up even more after 1950.

    Any other time period is data mining.

    Our planet has had intermittent global warming for over 300 years, since the late 1600s, during the Maunder Minimum, and Little Ice Age.

    The warming since then, measured (real time) in central England, was at least +3 degrees C.

    Very little of that warming, (perhaps up to 15%) could be blamed on man made CO2 (as if anyone knew what CO2 really does in the atmosphere, with any precision).

    The warming since the late 1600s has been good news.

    The warming since the late 1600s has been almost entirely natural.

    No one in their right mind would want to stop that 300+ year warming trend, especially because of what we learned in recent decades:

    – The warming after 1979 was mainly at high latitudes, mainly in the six coldest months of the year, and mainly at night.

    Ask the people living in Alaska if that’s good news, or bad news, for one example !

    That’s good news warming for them ( and not at all visible in a global average ) !

    – Our planet is also significantly greening from more CO2 in the air.
    .
    .
    .
    That’s the big picture, of PAST climate change — all GOOD news.

    Is it not strange that FUTURE climate change is ALWAYS predicted to be BAD news.

    The same BAD news predictions are made every year, for many decades, yet the predicted BAD news never arrives?

    The UAH chart in this article shows no global warming from early 2002 through the end of 2018 — why do the mainstream media completely ignore that flat trend ?

    And the warming rate predicted by the average computer game is QUADRUPLE the actual warming rate from 1940 through 2018?

    No one reports that in the mainstream media !
    .
    .
    So why is it that climate change skeptics spend so much time debating tenth of a degree temperature anomalies, and so little time spreading the news that PAST climate change has been mild, intermittent and good news … and there’s no logical reason to assume FUTURE climate change will be completely different?

    Mr. Spencer is forgiven for his focus on those tenths of a degree anomalies, because that’s what he does for a living.

    And even though I claim a single global average temperature is mainly a climate propaganda tool, rather than useful information, the UAH compilation is a “check and balance” for the surface compilations — without UAH, the surface data would have eventually have “adjusted” the 1930s dust bowl in the USA, into a snow bowl, and people, (at least gullible leftists) would believe that lie
    .
    .
    For anyone less than 78 years old, fossil fuel burning has been adding a lot of CO2 to the atmosphere for your entire life, and although no one knows the exact effect of the CO2 on the temperature, the worst case is global warming of less than +0.8 degrees per century = totally harmless — pleasant, actually.

    Even if you cherry picked data from 1979 through 2018, the warming rate (with the cause unknown) was about +1 degree C. per CO2 doubling — predicting about +1 degree C. global warming in the next 125 years (with +3ppm per year CO2 growth rate), to the next 200 years (with +2 ppm per year CO2 growth rate) !

    Any way you look at it, PAST climate change was mild, and good news.
    There’s no logical reason to assume FUTURE climate change will be different

    The coming climate change “crisis” is only in the overactive imaginations of devious leftists, trying to scare people, and then claiming ONLY a more powerful central government is the “solution” to their imaginary crisis.

    Of course leftists always want a more powerful central government — and an imaginary coming climate crisis is their latest tool to get what they’ve always wanted !

    My climate science blog:
    http://www.elOnionBloggle.Blogspot.com

    ,today would

    • Craig T says:

      “Our planet is also significantly greening from more CO2 in the air.”

      Any evidence?

      • Craig T.

        I suppose your one challenge means you believed everything else included in my long comment?
        .
        So now I will refute you challenge, with one hand tied behind my back:
        .
        .
        .
        How about 3000+ real scientific experiments showing the greening effects of CO2 on plants ?
        .
        A 20-page summary of those experiments is here:
        https://www.heartland.org/_template-assets/documents/CCR/CCR-IIb/Summary-for-Policymakers.pdf
        .
        Better yet, read the whole 1,078 page report — we’ll wait here for your “book report”:
        http://climatechangereconsidered.org/wp-content/uploads/2019/01/CCR-II-Biological-Impacts-full-report.pdf
        .
        .
        .
        .
        My own blog articles, from May 11, on three recent experiments, are here:
        https://elonionbloggle.blogspot.com/2019/05/kaciene-et-al-2019-positive-influence.html
        .
        https://elonionbloggle.blogspot.com/2019/05/lahijani-et-al-2018-huge-potato-growth.html
        .
        https://elonionbloggle.blogspot.com/2019/05/manderscheid-et-al-2018-positive.html
        .
        .
        .
        .
        Thousands of greenhouse owners use CO2 enrichment systems, at their own expanse, to boost the growth of their own plants.

        Of course what could greenhouse owners know about growing plants?
        .
        .
        .
        .
        And there are NASA greening of the Earth satellite photographs at this link:
        https://www.nasa.gov/feature/goddard/2016/carbon-dioxide-fertilization-greening-earth
        .
        There’s no other logical explanation for the satellite measured greening of our planet,
        although I’m sure NASA GISS will claim there is — they just can’t stand any good news from global warming (I’m sure you feel the same).

        A few tenths of a degree warming didn’t do much to green the planet.
        .
        .
        .
        How about presenting a case for believing a climate change catastrophe is coming — tell us about those wild guess computer models — always wrong in the past — please explain why we should believe those computer game predictions of the future climate now, after three decades of wrong model predictions (wrong wild guess predictions are not real science, they are computer game junk science !)

        • Craig T says:

          “I suppose your one challenge means you believed everything else included in my long comment?”

          No, but it seemed like a good place to start. I’m not trying to repost my blog on another site.

          I’m sure there’s a lot in that Heartland Institute brochure that will improve plant growth. Can you give me a good example of documentation that plants are already “significantly greening”?

          • Richard Greene says:

            Craig T, you are a nas-ty, and wrong again.
            My comment here at 11:16 am EST was so long that I decided to reformat it and put it on my climate science blog at 11:41 am EST. So, in fact, I did not “repost my blog on another site”, I converted my comment here into a blog post 25 minutes later.

            I offered you links to documentation covering over 3,000 CO2 – plant growth experiments, including links to three recent experiments I tried to summarize in simple language on my climate science blog. You have to make some effort to learn — your snide remark, and refusing to read any of the links, doesn’t impress me.

          • Craig T says:

            I chose one link to your blog at random:
            https://elonionbloggle.blogspot.com/2019/05/kaciene-et-al-2019-positive-influence.html

            Your take on the paper:
            “CONCLUSIONS: The growth of oilseed rape, used for canola oil (there is no ‘canola’ plant) will be enhanced as temperatures warm, and atmospheric CO2 concentrations rise in the future, regardless of ozone (O3) levels, and oilseed rape will become more competitive against the invasive wild mustard weed too !”

            What the abstract says:
            “In conclusion it must be pointed out, that regardless improved competitive abilities of rape under FC and FC + O3 conditions, competition with wild mustard reduced growth, indicating increased weed-induced yield losses in the future climate, especially with concomitant intensification of O3 pollution.”
            https://www.sciencedirect.com/science/article/abs/pii/S0981942818305321

          • Richard Greene says:

            To Nas-ty Craig
            You don’t read an abstract and judge an entire scientific study by only that. Abstracts are notorious for being misleading and claiming results not proven in the paper. They are used to sell studies, not as tiny summaries for cheap-skates like you. I stand by my summary of the study as accurate. I have no reason to distort studies by real scientists and consider it insulting for you to suggest otherwise.Your sniping is like a yapping little doggie tearing at my pants cuff. You read nothing at the many links I provided and then character attack. A typical leftist. Pitiful.

          • Craig T says:

            Maybe I didn’t give your paper a fair shake because I could only see the abstract. I found another on the subject:

            Effects of Single and Multifactor Treatments with Elevated Temperature, CO2 and Ozone on Oilseed Rape and Barley
            https://onlinelibrary.wiley.com/doi/abs/10.1111/j.1439-037X.2011.00478.x

            “The treatment with elevated temperature significantly decreased all measured production parameters [of oilseed rape.] Although thousand seed weight decreased in all treatments, the decrease was only significant in the single factor treatments with elevated temperature and CO2 and in the combined treatment with high CO2, temperature and O3.”

            You are certainly a glass half full kind of guy.

          • David Appell says:

            Richard Greene says:
            You don’t read an abstract and judge an entire scientific study by only that.

            Everyone does it every day.

            Abstracts are notorious for being misleading and claiming results not proven in the paper

            What’s the evidence of that? I doubt it. Journal editors wouldn’t allow such a thing.

          • Mike Flynn says:

            DA,

            You wrote –

            “Everyone does it every day.”

            Where’s your proof? Name one who did it 8 days ago.

            You also wrote –

            “I doubt it” Who cares about your doubts? Are they especially potent, and eagerly sought after? I doubt it.

            Cheers.

          • Svante says:

            I did. You always review the scientific sources before you post here, don’t you?

          • Craig T says:

            David, Mike has you there. He never reads abstracts.

          • David Appell says:

            Clearly, yes.

            And I never read Mike.

    • Nate says:

      Richard,

      ‘predicts a FUTURE warming rate of about +3 degrees per century QUADRUPLE the ACTUAL warming rate while lots of CO2 was added to the atmosphere
      from 1940 through 2018.’

      You compare apples to oranges.

      Prediction: future warming rate.
      Observation: past warming rate, 1940-2018.

      What do the models predict the warming rate should have been 1940-2018, given the forcings over the period?

      If you don’t like predicting the past, fine. Look at how past predictions did.

      Go back to 1981, before much warming had occurred and look at model predictions for the next 40 y, and then what actually occurred.

      You will find a surprisingly good match to global temperature rise that actually occurred as well its spatial pattern.

      https://pubs.giss.nasa.gov/abs/ha04600x.html

      • Richard Greene says:

        Nate
        We have over 30 years of computer game predictions of roughly 3x more warming than actually happened since the 1970s.

        Only stupid people would continue to take the models seriously — they have been falsified for over 30 years — they are generally based on a formula from the 1970s that is obviously wrong, but is never changed (averaging +3.0 degrees C. TCS)

        Nate, the models are set up o look “right” on the warming rate from 1975 to 1995 — that’s why they look good for that period.

        They look foolish when backtested for 1940 to 1975

        They look even more foolish when backtested for 1910 to 1940.

        And they have looked foolish from early 2002 through 2018 where there was a flat
        temperature trend

        I have not compared apples to oranges, Nate — I consider that an insult.

        I have compared ACTUAL warming with rising CO2 the whole time with the FANTASIES of a completely different FUTURE warming rate from similar increases of CO2.

        I didn’t even mention the claimed logarithmic effect of CO2, which would imply a slower warming rate in the future.

        There are NO real models of the climate change process on this planet because the climate change process is not known with any precision.

        There has to be an accurate climate physics model to construct a real GCM model — no such climate physics model exists .

        There is no way to know what past climate change has been natural and what change is man made.

        There is no way to know a correct CO2 ECS or TCS.

        Wild guesses are not knowledge.

        Assumptions are not knowledge.

        Model predictions are not data.

        Especially when they are wrong.

        And you don’t cherry pick a 1981 start to prove models are right.

        • bdgwx says:

          Would you like to talk about Hansen’s 1988 modeling study?

          Or what about Willeit et. al. 2019? They did a pretty good job with modeling the last 3 million years.

          Do you have a reference to research in which a better match to reality was accomplished over the same time periods? We can talk about those too if you like.

          • Richard Greene says:

            bdg
            HANSEN PROVIDED THREE VERY DIFFERENT guesses of the future global average temperature, a number that he may have had influence on.

            If you make three guesses, and one looks close, that doesn’t mean anything.

            Not to mention that the temperature scenario that looked closest to what actually happened did not have the assumptions that best matched what actually happened.

            Like other astrologers, Hansen knew that if you make enough guesses, one is bound to look “right”.

          • David Appell says:

            Actually Hansen wasn’t far wrong:

            http://www.realclimate.org/index.php/climate-model-projections-compared-to-observations/

            PS: Hansen made “projections,” not guesses. The difference matters.

          • Mike Flynn says:

            DA,

            Here is a definition of projection –

            “an estimate or forecast of a future situation based on a study of present trends.”

            I suppose someone like Hansen could be stupid enough to believe he could forecast a future situation by examining the past. Rational people might make an assumption about the future, or guess. The future is unknowable, regardless of the quantity of sciency and slippery pseudoscientific misdirection you might bring to bear.

            Hansen sounds like just another incompetent fumbling bumbler to me, as regards his attempts to see into the future. Delusional.

            Cheers.

          • bdgwx says:

            Hansen wasn’t far off indeed. Hansen gave his model 3 different scenarios or inputs to compute: A, B, and C. None of these scenarios actually played out though. The scenario that actually played out was somewhere between B and C. So yeah, his model which used primitive technology and understanding (by today’s standards) was actually pretty close.

        • David Appell says:

          Richard Greene says:
          We have over 30 years of computer game predictions of roughly 3x more warming than actually happened since the 1970s.

          You can’t provide evidence to support that claim.

          • Mike Flynn says:

            DA,

            You wrote –

            “You cant provide evidence to support that claim.” And you can’t provide evidence to disprove it.

            Maybe he can’t be bothered providing evidence to a troll who is too lazy or incompetent to attempt to find relevant evidence for himself. I wouldn’t.

            Cheers.

      • David Appell says:

        I didnt even mention the claimed logarithmic effect of CO2, which would imply a slower warming rate in the future.

        Feedbacks change this to a linear trend (at least; slightly faster than linear in the next few decades).

      • Nate says:

        “We have over 30 years of computer game predictions of roughly 3x more warming than actually happened since the 1970s.”

        Well thats demonstrably False, Richard. Simply look at the paper I posted, which predicted warming from 1980-2020 of ~ 0.6C at the surface. In fact we had ~ 0.7C.

      • Nate says:

        “I have not compared apples to oranges, Nate — I consider that an insult.”

        I criticized what you posted, as often happens when you post on a blog.

        “Only stupid people would continue to take the models seriously”

        That is an actual insult, an ad-hom attack on me, and thousands of climate scientists.

        You see the difference, Richard?

        • Richard Greene says:

          I would think that you leftists were experts in character attacks, so I wrote using your own language.

          Models do not produce data.

          They produce whatever numbers the programmers want to see.

          That makes GCMs a huge waste of taxpayers’ money:
          — They failed miserably when backtested on the 1919 to 1940 warming period
          — They failed miserably when backtested against 1940 to 1975 cooling
          — None predicted the flat global average temperature trend from 1998 through 2018
          — As a group (see link at my last comment), except for one Russian model, they grossly over-predicted actual warming since the 1970’s and continue to predict a future warming rate of about +3 degrees C. per century, compared with an actual global warming rate from 1940 through 2018 of about +0.8 degrees C. per century.

          Most important is that the causes of climate change are not known with any precision — there is no accurate climate change physics model, therefore, building a GCM model is IMPOSSIBLE.

          Actual GCMs are opinions, not actual models of the actual climate change process on this planet — that’s one reasons the predictions are so far from reality.

          Therefore the people who present GCMs (glorified weather forecasting models) as real models, are science frauds, and they DESERVE to be character attacked for promoting government policies based on their science fraud (the claim of being able to predict the future climate, and the claim that future global warming MUST BE bad news, in spite of the fact that past global warming has been good news for hundreds of years.

          And for this science fraud, government bureaucrats with science degrees are rewarded with good salaries, good pensions, and job security — sometimes also attention in the mainstream media and the ability to virtue signal to everyone they know that they are ‘trying to save the earth for the children’ (which is nonsense, but sounds good).

          And even better — the bureaucrats who make scary global warming predictions, also own the historical temperature data, so they can “revise” history at will, to better match their scary predictions — a huge conflict of interest — but revise the past, they certainly do, and almost every revision results in a higher rate of global warming, created out of this air.

          And that is more science fraud … for even more job security..

          • bdgwx says:

            Can you define “failed miserably” objectively?

            Can you provide a link to what you are looking at to make the “failed miserably” claim?

            I’d like to review what you are looking at.

          • Richard Greene says:

            bdgwx
            I provides a link about six inches of column north of here, before your question.

            I’ll do it again so you don’t have to strain your eyes:

            https://elonionbloggle.blogspot.com/2019/05/climate-models-versus-reality.html

          • bdgwx says:

            test

          • bdgwx says:

            I’m truly sorry. It seems that the filter is being a major impediment to my response. I haven’t figure out what the issue is yet.

          • bdgwx says:

            Let’s try this again without getting into any details (which the filter may be blocking).

            Let’s dismiss the fact that several scientists have expressed concern over the potentially misleading nature of this chart. Would you say “failed miserably” is a deviation between prediction and observation of 0.10C/decade or more over any 30-40 year period?

    • Nate says:

      Richard,

      Hint:

      ‘Of course leftists always want a more powerful central government — and an imaginary coming climate crisis is their latest tool to get what they’ve always wanted !’

      This kind of comment does not give anyone confidence that your appraisal of climate science literature will be objective and unbiased.

      Thus ‘nas-ty’ Craig is then absolutely justified in being suspicious when what you say about a paper and what the abstract says is in a paper are very different!

      You reap what you sow.

      • Craig T says:

        How did Richard Greene know my rap name was “Nas-T”?

        • Richard Greene says:

          Okay, then “Nas-T” Craig, it is.
          I see you have a sense of humor.
          So now I’m disappointed.
          My nickname is
          “Lazy Retired Bum”
          (from the wife)
          My pet name for her is:
          “Bellowing Bertha”

      • Richard Greene says:

        NATE:

        The false claim of “knowing” the future climate, and “knowing” it will be bad news, and “knowing” only a mote powerful central government can prevent that bad news … has nothing to do with real science. That’s leftists politics.

        Ignoring the leftist politics of the climate change science fraud would be ignoring the primary purpose of the climate scaremongering.
        .
        .
        .
        Nate, anyone who believes nas-ty Craig’s attack on me is not a good judge of character.

        Craig falsely claimed I deliberately twisted my summary of a study that I summarized in a blog post. If I had misinterpreted a study I would be the FIRST person to want to know that so I could correct my blog post and leave an apology for misinterpreting. But I did not misinterpret a study (whose results are similar to thousands of other studies — it’s not like there were any surprising results) .

        Of course nas-ty Craig NEVER read the study.

        He only read the abstract.

        I tried to educate him (impossible?) by warning him that abstracts are NOT known to be accurate summaries of studies.

        There have actually been studies to prove that !

        Did the study abstract match the study itself — I don’t care — I never read the abstract –Because I read the study !

        Most important is that nas-ty Craig didn’t even bother read my relatively brief summary of the study on my blog — apparently my first paragraph was enough to set him off !

        If Craig had continued reading, he would have noticed:

        My one paragraph conclusion is supported by what the study authors concluded — I had included two paragraphs of their conclusions — direct quotes — so people could judge if I had misinterpreted the study !

        That was not enough to stop nas-ty Craig from jumping to a conclusion that I had misrepresented a study on my blog, and now you have piled on to Craig’s false claim like a trained parrot — You didn’t read the study either, and you didn’t even read my brief summery of the study — you just jumped to a fast, false conclusion about my character, thereby making your own character seem questionable ! Great job shooting yourself in the foot, Nate !
        .
        .
        Quotes from my blog post on May 11, 2019 are below the link:
        https://elonionbloggle.blogspot.com/2019/05/kaciene-et-al-2019-positive-influence.html
        .
        .
        “CONCLUSIONS (my conclusion)
        The growth
        of oilseed rape,
        used for canola oil
        (there is no “canola” plant)
        will be enhanced
        as temperatures warm,
        and atmospheric
        CO2 concentrations
        rise in the future,
        regardless of
        ozone (O3) levels,
        and oilseed rape
        will become more
        competitive against
        the invasive wild
        mustard weed too ! ”
        .
        .
        Quotes from the study,
        Kaciene et al. (2019),
        that followed my conclusion :
        .
        The authors say their results
        “revealed that elevated CO2
        and temperature stimulated
        rape’s growth: biomass of root
        and shoot, leaf area as well as
        accumulation of soluble sugars
        significantly increased.”
        .
        .
        .
        But the authors report that
        “the competitiveness of rape
        increases more than that
        of the wild mustard”
        (with elevated CO2 & temperature)
        indicating this important
        agricultural crop will have
        a greater competitive advantage
        over wild mustard in the future”

        • Craig T (Nas-T) says:

          “Most important is that nas-ty Craig didn’t even bother read my relatively brief summary of the study on my blog apparently my first paragraph was enough to set him off !”

          Above I quoted the last sentence of your blog claiming that oilseed rape “will have a greater competitive advantage over wild mustard in the future

          According to the paper, oilseed rape doesn’t suffer from competition with wild mustard under current conditions. The fact that higher CO2 and temperatures makes rape rape more competitive than wild mustard doesn’t change the paper’s conclusion that farmers should expect “increased weed-induced yield losses in the future climate.”

          As I said before, that does seem to be an important point you left out.

          I need to wrap up. Our Leftist Cell is having a pot luck tonight and I plan to bake a load of hammer and sickle shaped cookies for the comrades.

          • Richard Greene says:

            Nas-T
            Now you are embarrassing yourself … again
            You really have to read the study — even then some studies are hard to follow.
            .
            .

            oilseed rape will have a greater competitive advantage over wild mustard in the future”

            .
            .
            Here’s what that means, and I will type…slow…so…even…you…can…understand:

            Oilseed rape now competes with a weed called wild mustard.

            Oilseed rape will compete with wild mustard in the imagined future with more CO2 in the air and warming.

            More CO2 in the air and warming will improve the oilseed rape growth.

            More CO2 in the air and warming will improve the wild mustard growth too

            But, and that’s a BIG B-U-T-T, the more CO2 in the future air and warming will benefit the oilseed rape MORE than it will benefit the wild mustard weed, thereby giving the oilseed rape a bigger competitive advantage over wild mustard in the future.

            You just have to trust me, as an editor of an economics newsletter for paid subscribers since 1977, that ” competitive advantage” is good news !
            .
            .
            As I said in my summary of the study, QUOTING THE AUTHORS:

            “the competitiveness of rape
            increases more than that
            of the wild mustard”
            (with elevated CO2 & temperature)
            indicating this important
            agricultural crop will have
            a greater competitive advantage”

            There are thousands of studies showing the positive effect of CO2 on C3 plants.

            Most professional greenhouse owners buy and use CO2 enrichment systems for inside their greenhouses — atypical goal is 1,000 ppm.

            Do you think they are all fools, wasting their own money on CO2 enrichment systems that do nothing for their plants?

          • Craig T says:

            Richard Greene said:
            “Oilseed rape now competes with a weed called wild mustard.”

            Paper Abstract said:
            “Competition had relatively little effect on growth of both species at current climate, independent of O3 treatment. In contrast, competitive effect of both plant species considerably increased under FC, and especially FC + O3 conditions, when growth of mixed culture rape reduced up to 48% and that of wild mustard up to 80%.”

            Richard Greene said:
            “Most professional greenhouse owners buy and use CO2 enrichment systems for inside their greenhouses atypical goal is 1,000 ppm.
            Do you think they are all fools, wasting their own money on CO2 enrichment systems that do nothing for their plants?”

            By itself increased CO2 is better for plants. But the continuing increase of CO2 brings with it other changes to climate. After looking at several oilseed rape/CO2/Temp papers the results seem a wash. Some see slight benefits other slight losses. Like this paper, others mention problems with increased weed competition. None of them paint as rosy of picture as your summation of that paper, including that paper.

        • Nate says:

          ‘The false claim of knowing the future climate, and knowing it will be bad news, and knowing only a mote powerful central government can prevent that bad news’

          No scientists claim they ‘know’ things, that is your strawman.

          Making predictions is what science does, Richard. Then the predictions are compared to observations, data.

          You seem confused about what science does.

          • Bill Hunter says:

            Nate says:
            May 20, 2019 at 5:54 AM
            “Making predictions is what science does, Richard. Then the predictions are compared to observations, data. You seem confused about what science does”.

            Gee, Nate I didn’t know Nostradamus was a scientist! I thought they kicked the astrologers out a long time ago.

          • Nate says:

            ‘Scientists make predictions’

            ‘Nostradamus made predictions’

            ‘Nostradamus was a scientist’ ??!

            Simple logic fail, Bill.

          • bill hunter says:

            Typical liberal defining people in ways that support their arguments. LOL!

            You just said: “Making predictions is what science does”. If thats true then it is true Nostradamus was a scientist.

          • Craig T says:

            The difference between scientists and Nostradamus is how the predictions are made. Technically scientists make hypotheses that test theories.

          • Nate says:

            Liberals poop.

            Bill Hunter poops.

            Bill Hunter is a liberal.

            C’mon Bill, just stop while you’re behind.

          • bill hunter says:

            Craig T says:
            May 22, 2019 at 6:02 AM
            The difference between scientists and Nostradamus is how the predictions are made. Technically scientists make hypotheses that test theories.

            Then are climate scientists scientists? If so kindly provide a citation to the test that proves CO2 warms the surface with a pre-feedback sensitivity of 1 deg C per doubling.

            Nope can’t do that? The main difference between todays scientists and astrologists is they have computers to handle a lot more data but that isn’t necessarily a help if your theory is hogwash.

          • Craig T says:

            Observational determination of surface radiative forcing by CO2 from 2000 to 2010
            http://asl.umbc.edu/pub/chepplew/journals/nature14240_v519_Feldman_CO2.pdf

          • Bill Hunter says:

            Svante – There must literally thousands of temperature reconstructions. The one thing they all have in common are error bars that extend from no warming to a lot of warming. Since the LIA can be verified by such things as recorded dates of ice breakups, freeze overs, crop failures, ice skating on the Thames, and literally thousands of examples of such we know warming occurred but are unsure as to when. Thermometers in the UK suggest a lot of warming in the early 18th century, followed by a lot of cooling then warming again in the second half of the 19th century.

            I am rather keen on a theory floating around NOAA for a long time of magnetic changes in the earth sun relationship that steers ocean currents. That along with identification of a possible solar oscillations at 11 year and 88 year periods (if they are not just randomly created as the 88 year period is roughly in time with the orbit of the largest planet in the solar system Jupiter) Magnetic and/or cosmic ray disturbances could account for the gentle long term warming trend we have seen of .7degC/century over the course of the last 130 years. Yes, take shorter periods and you can find a lot more warming and a lot less and even cooling. My guess is about the time we get a handle on the 88 year cycle if it exists will probably be about the time we get slammed with something a lot longer than comes right out of the dark. My view is allow the human race to decide these things individually. A bit more warming is almost certain to be a net good thing. the naysayers have a far lousier track record. And if you really want to botch it up give the job to the government. . . .especially a world government that would be controlled by the representatives of the people in the world who don’t have a vote.

  19. Rune Valaker says:

    Dr. Spencer why are You ignoring OHC in Your blog post. For years we have been told that there was i hiatus in global warming (after the 98 – Nino) and now we are told that the 16 – Nino is responseable for the latest warming. And BTW, isn’t Nino’s a natural fenomen where every new supernino raises the level a notch up? Was that common when we had about 280 PPM in the past? What’s Your point?

    • Richard Greene says:

      I’m not a doctor, or named Spencer, but here’s my take:

      Starting or ending a temperature change measurement with an El Nino peak-affected year is misleading.

      Of course the global warming nuts LOVE heat from El Ninos.

      I think it would be more accurate to state that the period from 2002 through 2018 had no statistically significant warming, using UAH compilations, and their claimed margins of error.

      Most important, for CO2 haters, in the era of man made CO2 we had three trends:
      Global cooling — 1940 to 1975
      Global warming — 1975 to 2002
      No trend — 2002 through 2018

      So I ask the “science is settled” folks (by the way that phrase is as anti-science as any statement I’ve ever heard — better yet, wear a T-shirt that says “I’m not very bright”)
      to tell me if CO2 causes cooling (1940 to 1975)

      … or does CO2 cause warming (1975 to 2002)

      … or does CO2 have no obvious effect on the global average temperature (2002 through 2018) ?

      Please tell me which trend is “right” !

      Because I’m unsettled, by not knowing the “right” answer

      • Craig T says:

        “So I ask the ‘science is settled’ folks … to tell me if CO2 causes cooling (1940 to 1975)
        or does CO2 cause warming (1975 to 2002)
        or does CO2 have no obvious effect on the global average temperature (2002 through 2018) ?

        Please tell me which trend is ‘right’ !”

        How about you consider that CO2 was not the only climate forcing during this time. SO2 caused cooling between 1940 and 1975.
        https://wattsupwiththat.files.wordpress.com/2015/05/global-so2-emissions-jsmith.png

        • Richard Greene says:

          Craig — I suppose all the SO2 — which apparently overwhelmed the effect of Co2 for 35 years — suddenly all fell out of the air in 1975 when the cooling trend reversed to a warming trend.?

          Don’t make me laugh so hard !

          In fact, SO2 emissions continued rising after 1975 and stayed high for the next 15 years — and SO2 emissions had declined little by 2000.

          So I guess SO2 caused global cooling from 1940 to 1975 and then caused global warming from 1975 to 2000 ?

          Craig, you have to try harder !

      • bdgwx says:

        Richard,

        FWIW using the UAH data the trend from 2002 through 2018 is about +0.122C/decade which isn’t that much lower than +0.128C/decade for the entire UAH dataset.

        There is no one cause for any temperature response. The cause is always the net effect of all climate forcing agents. The only thing we can say about CO2’s relationship with the temperature for any particular period is to estimate the transient climate response (TCR) that it is attempting to induce. For example, if CO2 induced a +0.2C effect but some other combination of agents induced a -0.2C effect for the same period then the net change in temperature would be 0.0C.

        Do you want to know what kind of “nudge” CO2 was putting on the climate system during the periods you asked about? If so I believe I can show you how to calculate it yourself.

        • Richard Greene says:

          bdgwx

          I am comparing early 2002 temperatures with late 2018 temperatures — NOT the trend from 2002 through 2018.

          By comparing two points in time I was NOT including the significant warming effect of the late 2015 / early 2016 El Nino, which is a huge Pacific Ocean heat release, not known to be related to man made CO2

          The temperatures were similar in early 2002 and late 2018 — certainly less than 0.1 degree C. different.

          If I wanted to count a few El Nino heat releases, I would have compared 1998 with 2018 — also similar.

          I suspect in a few years, or decades. the 15 to 20 year “pause” will have been adjusted and re-adjusted out of the history books — the adjustments already started in 2015.

          • Craig T says:

            So you aren’t bothered that 2002 was during an El Nino and 2018 a la Nina year?

          • bdgwx says:

            Yes. You are correct. If you compare a single sample from early 2002 with a single sample from 2018 then you can conclude that the temperature didn’t change much. And that’s a fair conclusion. There are actually dozens of these pause periods that you can choose from. In fact, if you pick your starting and ending points just right you can even find a bunch of periods in which the temperature decreased. And yet despite all of these pause and decrease periods the UAH trend is still +0.13C/decade for the lower troposphere. How do you think that happens?

            By the way, I did a linear regression from 2002 to 2018 using about 200 monthly samples. Do you feel that my methodology is inferior to one that only uses 2 monthly samples? If so, why?

            What adjustments have occurred after 2015 that UAH, RSS, NASA, NOAA, JMA, Cowtan&Way, Berkeley Earth, and the dozen or more reanalysis datasets have all made that you feel are not appropriate?

            What comments can you make about oceanic heat content during “the pause” period?

            What evidence can you present that supports the hypothesis that global warming has no impact on ENSO cycles?

        • Richard Greene says:

          I posted a longer comment about 2002 versus 2018 that never showed up here.

          I compared the average UAH anomaly for the first six months of 2002 ( +0.26 degrees C. ) versus the average UAH anomaly for the first six months of 2018l 9 ( 0.23 degrees C. )

          The result was that first half 2002 was cooler than first half 2018.

          But I don’t like to use hundredths of a degree anomalies.

          So I either say the trend between those two six month periods was “flat”, or I say the warming was “statistically insignificant”.

          Comparing those two six month periods eliminate the misleading effect of the strong late 2015 / early 2016 EL Nino, which has nothing to do with CO2-caused global warming.

          So, when people deny the flat trend / pause / hiatus, I just tell them the warming was statistically insignificant between 2012 and 2018 .

          The warming in the trend line is mainly from the EL Nino — a temporary climate event unrelated to CO2 — so including it is only for propaganda — biased science) ( just like starting a temperature comparison from 1998, which also had a huge El Nino heat release, would be propaganda, and biased science).

      • David Appell says:

        No trend 2002 through 2018

        That false.

        The trend in UAH LT over that time is +0.14 C/decade.

        • Richard Greene says:

          Your trend includes the heat from a huge EL Nino.

          It’s a local event.

          It’s a temporary event.

          It’s not related to CO2, or any other greenhouse gas.

          You know that, but don’t care.

          The average UAH anomaly for the first six months of 2002 (+0.23 degrees C. )is about the same as the average for the first six months of 2018 (+0.26 degrees C.).

          That’s a flat trend, and not distorted by a huge El Nino.

          Comparing the two six month periods eliminates the temporary, local, EL Nino heat peak, that does affect the trend line, but has nothing to do with the temperature in 2018.

          • bdgwx says:

            Who cares if it includes the warming from an El Nino or the cooling from a La Nina. The linear regression trend is what it is.

            I ask the question again…why is that you believe your method of computing a trend for a period (which you cherry picked by the way) and which uses only a subset of the available data points is viewed more favorably to our (David and I) method that uses ALL data points?

      • Rune Valaker says:

        And here’s my take. Deniers have loved the 98-Nino until the 16 – Nino destroyd their case.

        • David Appell says:

          Rune Valaker says:
          And heres my take. Deniers have loved the 98-Nino until the 16 Nino destroyd their case.

          So true.

        • Richard Greene says:

          Valakar:
          I strongly prefer to be a coming climate change catastrophe denier, as I have been since 1997, than a science denier like you.

          Real science means you don’t start, or end, temperature comparisons with an unusually strong El Nino heat peak year.

          In 2018 some coming climate change catastrophe skeptics used the late 2015 / early 2016 El Nino heat peak as a starting point to claim the temperature had fallen for a few years.

          I was the first person to criticize that deliberate distortion.

          What you climate alarmist science deniers don’t know, is that the future climate can not be predicted.

          What you climate alarmist science deniers don’t know is that we have 78 years of experience with rising CO2 levels and 78 years of real time temperature measurements.

          We have real evidence of what was happening while CO2 levels increase — we don’t know if CO2 caused any of the warming, because we have experience with a similar warming period, in the same century, accompanied by little CO2 increase.

          In fact, we have 20,000 years of “experience” with global warming, starting with Canada, Chicago and Detroit under a thick glacier … which all melted in the next 10,000 years, and the climate 10,000 years ago is believed to have been a few degrees WARMER, during the Holocene Optimum, than it is now.

          Where you climate alarmists go very wrong is not having the ability to say “we don’t know” on the subject of real climate science.

          In science, “we don’t know” if often the correct answer.

          You just don’t get it — the climate in 100 years could be warmer or cooler — no one knows the “truth” — except for liars.

          • Rune Valaker says:

            You will not find one single comment from me where I predict a “coming climate change catastrophe.” I have no problems with the HTO and the fact that we have decadal variations. But what You do not seem to understand is that we now are in a long time cooling phase in the M – cykels, and that there is no natural reasons for the temperatures to rise 1 C the last 80 – 90 years.

      • Nate says:

        Richard,

        FALSE.

        Look at the data. They are clearly not consistent with your description:

        Global cooling — 1940 to 1975
        Global warming — 1975 to 2002
        No trend — 2002 through 2018

        http://www.woodfortrees.org/plot/best/from:1970/mean:12/trend/plot/best/from:1940/mean:12

        1940-1975 is ‘No Trend’

        Warming trend clearly continues after 2002.

        • Richard Greene says:

          Keep changing the historical surface data, and you can present any numbers you want to present to the public;

          Examples
          https://elonionbloggle.blogspot.com/2019/05/adjustin-temperature-what-nasa-said-in.html

          https://elonionbloggle.blogspot.com/2019/04/in-1987-nasa-giss-claimed-05-degrees.html

          https://elonionbloggle.blogspot.com/2019/04/nasa-giss-january-1910-versus-january.html

          https://elonionbloggle.blogspot.com/2019/04/past-temperatures-keep-changing-history.html

          https://elonionbloggle.blogspot.com/search?updated-max=2019-04-25T10:22:00-04:00&max-results=20&start=22&by-date=false

          UAH satellite data must be used starting in 1979.

          — Far less infilling

          — Far less after the fact repeated “adjustments”
          .
          .

          The surface data includes a majority of grid cells with no temperature data or missing temperature data so the missing numbers are filled in by government bureaucrats with science degrees who git their jobs by predicting a coming global warming crisis — so why would anyone trust the infilling and repeated “adjustments” by people who want their global warming predictions to come true?

          https://elonionbloggle.blogspot.com/2019/04/for-land-areas-on-chart-gray-signifies.html

        • Nate says:

          Richard,

          Basically you are saying that your hypothesis and posts are proven correct, as long as we disregard all the half-dozen surface data sets.

          If you have to disregard most of the data to make your argument work, you are not winning the argument.

          ‘the missing numbers are filled in by government bureaucrats with science degrees who git their jobs by predicting a coming global warming crisis’

          If you have to invent silly conspiracy theories, you are not winning the argument, either.

          • Bill Hunter says:

            This mine is bigger than yours kind of arguing never gets anywhere. Lets just accept that there is a huge amount of uncertainty even over what the global mean temperature is both today and in the past. Problem obviously is we are looking for a signal that is too small to reliably detect and efforts need to continue to try to make a record that actually produces a reliable long term trend.

            That leaves three ways to achieve conclusions on global warming, either warming catches up with what modelers are adamantly trying to sell to politicians which may be adequate to narrow differences between the various records, or cooling commences which throws the whole thing into a non-political issue, or we learn how to measure earth’s temperatures reliably and in a random manner that is representative. Satellites have no issues with the last requirement, surface records are hopelessly polluted by it.

          • Nate says:

            ‘or we learn how to measure earth’s temperatures reliably and in a random manner that is representative. Satellites have no issues with the last requirement’

            If there is a problem with certain surface measurements at some sites, it does not change the global average very much.

            The problem with the satellites is that, although they sample more locations, if there is an instrumental error, it is systematic error that affects ALL the data.

            That is why there have been dramatic changes over time in the satellite trends when a systematic error is found and addressed.

            Even today the systematic error is addressed differently by different groups, so the difference in trends reported by different groups is huge!

            Much larger than differences in the surface trends reported by a half dozen different groups.

          • Bill Hunter says:

            Nate says: “If there is a problem with certain surface measurements at some sites, it does not change the global average very much.”

            You are ignoring the first rule in statistical sampling that the sample must be representative. Satellites do that surface station networks don’t and were never designed in the first place to be representative.

            Take UHI for example. Surface stations far over represent human development. While that human development, streets, airports, fire stations etc. aren’t sufficient to change the real global mean temperature, they are so heavily represented in the surface station networks they can affect the results derived from them. Satellites don’t have that problem.

            Nate says:

            “The problem with the satellites is that, although they sample more locations, if there is an instrumental error, it is systematic error that affects ALL the data.”

            A problem that is fixable. Systematic problems are the easiest to deal with. That doesn’t mean they are easy but at least there is hope of getting correct and representative readings.

            Nate says:
            “Even today the systematic error is addressed differently by different groups, so the difference in trends reported by different groups is huge!”

            Yep you are right about that and those groups need to carefully consider what they are doing and find ways to validate the correct answers. Seems the main differences boil down to just a couple of variables, drift and instrument type. . . .almost an infinitely simpler problem than the surface station data problem.

          • Nate says:

            “Satellites do that surface station networks don’t and were never designed in the first place to be representative.

            Take UHI for example. Surface stations far over represent human development. ”

            Of course there are many more stations near human development, that is why they DO NOT do a simple average of all thermometers.

            It seems like you guys assume the scientists are simpletons who have not worried about sampling temperature properly to avoid just such problems.

            Several groups have looked into this, eg Berkeley Earth, using DIFFERENT approaches to sampling. Still, not much change in trend was produced with their approach, compared to the others.

          • Bill Hunter says:

            Nate says: —- Of course there are many more stations near human development, that is why they DO NOT do a simple average of all thermometers. It seems like you guys assume the scientists are simpletons who have not worried about sampling temperature properly to avoid just such problems.—–

            Nate you need to read my comments to Svante above today and yesterday. I am relatively fine with the entire range of temperature records. None of them IMO show a clear problem. The problem is how much we have extrapolated these trends into the future over a very short period of time and how we dream up ways for it to accelerate when we know essentially zero about what the future holds for climate. And I explain that above also.

            My personal belief is that climate change is primarily controlled by ocean circulation patterns and the major variables are water vapor and clouds. Causation of changes in those variables is poorly understood and warming trends for a hundred years or so are totally unremarkable in view of the data that we have if we look closely at the raw data untouched by the fingers of special interests. Take ice core “noise”. Or noise is what the special interests call it as they love to call anything they are 100% ignorant about noise to avoid admitting they are ignorant. I look at as a seasoned auditor and ask myself WTF is that? Rest assured I am ignorant. But what it is if you look closely at it in the ice core data is a variation in temperature of approximately 2 to 3 degrees C that has a frequency of a few hundred years. Pollution in the data? Maybe. Real? Maybe. How do we learn what it is? Good question. First off the bat we need more research into both the greenhouse effect and data from the ocean bottoms because that might hold they key to the causation. Currently we can’t distinguish between noise and up to 2 or 3 degrees of climate variation.

            Then we have the doomsday squad that claims 3 degrees warming in a century that would be catastrophic. We are a people that completely for all practical purposes rebuild ourselves on less than a 100 year scale. Most animal populations rebuild themselves on a shorter time scale as they might be limited to digging a burrow and the next generation digs theirs. Some vulnerable species will go extinct but we aren’t doing a bad job of reversing that with the ESA, especially with the charismatic megafauna.

            We are by the most aggressive measure at 1.5 degrees in a 160 years of the industrial revolution and what has happened so far? The human race is flourishing!!!!!!!!!!!! By less aggressive measure we are at half that. Get real! Population is a real concern so we have to continue to improve monitoring our impacts and gaining better resolution and fact about what impacts we are having and what nature has in store for us.

            Several groups have looked into this, eg Berkeley Earth, using DIFFERENT approaches to sampling. Still, not much change in trend was produced with their approach, compared to the others.

  20. RW says:

    Roy,

    How can you presume or know the natural influence was warming?

  21. CO2isLife says:

    “However, above Antarctica the top‐of‐atmosphere (TOA) spectra look different; the spectra yield a maximum in the CO2 band.”

    What a bunch of nonsensical mumbo jumbo. Sophistry at its best. Ground measurements are 5tf off the ground, far far far removed from the stratosphere. Wind Currents completely disassociate the ground climate with the stratosphere.

    • Craig T says:

      Just claiming a cold Antarctica proves CO2 doesn’t cause warming without looking at the details is sophistry at a mediocre level.

      • Richard Greene says:

        Wrong again Craig

        The lack of warming in Antarctica is evidence that CO2 is not doing what it was claimed to do.

        The warming in the Arctic is evidence that CO2 is doing what it is claimed to do.

        The minor local warming of some edge areas of Antarctica’s glacier is evidence that nearby underseas volcanoes cause warming in their vicinity.

        CO2 could not cause warming in that pattern.

        A greenhouse gas should cause the most warming in cold, dry areas — the lack of Antarctica warming is contrary evidence.
        ,
        As far as “proof”, there is no scientific proof that CO2 ever caused ANY warming in the troposphere — that is merely an assumption, based on infrared spectroscopy lab experiments using dry air (that is not found anywhere on our planet).

        Assumptions are not scientific proof. even if stated with great confidence, by many people.

        Even if I believe that CO2 may have caused some unknown amount of warming, that does not make it so.

        • bdgwx says:

          CO2, like pretty much all polyatomic molecules, blocks IR radiation. In central Antarctica where the stratosphere is often warmer than the surface this means the effect works to block more DWIR than UWIR. An increase in GHGs work by steepening the lapse rate. If the lapse rate is positive it makes it more positive. If the lapse rate is negative it makes it more negative. There are, of course, other factors in play in the Antarctic region. CO2 is just one among many climate forcing agents. The final temperature response is the net effect of all of them.

          https://tinyurl.com/y76vswpx

          • Richard Greene says:

            Water vapor, the primary greenhouse gas, absorbs and reradiates some of the same infrared wavelengths as CO2.

            Yet infrared spectroscopy uses artificially dry air in a closed system.

            In the atmosphere there is water vapor.

            So it is only an assumption that lab test results can be applied to the atmosphere, not a fact.

            If CO2 causes global warming, that effect is also not visible in global average temperature observations, as there has been a huge amount of warming since 20,000 years ago, that had nothing to do with CO2.

            Assumptions based on simple lab tests should never be used to drive government policies.

            The future climate is unknown — anyone who claims to know exactly what causes climate change, and what the average temperature will be in 100 years, is a liar.

            Our current Holocene interglacial could end tomorrow, or in a thousand years — no one knows.

            But we do know that interglacial have been short-lives pleasant climate period.

            Wouldn’t the world be a better place if adding CO2 to the atmosphere offset the cooling at the end of our interglacial.

            Our C3 plants certainly would prefer double or triple the current CO2 level — better C3 plant growth = fewer people malnourished and starving.

            Adding CO2 to the air, when using modern pollution controls, is the best thing humans have ever done (unintentionally) to improve the ecology of our planet.

            Only a fool would want the past 300+ years of mild pleasant global warming to stop, along with the significant greening of our planet.

            Only a fool would claim the climate in 1750 was good, and the climate today is bad.

            Are you such a person?

          • Mike Flynn says:

            b,

            You wrote –

            “CO2, like pretty much all polyatomic molecules, blocks IR radiation.”

            I am sure that you that you think this is a exceptionally deep and profound statement. What is your point? Bananas block IR radiation. How deep and profound is that?

            Maybe you think you are giving the primary reason for the cooling of the Earth’s surface over the last four and a half billion years?

            All very cryptic. Have you any good reason for making such pointless and irrelevant statements?

            Cheers.

          • David Appell says:

            Richard Greene says:
            “Our C3 plants certainly would prefer double or triple the current CO2 level better C3 plant growth = fewer people malnourished and starving.”

            What science says this?

            Because you can’t get higher CO2 without higher temperatures and changes in the hydrological cycle.

          • Mike Flynn says:

            DA,

            You wrote –

            “What science says this?”

            Oooooh! That’ll fix him, eh? On the other hand, others might think you are just posing stupid gotchas, or are too lazy, stupid or incompetent to find out for yourself.

            By the way, “science” says nothing. Anybody appealing to the authority of “science” is likely to be a pseudoscientific cultist who is unable to back up their claims of impending doom with real scientific research.

            Carry on, DA.

            Cheers.

        • David Appell says:

          Richard Greene says:
          As far as proof, there is no scientific proof that CO2 ever caused ANY warming in the troposphere that is merely an assumption, based on infrared spectroscopy lab experiments using dry air (that is not found anywhere on our planet).

          What you mean is YOU don’t know of any such proof.

          Others do know about it:

          “Increases in greenhouse forcing inferred from the outgoing longwave radiation spectra of the Earth in 1970 and 1997,” J.E. Harries et al, Nature 410, 355-357 (15 March 2001).
          http://www.nature.com/nature/journal/v410/n6826/abs/410355a0.html

          Radiative forcing measured at Earths surface corroborate the increasing greenhouse effect, R. Philipona et al, Geo Res Letters, v31 L03202 (2004).
          http://onlinelibrary.wiley.com/doi/10.1029/2003GL018765/abstract

          “Observational determination of surface radiative forcing by CO2 from 2000 to 2010,” D. R. Feldman et al, Nature 519, 339343 (19 March 2015).
          http://www.nature.com/nature/journal/v519/n7543/full/nature14240.html

          More papers on this subject are listed here:
          http://agwobserver.wordpress.com/2009/08/02/papers-on-changes-in-olr-due-to-ghgs/

          • Richard Greene says:

            Lot’s of scientists make claims.

            There is no scientific proof that CO2 caused any of the warming since 1975 because the warming was intermittent, nothing unusual compared to natural climate change, and there no significant warming of Antarctica, which should have had as much warming as the Arctic.

            I hate to break this to you but most of everything scientists have ever said throughout history had proven to be wrong — otherwise science would be “settled” and we would not need scientists today !

            Appeals to authority don’y interest me.

          • David Appell says:

            Richard Greene says:
            There is no scientific proof that CO2 caused any of the warming since 1975 because the warming was intermittent, nothing unusual compared to natural climate change, and there no significant warming of Antarctica, which should have had as much warming as the Arctic.

            How many times do you need to data shoved in your face?

          • David Appell says:

            Appeals to authority dony interest me.

            Citing research is the OPPOSITE of “appealing to authority.”

            You think if you write that you can ignore all the research on CO2 and temperatures.

            Wrong. Very wrong.

        • Craig T says:

          “As far as ‘proof’, there is no scientific proof that CO2 ever caused ANY warming in the troposphere that is merely an assumption, based on infrared spectroscopy lab experiments using dry air (that is not found anywhere on our planet).”

          No. In fact mixtures of CO2 and H2O were measured together as early as 1954 and found to match well with calculations adding the absorρtion of each.

          “Most of the absorρtion bands of CO2 occur in the so – called windows between the 1^0 absorρtion bands. There is, however, one notable exception. As can be seen in Figure 49, the two bands of CO2 at 2.7 microns occur in the same spectral region as the 2.7 micron bands of H2O, A study of the effect of mixtures in the absorρtion cell of CO2 and H2O was the therefore made. The circles indicate the calculated spectrum obtained at each frequency by assuming that the two components absorb independently of each other, that is, that the resultant transmission is the product of the transmissions of each component. The excellent agreement of the two curves indicates that this assumption is valid.”
          https://etd.ohiolink.edu/!etd.send_file?accession=osu1485276378226122

          • Richard Greene says:

            Laboratory closed system experiments are NOT proof of what actually happens in the atmosphere.

            That was my point.

            You can assume lab experiment apply to the atmosphere, and many people do.

            I would say the assumption that CO2 causes some warming in the atmosphere is a reasonable assumption.

            The amount of warming is unknown

            Actual warming since 1940, and the lab experiments, suggest the worst case would be mild, harmless, global warming.

            We had warming from 1910 to 1940 that was similar to 1975 to 2000 (about two-thirds as much), which could not be blamed on man made CO2.

            We had a steep decline in fossil fuel use, and CO2 emissions, during the Great Depression, with no obvious effect on the global average temperature.

            Why would two warming periods in the same century (1910 to 1940, and 1975 to 2000) have two completely different causes, as the climate alarmists claim?

            And the warming in central England, since the coldest period of the 1690’s, was at least +3 degrees C. — how much of that did CO2 cause? ( no more than 15%, I’d say )

            So it seems that natural causes of climate change can cause global warming too — so why can’t the 1975 to 2000 warming have 100% natural causes?

            Saying that 1975 to 2000 warming period was man made does not make it so.,no matter how confident you are.

          • Craig T says:

            Richard:
            “Water vapor, the primary greenhouse gas, absorbs and reradiates some of the same infrared wavelengths as CO2.
            Yet infrared spectroscopy uses artificially dry air in a closed system.”

            Me:
            “In fact mixtures of CO2 and H2O were measured together as early as 1954 and found to match well with calculations adding the absorρtion of each.”

            Richard:
            “Laboratory closed system experiments are NOT proof of what actually happens in the atmosphere.
            That was my point.”

            That’s OK. I can still hit that moved goalpost.
            https://newscenter.lbl.gov/2015/02/25/co2-greenhouse-effect-increase/

      • David Appell says:

        Richard Greene says:
        The lack of warming in Antarctica is evidence that CO2 is not doing what it was claimed to do.

        Wrong.

        The South Pole has warmed 0.6 C since 1957.

        UAH LT SoPol land has warmed 0.35 C since 1979.

        • Mike Flynn says:

          DA,

          From Nature –

          “A paradoxical negative greenhouse effect has been found over the Antarctic Plateau, indicating that greenhouse gases enhance energy loss to space.”

          Obviously another rubbish Nature peer reviewed paper. Feel free to uncritically accept fantasy as fact. Many do.

          Cheers.

          • Craig T says:

            “A paradoxical negative greenhouse effect has been found over the Antarctic Plateau, indicating that greenhouse gases enhance energy loss to space. Using 13 years of NASA satellite observations, we verify the existence of the negative greenhouse effect and find that the magnitude and sign of the effect varies seasonally and spectrally.”

          • David Appell says:

            “These are climatological features uniquely found in the Antarctic Plateau region, explaining why the greenhouse effect is positive everywhere else.”

            http://adsabs.harvard.edu/abs/2017AGUFM.C21D1139S

          • Mike Flynn says:

            Chaps,

            Presumably you are presently rewriting the non-existent GHE description to specify the geographical regions where it doesnt apply. How is the work going?

            What happens at the boundary between positive and negative? Given that some fools think that a GHE provides a 33 K temperature rise, would this occur rapidly, or more gradually?

            The linked paper states –

            “Thus, a common way to measure the strength of the greenhouse effect is by taking the difference between the surface longwave (LW) emission and the outgoing LW radiation.”, which is completely meaningless pseudoscientific climate cult jargon.

            The dimwitted authors need to learn some English at least. Radiation is the emission of electromagnetic waves, according to one definition. Are the authors redefining accepted terminology into some pseudoscientific climatological jargon, do you think? Where is the jargon defined in the paper?

            It seems you are fools appealing to the authority of other fools. I wish you luck with that.

            Cheers.

        • barry says:

          The Central Plateau is not the whole of Antarctica, the study posits that the effect is not year-round, and the study does not discuss long-term Antarctic temperature trends.

          Yet one more snarky red herring from the usual source.

          • Mike Flynn says:

            b,

            Are you disagreeing with something I wrote? Maybe you could quote something with which you disagree, or you could just go off at a tangent or two.

            Cheers.

          • barry says:

            If you’re too thick to see that I’m directly addressing the paper you quoted – but did not link – and its relevance to the comment you replied to, then why waste my time spelling it out when you will still be just as thick and obtuse. No, thanks.

          • Mike Flynn says:

            b,

            Are you actually disagreeing with anything I said, or just arguing with yourself?

            If you addressing something else, why do you think I might be interested? If you think I have written something which is incorrect, by all means provide some facts to back up your disagreement.

            You don’t seem to be prepared to disagree with anything I said, in particular, rather you are just whining generally about things I didn’t say.

            To each his own, I suppose.

            Cheers.

        • Richard Greene says:

          There goes data miner Apple again.

          You should wear a steel helmet with a miner’s light !

          1979 happened to be an unusually cold year in UAH data.

          A GREAT starting point for trend analysis for climate alarmists like you/

          Start the long term trend trend with 1980, a more typical year, and the rising trend goes away.

          This is typical Apple, who does not consider ALL the data, to report honestly.

          If a 1979 starting year “works” for him, that’s good enough.

          Never mind that starting in 1980 would result in a cooling trend through 2018

          So dishonest Apple is using the warming from 1979 to 1980 to create the false illusion about UAH South Pole data.

          Typical Climate Alarmist data mining.

          • Craig T says:

            What data are you looking at? UAH TLT 1980 to present has an upward trend of 0.13 C per decade. Same for start of 1980 to start of 12018 and start of 1980 to the end of 2018.

            “There goes data miner Apple[sic] again.”

            You have an entire blog dedicated to mining papers for any advantage of higher CO2 while ignoring any harm found.

    • Svante says:

      It’s verified by satellite measurements in chapter 4 (how could you miss that).

      • Mike Flynn says:

        S,

        Your pseudoscientific mumbo-jumbo is quite meaningless. You can’t even describe the GHE, can you? If you claim you found it somewhere, why not copy and paste it here for everyone to see?

        Too secret, perhaps?

        Cheers.

        • Craig T says:

          Did you make it to the introduction of the Nature paper?

          “Analogous to a greenhouse, the atmosphere is transparent to incoming solar radiation and opaque to outgoing infrared radiation. This feature allows solar energy to reach the surface while impeding the escape of infrared energy to space, warming Earths climate.”

          • Mike Flynn says:

            CT,

            Yes I did.

            Your quoted material starts off with nonsense – “Analogous to a greenhouse, the atmosphere is transparent to incoming solar radiation and opaque to outgoing infrared radiation.”

            Are you so stupid that you believed this? What happens where there is no incoming solar radiation? Why is the Earth’s surface no longer molten? The surface has cooled – no warming to be found, after four and a half billion years of sunlight, even.

            Moving right along, I happen to agree with Richard Feynman, who said –

            “It doesn’t matter how beautiful your theory is, it doesn’t matter how smart you are. If it doesn’t agree with experiment, it’s wrong.”

            If all you can do is complain that you cannot perform experiments because it’s too hard, or there is only one Earth, or you can’t be bothered because the science is settled – bad luck. Refer back to Feynman’s words – you’re wrong!

            If you can find anything useful, please let me know. I won’t hold my breath while I’m waiting.

            Cheers.

  22. CO2isLife says:

    Once again, if the ground measurements of Antarctica aren’t showing warming, you can’t claim CO2 elsewhere is causing warming. The lats of physics don’t cease to exists in Antarctica. 15-micron LWIR causes the same dipolar vibration regardless of location.

    • bdgwx says:

      This is correct. The laws of physics are the same everywhere. 15 um IR will get blocked by CO2 regardless of which location or which trajectory it is taking. In Antarctica the stratosphere is often warmer than the surface which CO2 is blocking more DWIR than UWIR.

      • Mike Flynn says:

        b,

        What happens to the the “blocked” radiation? Do you actually understand the import of your nonsensical pronouncement?

        I assume you aren’t stupid and ignorant enough to believe that “blocked” (whatever that might mean) radiation vanishes, or is somehow trapped or accumulated, remaining dormant until called forth by some wizard of the pseudoscientific climate cult variety!

        You might choose to learn some physics, and let me know where this “blocked” radiation goes. Or not, if it’s all too difficult to put into writing.

        Cheers.

    • David Appell says:

      The South Pole shows 0.6 C of warming since the last ’50s.

      Amundsen-Scott Station
      data:
      https://legacy.bas.ac.uk/met/READER/surface/Amundsen_Scott.All.temperature.txt

      • Richard M says:

        So David, I guess that means I can use my backyard to determine whether the planet is warming after all.

        Face::palm.

        BTW, how much has that location warmed since 1969???

  23. CO2isLife says:

    15 microns causes a temporary dipole vibration. That vibration is almost immediately transferred to a non-CO2 molecule through collision. Rarely does that CO2 molecule reemit that photon, most kinetic energy is transferred to another molecule through contact. It is that vibration, not the IR spectrum that is measured by a thermometer. Thermometers measure the kinetic energy in the atmosphere.

    • Craig T says:

      Downwelling longwave radiation runs between 250 to 400 W/m^2 depending on time and location. (Only 60 to 125 W/m^2 in Antarctica.) That is from all the greenhouse gasses not just CO2.

      • CO2isLife says:

        Sure, but what GHG is in the atmosphere over Antarctica? Water vapor has been removed? No one is arguing about the GHG effect, the point is to isolate the impact of CO2. CO2 has gradually increased over Antarctica, water vapor has not, temperatures have not increased.

        • Craig T says:

          From Mike Flynn’s paper:

          “Area-averaged spectral analyses of the TOA OLR and surface emission reveal that the energy loss to space in spectral regions associated with strong greenhouse gas absorρtion is greater than surface emission; a clear indicator that greenhouse gases enhance the energy loss to space and produce a negative GHE. Unexpectedly, we find the 667 cm^−1 CO2 band (from 580 to 750 cm^−1) is not solely responsible for the negative GHE as previously thought. In addition to the 667 cm^−1 CO2 band, we find water vapor bands (rotational bands below 550 cm^−1 and vibrational bands above 1350 cm^−1;) produce a negative GHE.”
          https://www.nature.com/articles/s41612-018-0031-y

          “No one is arguing about the GHG effect…”

          How I wish that were true.

          • Mike Flynn says:

            CT,

            I didn’t write a paper, so you are just making stuff up – yet again!

            Nature doesn’t care what you wish. Nor do I, come to that. Why should I?

            Still no useful GHE description, is there? Just more wishful thinking that it must be around, somewhere!

            No GHE. No CO2 heating. Bad luck.

            Cheers.

          • Craig T says:

            Trust me Mike – I’ve never considered the possibility of you writing a peer reviewed paper. I only meant you had referred to the paper.

          • Mike Flynn says:

            CT,

            You wrote –

            “Trust me Mike – I’ve never considered the possibility of you writing a peer reviewed paper. I only meant you had referred to the paper.”

            Why should I trust someone who demonstrates their complete lack of knowledge at every turn?

            If you mean something, you could always try writing what you mean.

            Still no GHE. No CO2 heating. Bad luck.

            Cheers.

        • David Appell says:

          The South Pole shows 0.6 C of warming since the last 50s.

          Amundsen-Scott Station
          data:
          https://legacy.bas.ac.uk/met/READER/surface/Amundsen_Scott.All.temperature.txt

          • Mike Flynn says:

            DA,

            Pointless and irrelevant repetitive posting syndrome got you in its cruel grip again?

            Sad.

            Cheers.

          • Richard Greene says:

            Appell
            You can’t measure an entire continent of Antarctica with one temperature station.

            Except in junk science!

  24. Arthur Ellingsen says:

    ” If history is any guide, this means the observations will continue to need adjustments to fit the models, rather than the other way around.” Pls. explain. This is cheating to me!

    • David Appell says:

      Comically, the satellite groups like UAH adjust the raw data most of all.

      (In fact, satellites don’t even measure temperatures.)

      • Richard M says:

        No David, the raw data is not adjusted one bit. You are right that it isn’t temperature that is measured which is why the data need to be processed. It is the processing that has changed due to increased understanding of satellite drift.

  25. Ren Wilder says:

    This would be really funny if it wasn’t so sad. How many posts and comments on this website talked about the “pause”, which was nothing more than a decrease in the linear trim if you start from the top of the El Nino in 1998? None of these people purporting that there was a pause would ever agree to remove that El Nino, but here is doctor Spencer gleefully removing 2016 because it makes the trend too high. What a joke.

    • Richard M says:

      I guess math must not be one of your strengths. The pause was not due to the 1998 El Nino but of course, like most true believers you live in denial of basic math.

      • Craig T says:

        Do you have a cause for the pause? Whatever it was, it was noise and not a trend.

        • Bill Hunter says:

          Craig T says:
          May 20, 2019 at 6:47 AM
          “Do you have a cause for the pause? Whatever it was, it was noise and not a trend.

          “Part of the BS spread by the alarmists is that natural variation has to be settled science before we assume any of the modern warming wasn’t man made.”

          I am more of a conservative and agree with the potential of multiple effects on our globe that can result in climate change. Dr Syun Akasofu laid out the theory that a gentle warming trend extending through the entire industrial period is possibly a recovery from several centuries of gradual cooling. On top of that he layered multi-decadal oscillations without naming a cause but is justified by observation.

          Alarmists like to assume that once gradual cooling sets in it has to go all the way to full on glaciation that no dilly dallying is allowed.

          Seems to be to be way way too orderly of an assumption for nature which tends to be messy.

          Further, NOAA used to have a graph that tracked that using solar proxies. It has been disputed by alarmists because smoothed solar activity peaked in the mid 1980’s and it has continued to warm, ignoring their own arguments. We see in multi-decadal oscillations the effects the oceans have on global temperatures. Continued warming after a solar peak is no surprise as you have then still cold oceans. Problems exist in understanding surface ocean change and deep ocean change. A recent study showed areas of the deep Pacific still cooling from the time of the LIA while the bulk of the oceans have been slowly warming. This giant ship of a world simply reacts slowly to the helm. How slow? Well a dozen years is probably a no brainer. Deep ocean change can take more than a millennium however deep ocean affects on the atmosphere maybe rather limited.

          Even further, NOAA used smoothing to filter out multi-decadal climate change effects of ocean currents being modified, showing up as surface temperature anomaly patterns that translate into global temperature modifications perhaps via the effects SSTs on cloud patterns. When the western Pacific is warm perhaps moisture is kept aloft more so than when its cold and the eastern Pacific is warm which dumps its moisture quickly upon encountering the coastal ranges that line the western shore of North America, behind which you find a lot of desert. You don’t have the same circulation patterns in the south Pacific that is open to Antarctica and the Atlantic and Indian oceans and thus we haven’t seen the sort of warming patterns in the southern Hemisphere. So what I am getting at is you can have a regional weather pattern that affects global mean temperature. . . .which may or may not have effects on total heat absorbed into the surface of the planet. The implications of that are far reaching in that water vapor and clouds do affect global temperatures and how long they stay in the sky potentially can explain a lot. However, I am not ready to start making predictions. We have likely only started to scratch the surface on climate variation.

          At any rate even the astrometeorologists seem to recognize the multi-decadal patterns and give a 72 year cycle number to it. Nice stuff as it clearly has been in place over the entire industrial revolution and seems at most a few years delayed at this moment possibly as a result of the 2015 El Nino. The next decade should be interesting. . . .that is if we can keep all the thumbs off the scale.

          • Bill Hunter says:

            sorry there should not be quotes around that second paragraph.

          • Craig T says:

            “Part of the BS spread by the alarmists is that natural variation has to be settled science before we assume any of the modern warming wasn’t man made.”

            Just the opposite. Climatologists know a lot of variables affect temperatures in any one year. If there were a way to filter out that noise a warming trend could be in a few years. As it is it takes at least 30 years of measurements to see any trend whatever the cause.

            Syun-Ichi Akasofu claimed in a 2013 paper that warming stopped in 2000. The causes he gives are the recovery from the LIA and the Pacific Decadal Oscillation. The PDO is cyclical and went back in positive territory in 2015.

            Akasofu claims that the Earth has been steadily warming since the LIA, he has been criticized for claiming a straight linear trend when temperatures from 1850 to present better fit for an accelerating warming.
            https://www.mdpi.com/2225-1154/1/2/76/htm

          • Craig T says:

            “Even further, NOAA used smoothing to filter out multi-decadal climate change effects of ocean currents being modified, showing up as surface temperature anomaly patterns that translate into global temperature modifications perhaps via the effects SSTs on cloud patterns.”

            I don’t follow. Multidecadal patterns stand out better with smoothing. If temperatures were smoothed broad enough to remove multidecadal trends you would only have century plus patterns.

          • Bill Hunter says:

            Craig T says: “Syun-Ichi Akasofu claimed in a 2013 paper that warming stopped in 2000.”

            Seems like UAH agrees on that matter.

            Craig T says: “Akasofu claims that the Earth has been steadily warming since the LIA, he has been criticized for claiming a straight linear trend when temperatures from 1850 to present better fit for an accelerating warming.”

            That just part of the lying that goes on in this business. But the truth is that is a gross mischaracterization of Akasofu’s paper. He shows a straight line and labels it as LIA recovery but its not a temperature line its a forcing on temperature line. Proof of that is he also has the multi-decadal oscillation forcing of temperatures laid along that line. You can’t have two temperature lines but you can have two forcing lines that combined tracks the variation in temperatures. Heck the models can’t even do that, the modelers are totally befuddled by the reality that climate change is occurring, has always occurred, and will continue to occur.

            Craig T says: I dont follow. Multidecadal patterns stand out better with smoothing. If temperatures were smoothed broad enough to remove multidecadal trends you would only have century plus patterns.

            Thats correct. Thats why NOAA used a 60+year smoothing to eliminate the multi-decadal oscillation.

          • Bill Hunter says:

            Craig T says:
            “I dont follow. Multidecadal patterns stand out better with smoothing. If temperatures were smoothed broad enough to remove multidecadal trends you would only have century plus patterns.”

            Its only true that multi-decadal patterns stand out best actually with 10year smoothing because apparently it enhances the solar effect and filters out shorter term effects like ENSO. If you start making the smoother longer term the multi-decadal pattern starts to breakdown. If you extend the smoothing out to 60 years the multi-decadal pattern is virtually gone. I’ve played with the numbers and have observed this behavior.

            So does it behave in such a way? I don’t know the answer but my guess is it has something to do with magnetism possibly shifting ocean currents and of course you have the Svensmark effect in addition. With huge ocean temperature buffering its really hard to get a handle on it because obviously the big Svensmark effect came apparently at the low point of the LIA at the end of the 17th century. Whats left of that is a gradual depletion of the ocean buffer. So when looking at multi-decadal and shorter smoothing you may be looking purely at ocean processes putting some liveliness into the line.

            The problem is that when you have noise you can’t have a reliable line for the purpose of prediction. And when you look at ice core data you have about 2degC noise. I have a hard time seeing huge effects from 3 deg C of warming. Add in 2 deg C noise and the alarm bell should be 5 deg C.

            In the temperature record we have large decadal differences between the records. We don’t seem to be getting better at this and politics is probably making it worse.

          • Craig T says:

            “Thats correct. Thats why NOAA used a 60+year smoothing to eliminate the multi-decadal oscillation.”

            Can you link to something showing NOAA using a 60 year smoothing?

        • Richard M says:

          Craig T, the most likely cause for the pause is the absence of any increased forcing. Since we know the claimed CO2 forcing has gone up considerably over the past two decades it places a lot of doubt on exactly how great of forcing CO2 provides.

          I assume your next question will then be what caused the warming prior to the pause? The answer … ocean cycles. First the PDO went positive in the late 1970s and then the AMO in the early 1990s.

          Now add in long term warming since the depths of the LIA and you have a complete history of recent climate changes.

      • Craig T says:

        Craig T says: Akasofu claims that the Earth has been steadily warming since the LIA, he has been criticized for claiming a straight linear trend when temperatures from 1850 to present better fit for an accelerating warming.

        That just part of the lying that goes on in this business. But the truth is that is a gross mischaracterization of Akasofus paper. He shows a straight line and labels it as LIA recovery but its not a temperature line its a forcing on temperature line.

        “All these results clearly show near linear increases temperature from about 1800-1850 to 2000, in addition to those results obtained by the IPCC (Figure 1).”
        On the Present Halting of Global Warming
        Syun-Ichi Akasofu
        http://www.mdpi.com/2225-1154/1/1/4/pdf

        • bill hunter says:

          if it still on the web its deeply buried on noaas webserver as it was probably 8 years ago. i kept a copy but its on a disk at least 2 computer generation ago for me.

          • Bill Hunter says:

            Craig T.

            Follow along on the graph. He is looking at a temperature record. He is looking to see the shape of the longterm dominant forcing. One easy way to do that is create a trendline for the entire period and determine if the fluctuations around the trend line are roughly equal. If they are you might want to do some smoothing and see if the trend holds up. If the trend is essentially straight its probably due to either an adjustment back to equilibrium or alternatively a forcing that is increasing in a linear manner.

            None of this is proof of anything except its evidence. Its a reasonableness test. Akasofu did it and then said we need to understand

            natural variation before we can attribute change to humans and his low budget quick look at it is exactly the sort of test that auditors

            do. Warmists just got their panties in a wad because he labeled the linear line LIA recovery. I am sure there would have been complaints to if he had labeled it CO2 forcing. But CO2 forcing has not be linear, if it exists. And surely the warmists want to take the last 36 years and claim them for CO2 forcing acceleration.

            You can verify all this yourself in 5 minutes. Go to Wood for Trees, pull up unadjusted Had.crut3 global and plot the linear trend from

            as I recall the beginning of Had.crut3 in 1860 to 2009 when he wrote the paper. Also plot the monthly temperatures without a trend line

            and eyeball the result. The line almost perfectly intersects through the wavy pattern that is presumably ocean current changes.

          • Craig T says:

            “He is looking to see the shape of the longterm dominant forcing. One easy way to do that is create a trendline for the entire period and determine if the fluctuations around the trend line are roughly equal.”

            The word “forcing” doesn’t appear anywhere in the paper, and describing a temperature plot as the shape of the forcing is a poor use of the term.

            As I said a week ago a linear trend is a poor fit for the data but I doubt I can convince you of that. As far as the cyclical pattern of the PDO, for each cycle the cooling gets less. The temperature has a steeper decline at the turn of the century than the 1950’s. What should have been a decline because of the PDO from 2000 to 2015 is just a pause in the warming.

          • bill hunter says:

            Craig: – – -As I said a week ago a linear trend is a poor fit for the data but I doubt I can convince you of that.- – –

            Sure you could. You just haven’t tried. What did you use as a dataset? Don’t you think you should use what Akasofu used?

          • Craig T says:

            Craig: -As I said a week ago a linear trend is a poor fit for the data but I doubt I can convince you of that.-

            Sure you could. You just haven’t tried. What did you use as a dataset? Don’t you think you should use what Akasofu used?

            Akasofu used HAD.CRUT4 data so I will as well. I made two graphs of the annual global anomaly for the full range of 1850 to 2018. One was given a linear trendline and another a polynomial trendline where the warming slowly increased each year.

            Excel will calculate the R squared value showing how well the trendline matches the data. A value of one is a perfect fit. The polynomial trendline has a R^2 value of 0.84 while the linear fit R^2 value is 0.69.

            Earlier you mentioned a graph using a 60 year smoothing to quiet the PDO. When I graphed the smoothed data the polynomial’s trendline R^2 value was 0.997.

          • Bill Hunter says:

            Craig –

            Your mistake is Akasofu had Had.crut4 data. Akasofu published his study in 2009 and had it on the Univ of Alaska website unpublished for sometime before that enabling extensive public and peer review.

            Had.crut4 was not published until 2012. I acknowledge there is a crook in that data as efforts began for a new temperature record as a result of greatly increased belief of natural climate change, helped with the Akasofu paper but also by the record solar minimum coinciding with temperatures dramatically dropping in 2008.

            Looking back at the Akasofu study I note he used a temperature record provided in Bryant 2001. However, you get virtually the same result with Had.crut3 unadjusted. The variance adjustments were adjustments applied by Phil Jones in 2001 to Had.crut2 so UKMet considered it important to continue to provide the unadjusted numbers. At any rate Bryant 2001 would not have Jones adjustments nor the adjustments made with Jones publication of Had.crut4. Without Phil Jones of “hide the decline” tricks adjustments which somebody would need to go through the reasoning line by line with me before I considered anything he did as credible because of his obvious willingness to be as deceitful and deceptive as he thought he could get away with.

            So I would suggest you run your analysis on at least Had.crut3 unadjusted or Bryant 2001 which is a bit harder to get the raw data for as I never found it as published except I think it came from had.crut2 before Phil Jones adjustments.

          • Craig T says:

            Just repeated the graphs with HAD.CRUT3 unadjusted global means. The polynomial fit R^2 was 0.789 and the linear fit R^2 0.646.

          • Bill Hunter says:

            Pretty small difference. Must be a pretty weak polynomial. What factors did you use? Perhaps with a bit more analytical work we can come up with a total sensitivity number.

          • Craig T says:

            Here’s a link to the graphs showing HAD.CRUT3 unadjusted by year and 60 year smoothing with the best fit polynomial and linear trend. Notice how the polynomial trend is almost the same shape as the 60 year smoothing. It has an R^2 value of 0.9992.

            https://imgur.com/1LGb3gY

          • Bill Hunter says:

            Craig – Thanks for putting up your calculations. I see the linear fit isn’t bad at all especially to the smoothed data.

            If the topic is criticizing Akasofu for estimating linear warming between 1800-1850, However, I am sure Bryant at least in some work I did some analysis from (can’t speak for Akasofu) used Had.crut2 in as I recall and 1995 paper. Had.crut3 did not become available until 2006 and did show more warming than Had.crut2 from 1940 to at least the early 90’s. As I recall Bryant had zero peaks in the early 90’s above the peaks in the 40’s they were virtually identical.

            Additionally, historical reconstructions show a good amount of warming in the early 19th century the absence of which is strongly affecting the tail end of your smoothing. Thus your polynomial fit suggests the LIA didn’t end until the end of the 18th century.

        • bill hunter says:

          Craig T

          Taken out of context Craig. If you can’t read a graph and follow the reasoning you are probably better off having somebody else tell you what to think.

          • Craig T says:

            Is this enough context for you?

            “Figure 2 shows temperature variations from about the year 800 to 2000, deduced from tree ring changes; it shows the Little Ice Age (LIA) after the Medieval Warm Period circa 1000 and the near linear increase after 1800 or shortly after [5]. Figure 3 shows basically similar trends in the temperature changes obtained by several researchers (including Esper et al. [5]), indicating a near linear rise in temperature from about 1850 to 2000 [10]. All these results clearly show near linear increases temperature from about 1800-1850 to 2000, in addition to those results obtained by the IPCC (Figure 1). One possibility, then, is that this near linear component is due to a gradual recovery from the Little Ice Age (LIA) of 1800-1850 [8], as the LIA did not end abruptly. It is generally perceived that the temperature during the LIA was about 1 C lower than in the present (Figures 2 and 3). Thus, the rate of this gradual temperature increase since 1800 would be roughly 1 C /200 years (= 0.5 C/100 years or 0.05 C/10 years), similar to the rate of the near linear increase of about 0.5 C that we see over the course of the 20th century.”

            I can read a graph labeled “Estimated actual global mean temperatures” and know the graph does not involve forcings.

  26. Mark Wapples says:

    Could somebody explain the news today that Greenland glaciers are now starting to grow?

    I am not a climate scientist just totally confused by the claims i have seen recently.

  27. Svante says:

    Latest claim: The Greenland ice sheet is growing.
    https://tinyurl.com/y475fu75

  28. David Appell says:

    Roy wrote:
    “For example, there is plenty of evidence that the Little Ice Age was real…”

    But not global, Roy. Let’s see what some actual experts say:

    “There were no globally synchronous multi-decadal warm or cold intervals that define a worldwide Medieval Warm Period or Little Ice Age….”

    — “Continental-scale temperature variability during the past two millennia,” PAGES 2k Consortium, Nature Geosciences, April 21, 2013
    http://www.nature.com/ngeo/journal/v6/n5/abs/ngeo1797.html

    • Svante says:

      Global but not synchronously global I’d say.

      • David Appell says:

        If it wasn’t synchronous, it wasn’t global.

        • Svante says:

          The rest of your quote says:
          “but all reconstructions show generally cold conditions between AD 1580 and 1880, punctuated in some regions by warm decades during the eighteenth century.”

          People can look at your fig. 2 to see what the pattern is:
          https://tinyurl.com/y9twn5fq

        • bill hunter says:

          David Appell says:
          May 14, 2019 at 5:00 PM
          “If it wasn’t synchronous, it wasn’t global.”

          IT needs to be defined. Almost all the heat from the sun is absorbed by the oceans. No physical law mandates that heat leave the ocean at a globally synchronous rate.

          The simple fact is we know very little about what some of us are so sure about. And when it comes danger, indeed the most dangerous beast on the planet is a man who thinks he knows what is best for everybody else.

    • Bill Hunter says:

      Seems to me multi-decadal refers to the 66-72 year cycle, the paper’s abstract acknowledges a centennial effect. Not sure what the graph is Svante posted but it appears to be attributing the effect to a volcanic/solar downturn.

  29. David Appell says:

    Roy wrote:
    Objections have been made to that study by me (e.g. here) and others, not the least of which is the fact that the 2003-2017 period addressed had a record warm El Nino near the end (2015-16), which means the computed warming trend over that period is not entirely human-caused warming.

    Nope.

    The average ONI over this time period is -0.01. Balanced.

    The average MEI is -0.21 — slightly La Nina-ish.

    • Bill Hunter says:

      David, the average of -5, -4, -3, -2, -1, 0, 1, 2, 3, 4, 5 is zero. But there is a big trend in the “balanced” numbers.

      • David Appell says:

        That’s not at all what is happening with ENSOs.

        Roy seems to think that El Ninos warm the atmosphere but La Ninas do not cool it.

        Any explanation, Roy?

        • Bill Hunter says:

          David Appell says:
          May 15, 2019 at 3:55 PM
          “Thats not at all what is happening with ENSOs.”

          Sure it is. The largest El Nino in the 21st Century ended recently and here on my coast we are still experiencing some of the effects of it as the masses of warm water moved there by ocean currents hasn’t completely cooled off yet.

          • David Appell says:

            There were two La Ninas following the 2015-2016 El Nino. What was there effect?

          • David Appell says:

            Do El Ninos and La Ninas balance over time?

            The data I gave above says they do.

          • Bill Hunter says:

            the two El Ninos were very weak. One so weak Australia which has a slightly higher standard wouldn’t recognize it. The La Ninas were too weak to generate a discernible global effect. El Ninos that weak don’t do hardly anything either. The 21st Century ENSO is dominated by the 2008 La Nina and the 2015 El Nino which is a trend from cold to warm that as Roy says correctly accounts for some of the 21st Century warming. He says Meaning of course the models are even deeper in the tank than what they are as it is with the temperature record.

            So David you will just have to read it and weep because its so easy to see and Roy explains it so clearly that a 3rd grader could easily pick it up.

            Lets face it the numbers don’t lie, take out the last few years back to the start of the 2015 El Nino and a large portion of the trend disappears.

          • David Appell says:

            Bill Hunter says:
            the two El Ninos were very weak.

            Bill — define “weak.”

            Show us what numbers you’re using to claim this.

          • David Appell says:

            Bill, the data I gave above says that El Ninos and La Ninas balance over time.

            Why doesn’t Roy conclude that?

            If Roy is right about 20th century warming, this is a tremendous discovery.

            So why isn’t Roy submitting his findings to a major scientific journal?

            Why?

            Because Roy is far more interested in tossing off a blog post instead of doing actual science.

            Why would a scientists do that, Bill, unless they have given up?

          • Bill Hunter says:

            Correction: The two La Ninas following the big El Nino were very weak. ENSO events that have significant impacts on global temperatures generally exceed an anomaly in excess of 1.5 degrees. Only one of the two La Ninas scored a season score maxing out at 1 degree. Source: https://origin.cpc.ncep.noaa.gov/products/analysis_monitoring/ensostuff/ONI_v5.php

            I think the idea of going through the hoops for a paper this simple doesn’t add up to anything beyond refuting blog buffoonery about the implication of recent short term warming trends.

            For instance right at the top of the replies here Roy’s findings aren’t contested but what is claimed is Roy’s trend isn’t long enough. I think Roy even might agree with that because all he is doing is informing the public that claims of renewed warming and pause busting is premature. Or at least that’s what I got out of it. Anybody who can’t see that no doubt needs to sign up for some classes in reading graphs and temperature plots overlaid precipitating events like ENSO. Roy has it spot on.

        • If there are unusually large El Nino’s, as in 1998 and late 2015/early 2016, that are NOT followed by equally large La Ninas, then for THAT TIME PERIOD, the Pacific Ocean warming will have exceeded the Pacific Ocean cooling, and the result would be a steeper global warming trend.

    • Richard M says:

      David, Roy shows the trend in the article. Your comment is hysterical in its anti-science claims.

  30. Eben says:

    Bill Nye the fake scientist guy is on tv spewing profanity laced climate tantrum the earth will be 8 degrees warmer by the end of the century
    Evidently he is sticking to the original 1988 model
    https://bit.ly/2JECFCn

    • David Appell says:

      That’s not what he said, liar.

      How about quoting him accurately.

      • Mike Flynn says:

        DA,

        Apparently a direct quote, because you were too lazy, incompetent, or stupid to provide it yourself-

        “What I’m saying is the planet’s on f***ing fire. There are a lot of things we could do to put it out — are any of them free? No, of course not. Nothing’s free, you idiots. Grow the f**k up. You’re not children anymore. I didn’t mind explaining photosynthesis to you when you were 12. But you’re adults now, and this is an actual crisis, got it? Safety glasses off, motherf***ers.”

        Typical appeal to his own authority. What a stupid fellow!

        Cheers.

        • Carbon500 says:

          What is it about some Americans that they deem it necessary to use foul language in all of their pronouncements?
          Don’t they ever think about what they sound like?

    • bdgwx says:

      Regarding https://bit.ly/2JECFCn

      Why is the “you are here” label pinned near 0.6C when it should be closer to 0.8C based on a wide sampling of datasets that publish a global mean surface temperature?

      Why is the “you should be here” label pinned to scenario A when the actual scenario that played out was somewhere between B and C?

    • barry says:

      It was on a comedy show. Skeptics need to lighten up.

  31. Eben says:

    A prove that climate shysters are just that , regardles which way the temperature goes its always exactly the same solution .

    The April 28th , 1975 issue of NEWSWEEK proposed solutions to climate change in an article that included outlawing the internal combustion engine. At that time their concern was Global Cooling not Warming

    The January 31 , 1977 cover of TIME magazine featured a story How to Survive The Coming Ice Age. It included facts such as Scientists predict that the temperature of the earth could drop by 20 degrees Fahrenheit due to man-made global cooling. Dr. Murray Mitchell of the National Oceanic and Atmospheric Administration warned, the drop in temperature between 1945 and 1968 had taken us one sixth of the way to the next Ice Age temperature.

      • Mike Flynn says:

        b,

        Is there a particular reason for posting unlabelled links? Do they have some special significance?

        If you have some relevant facts, a short description would help. Otherwise, why would anybody waste their time looking at your link? Anybody apart form a pseudoscientific climate cultist, that is.

        Cheers.

        • Stephen P Anderson says:

          Typical John Cook BS. In the 70’s it was the scare du jour. It just didn’t last long enough. Now that there is a warming trend this band wagon has been jumped on. So, let’s take the field of science, apply pseudoism to it, and use it to achieve our leftist agenda.

          • bdgwx says:

            The publication I linked to above was authored by Peterson, Connolley, and Fleck. Cook is not listed as a contributor.

          • David Appell says:

            Stephen: Here is Frank Ikard, then-president of the American Petroleum Institute, speaking at APIs annual meeting in 1965:

            “CO2 is being added to atmosphere by the burning of coal, oil, and natural gas at such a rate that by 2000 the heat balance will be so modified as possibly to cause marked changes in climate beyond local or national efforts.”

            Source: Early oil industry knowledge of CO2 and global warming, Benjamin Franta, Nature Climate Change (2018).

        • Svante says:

          Here Mike, I read the link for you:

          An enduring popular myth suggests that in the 1970s the climate science community was predicting ‘global cooling’ and an ‘imminent’ ice age, an observation frequently used by those who would undermine what climate scientists say today about the prospect of global warming. A review of the literature suggests that, on the contrary, greenhouse warming even then dominated scientists’ thinking as being one of the most important forces shaping Earth’s climate on human time scales.

          You’re welcome!

          • JDHuffman says:

            For those that prefer reality over Svante’s biased cherry-picking:

            (Source: TIME Magazine, June 24, 1974)

            As they review the bizarre and unpredictable weather pattern of the past several years, a growing number of scientists are beginning to suspect that many seemingly contradictory meteorological fluctuations are actually part of a global climatic upheaval. However widely the weather varies from place to place and time to time, when meteorologists take an average of temperatures around the globe they find that the atmosphere has been growing gradually cooler for the past three decades. The trend shows no indication of reversing. Climatological Cassandras are becoming increasingly apprehensive, for the weather aberrations they are studying may be the harbinger of another ice age.

            Telltale signs are everywhere —from the unexpected persistence and thickness of pack ice in the waters around Iceland to the southward migration of a warmth-loving creature like the armadillo from the Midwest. Since the 1940s the mean global temperature has dropped about 2.7° F. Although that figure is at best an estimate, it is supported by other convincing data. When Climatologist George J. Kukla of Columbia University’s Lamont-Doherty Geological Observatory and his wife Helena analyzed satellite weather data for the Northern Hemisphere, they found that the area of the ice and snow cover had suddenly increased by 12% in 1971 and the increase has persisted ever since. Areas of Baffin Island in the Canadian Arctic, for example, were once totally free of any snow in summer; now they are covered year round.

            Scientists have found other indications of global cooling. For one thing there has been a noticeable expansion of the great belt of dry, high-altitude polar winds —the so-called circumpolar vortex—that sweep from west to east around the top and bottom of the world. Indeed it is the widening of this cap of cold air that is the immediate cause of Africa’s drought. By blocking moisture-bearing equatorial winds and preventing them from bringing rainfall to the parched sub-Sahara region, as well as other drought-ridden areas stretching all the way from Central America to the Middle East and India, the polar winds have in effect caused the Sahara and other deserts to reach farther to the south. Paradoxically, the same vortex has created quite different weather quirks in the U.S. and other temperate zones. As the winds swirl around the globe, their southerly portions undulate like the bottom of a skirt. Cold air is pulled down across the Western U.S. and warm air is swept up to the Northeast. The collision of air masses of widely differing temperatures and humidity can create violent storms—the Midwest’s recent rash of disastrous tornadoes, for example.

          • Craig T says:

            All that and no mention of outlawing the internal combustion engine?

          • David Appell says:

            “The Myth of the 1970s Global Cooling Scientific Consensus,” W. Peterson et al, Bull. Amer. Meteor. Soc., 89, 13251337, 2008
            http://journals.ametsoc.org/doi/abs/10.1175/2008BAMS2370.1

          • JDHuffman says:

            (From the same TIME article.)

            Sunspot Cycle. The changing weather is apparently connected with differences in the amount of energy that the earth’s surface receives from the sun. Changes in the earth’s tilt and distance from the sun could, for instance, significantly increase or decrease the amount of solar radiation falling on either hemisphere–thereby altering the earth’s climate. Some observers have tried to connect the eleven-year sunspot cycle with climate patterns, but have so far been unable to provide a satisfactory explanation of how the cycle might be involved.

            Man, too, may be somewhat responsible for the cooling trend. The University of Wisconsin’s Reid A. Bryson and other climatologists suggest that dust and other particles released into the atmosphere as a result of farming and fuel burning may be blocking more and more sunlight from reaching and heating the surface of the earth.

            Climatic Balance. Some scientists like Donald Oilman, chief of the National Weather Service’s long-range-prediction group, think that the cooling trend may be only temporary. But all agree that vastly more information is needed about the major influences on the earth’s climate. Indeed, it is to gain such knowledge that 38 ships and 13 aircraft, carrying scientists from almost 70 nations, are now assembling in the Atlantic and elsewhere for a massive 100-day study of the effects of the tropical seas and atmosphere on worldwide weather. The study itself is only part of an international scientific effort known acronymically as GARP (for Global Atmospheric Research Program).

            Whatever the cause of the cooling trend, its effects could be extremely serious, if not catastrophic. Scientists figure that only a 1% decrease in the amount of sunlight hitting the earth’s surface could tip the climatic balance, and cool the planet enough to send it sliding down the road to another ice age within only a few hundred years.

            The earth’s current climate is something of an anomaly; in the past 700,000 years, there have been at least seven major episodes of glaciers spreading over much of the planet. Temperatures have been as high as they are now only about 5% of the time. But there is a peril more immediate than the prospect of another ice age. Even if temperature and rainfall patterns change only slightly in the near future in one or more of the three major grain-exporting countries–the U.S., Canada and Australia –global food stores would be sharply reduced. University of Toronto Climatologist Kenneth Hare, a former president of the Royal Meteorological Society, believes that the continuing drought and the recent failure of the Russian harvest gave the world a grim premonition of what might happen. Warns Hare: “I don’t believe that the world’s present population is sustainable if there are more than three years like 1972 in a row.”

          • Mike Flynn says:

            S,

            Why are you addressing a completely irrelevant and pointless quote to me?

            What leads you to think that I am unaware of the material you quote?

            Why do you think I care? I would be impressed if you could show me something I don’t know, and cannot find out for myself. An example would be a useful description of the GHE.

            Posting useless random stuff just makes you look foolish, but you are free to do as you wish, of course.

            Cheers.

          • David Appell says:

            Warns Hare: I dont believe that the worlds present population is sustainable if there are more than three years like 1972 in a row.

            He was right. Look how many species are now threatened with extinction (~1M, ~10%) due to man’s appetite for the Earth’s resources.

          • Bill Hunter says:

            David Appell says:
            May 15, 2019 at 5:38 PM

            “He was right. Look how many species are now threatened with extinction (~1M, ~10%) due to mans appetite for the Earths resources.”

            Just more hocus pocus from the non-professional academic science community.

            Lets see we have 1.2 million species cataloged of which something like 41,000 are flagged as endangered. And of course species go extinct naturally and not all those species are going to go extinct.

            For the US Endangered species act covering now 1,600 species approximately 19 are removed each year as recovered, almost 1,500 are recovering and in the 50 year history of the act 2 went extinct.

            So then you get some academic wannabee professional who waves a magic wand over all the missing data and comes up with over a million species going extinct at the hands of man and that the extinction rate at the hands of man is about 1,000 times that as nature has provided. Pitiful!

          • Richard Greene says:

            Svante
            No one knows what all scientists were THINKING in the 1970s

            We laymen know what the mainstream media tells us about scientists.

            A vocal minority of scientists got media attention by starting the next ice age is coming scare in the mid-1970s.

            The majority of scientists (almost no one called themselves a climate scientist then) did not make wild guess predictions of the future climate because they were honest and didn’t know.

            By the end of the 1970s the coming climate crisis had morphed to global warming.

            And starting in the late 1980s it became increasingly popular to make wild guesses about the future climate, and think that was real science.

          • Svante says:

            Richard Greene says:

            “No one knows what all scientists were THINKING in the 1970s”.

            You can look up published papers, it is done in bdgwx link:
            7 cooling, 20 neutral, and 44 warming papers.

          • Svante says:

            Media is another story, as JDHuffman is showing us.

          • barry says:

            Scientific research and the weight of scientific opinion is discovered by reading the scientific literature. There were plenty of forecasts of future climate published in the science journals in the 70s (and 60s and 80s).

            If you want to know what researchers thought at a given point in time, you go to the science journals, not the media.

            Almost the entirety of skeptical discussion of the science is based on media articles. That’s why they seem to know so little of the science. The great majority of research papers in the 70s forecast warming from CO2, a handful forecast cooling from aerosols.

          • David Appell says:

            Richard Greene says:
            No one knows what all scientists were THINKING in the 1970s

            We know what papers they published…..

            But ultimately it doesn’t matter. What matters is the evidence — and the evidence today shows that humans are the only factor contributing to a rapid climate change.

          • bdgwx says:

            It’s also important to point out that proponents of global cooling were often proponents of the greenhouse gas effect. For example, Reid Bryson, who’s “human volcano” theory often got generous and unwarranted media attention, was a firm believer in the GHE and even testified to congress as much. He just thought, as many cooling proponents at the time were advocating, that the negative radiative forcing from aerosols would have a larger magnitude than the positive radiative forcing from GHGs.

          • David Appell says:

            Bill Hunter says:
            Just more hocus pocus from the non-professional academic science community.

            Look! — Bill thinks he’s Einstein.

            Bill thinks he knows more than the hundreds of scientists who contributed to the recent IPBES report

            Bill doesn’t do any research, mind you.

            Bill just has an supercharged ego that makes him think he knows more than all these many learned people.

            Yes, you’re right — Bill is a fool.

            But Bill will never admit his ignorance. Bill doesn’t like facing the truth.

            Bill wants protection. Bill NEEDS it.

          • JDHuffman says:

            Wow, Bill Hunter triggered something in DA to make DA go berserk and reveal his inner persona.

            I wish I knew Bill’s secrets….

    • barry says:

      So Eben gets his understanding of climate science from news media of the 1970s.

    • Craig T says:

      “The January 31 , 1977 cover of TIME magazine featured a story How to Survive The Coming Ice Age.”

      “As noted by Time itself in 2013, the 2006 image on the right is an authentic cover, but the 1977 image is a doctored version of an 9 April 2007 issue which actually featured an article titled The Global Warming Survival Guide
      https://www.snopes.com/fact-check/the-coming-ice-age/
      https://www.snopes.com/tachyon/2017/05/1101070409_400.jpg

  32. ren says:

    Another stratospheric intrusion over California will bring snow in the mountains and heavy downpours in the Midwest.
    http://oi63.tinypic.com/2coq59i.jpg
    No El Nino effect.

  33. Artemis Dinwitty says:

    Test

  34. Snape says:

    Matthew Bruha

    From upthread: So the increase is the equivalent of raising the heat of the ocean by 0.0017 degrees C, or extrapolated out, about 0.2 C/century.
    Not very alarming to me

    The math might be right, but the reasoning looks wrong. Youve taken an increase in OHC in one layer, measured in joules, and distributed it over the whole ocean volume.

    Imagine applying the same logic to a strong el nino: taking an increase to the top few millimeters of global ocean and extrapolating to the ocean depths? It would be even more insignificant. Would that prove a strong el nino has little effect on global temperature??

    Instead, find the increase in temperature for the layer 0 – 2000 meters. Thats the layer that was measured.
    Better yet, the increase at 0 – 700 meters, which is closer to the surface.

    • David Appell says:

      Snape says:
      So the increase is the equivalent of raising the heat of the ocean by 0.0017 degrees C, or extrapolated out, about 0.2 C/century.
      Not very alarming to me

      The number depends on depth. And most marine life lives near the surface.

      What is the temperature change for the top 100 m?
      The top 10 m?

    • Matthew Bruha says:

      NOAA numbers indicate the temperature anomaly rose from 0.168C in 2017 to 0.177C in 2018 which extrapolates to an ocean temperature rise of about 0.9C per century….again, nothing to be too alarmed about

  35. barry says:

    Some unwarranted conflating of ideas on this article. Supposed to about the relative anthro/non-anthro contributions to global temp rise, Roy writes that the “Recent Global Warming as Confirmed by AIRS” study has a warming trend affected by a late el Nino. Indeed, the paper itself points that out, and the paper is not saying that this indicative is the actual long-term trend, nor is the paper assessing relative anthro contribution. The paper is about something else entirely (comparing AIRS to other temp records).

    So I don’t know why this paper is included in this article.

    Nor do I understand why once again a time period is chosen that is too short. Global climate change – whatever the cause or not – must be assessed on multidecadal time scales, as the variance in annual global temperature makes shorter time periods too uncertain.

    If we factor in the confidence intervals for the linear trend analyses, as has been done earlier in this comment thread, we find that these uncertainties well overlap with the model envelope.

    One should always be suspicious if linear trend analyses are not accompanied by an uncertainty analysis for the trend.

    So here are the global temp trends for the period Roy chose (flat ENSO trend) with uncertainties:

    GISS: 0.130 (+/- 0.127) C/decade
    Had4: 0.095 (+/- 0.123) C/decade
    NOAA: 0.136 (+/- 0.132) C/decade
    RSS4: 0.117 (+/- 0.202) C/decade
    UAH6: 0.025 (+/- 0.194) C/decade

    For 3 out of 5 of those results, the trends do not even achieve statistical significance, and for the other 2, they only barely do. Not because the trends are low,l but because the variance is so great, particularly in the satellite data sets. The trend results are just not robust. For that you would need more data.

    Also, everyone of those results overlaps with the central estimate of the CMIP5 models of 0.18 C/decade.

    None of this demonstrates fidelity or infidelity between model and trends, but hopefully it makes clear that the time period is too short for robust comparative results.

    There are various attempts to compare model and obs that use longer periods, which thus have more robust (but by no means definitive) results.

  36. Snape says:

    Good comment, Barry

    Hi Svante. Yes, its been a while. My wife thought I was wasting too much time and restricted access.

  37. Snape says:

    My comments still end up at the bottom of the thread, and now apostrophes and quotation marks get deleted!

    • JDHuffman says:

      Get your mommy to help you.

    • Eben says:

      Get one of the “computer climate modelers” to figure it out

    • Svante says:

      You need a proper computer, none of these modern gizmos.
      Linux + Chromium is fine.

      I still have to retype those characters you mention though.

      Perhaps if Roy changed his meta data from:
      content=”text/html; charset=Roy Spencer, PhD.”
      to:
      content=”text/html; charset=UTF-8″

  38. Carbon500 says:

    Oft quoted is the following:
    ‘Greenhouse gases (GHGs) act on the climate by absorbing terrestrial surface radiation and provoking long‐wave (LW) emission from the atmosphere. This is radiated in two directions, back toward the surface and out into space.’
    But molecules in a gas aren’t static.
    LW emissions must surely be radiated in all directions – so why is this statement made with monotonous regularity?

    • Craig T says:

      It’s a simplification. Radiation travels in all directions. Roughly half of those directions lead to the surface. I don’t remember anyone specifically saying it radiates in “two directions”, they just say half is toward the surface.

      • Mike Flynn says:

        CT,

        “Roughly” is more pseudoscientific than scientific in this context.

        The Sun radiates in all directions, but is well above the Earth’s surface, so a very small portion of the radiation reaches the surface.

        It makes no difference, in any case. Any GHG which is colder than the surface cannot make the surface (or anything else), hotter than itself. That’s just pseudoscientific nonsense. It doesn’t matter how many imaginary experiments you perform in your imagination – in reality it still doesn’t work.

        Cheers.

    • David Appell says:

      LW emissions must surely be radiated in all directions – so why is this statement made with monotonous regularity?

      Because by symmetry the nonvertical contributions to the atmospheric flux cancel.

      • JDHuffman says:

        David’s incompetence just wiped out his own pseudoscience!

        If the nonvertical cancels, then the DWIR is cancelled by UWIR.

        • David Appell says:

          If the nonvertical cancels, then the DWIR is cancelled by UWIR

          Nope.

          Those are vertical components, not nonvertical (horizontal) components.

          The atmosphere’s density gradient is positive in the downward direction. Hence there is a net DWIR.

          • JDHuffman says:

            DA doesn’t realize there is IR in every direction!

            That’s the advantage of pseudoscience, you get to make it up as you go.

          • David Appell says:

            In fact, that’s exactly what I’ve been talking about.

            Any radiative ray can be decomposed into a horizontal and a vertical component.

            The horizontal components at all altitudes cancel by symmetry.

            The vertical components add, and because of the atmosphere’s density gradient they are net-downward.

          • JDHuffman says:

            In DA’s pseudoscience, the IR emitted by Earth is exceeded by the IR from the atmosphere, which was warned from Earth

            I’m laughing too….

  39. Snape says:

    Its not just me. I noticed Mikes friend, Conspiracy Guy, has the same problem.

    • Eben says:

      I have the same with Firefox , to make a post I use Pale Moon intead

    • Svante says:

      Even barry was a bottom feeder at one time. Said he was not a snob when I pointed it out.
      Salvatore was the most consistent though, hardly any reply in the right place.

  40. Bart T says:

    Dr. Spencer, here’s a sincere question, preceded by an analogy:

    Option 1: I’m 58. Let’s say I go to the doc, he gives me a thorough exam, then informs me, “Our diagnostics show you will die at 63.”

    Option 2: I’m (still) 58. The doc tells me, “You will dies at 68.”

    I prefer Option 2. But, regardless of which option, when I wake up the next morning, I am thinking in a negative way about the future. Whether 5 years or 10 years to live, I’m wondering if there’s anything I can do now to change that prognostic.

    The question: Whether 0.1 C/decade or 0.2 C/decade, in the big picture, aren’t both numbers “bad”? Yes, the latter number buys us more time, but we still should be doing something with that time … now … or so it seems.

    Thanks for any insights.

    • JDHuffman says:

      Bart T, your analogy is set up to be negative. Try a more positive approach:

      You are 22, and you learn you are going to inherit great wealth. The amount will be either $10 billion, or $12 billion.

      The question: Whether $10 billion or $12 billion, in the big picture, aren’t both numbers “good”?

      • Bart T says:

        JD, thanks for the encouragement! 10 or 12 billion, both good.

        Of course, 0.1 C/decade would not be good if continued for a long time. And I do have 6 grandkids (I really am 58, not 22).

        • JDHuffman says:

          6 grandkids at 58! You’re ahead of schedule. I know someone that is 70, but only has 4 grandkids. A neighbor is 78, and only has 7.

          Don’t worry about the AGW nonsense. All the grandkids will have plenty of snow.

    • Eben says:

      Bart T I have very good news for you , you will not die from any kind of climate change – neither warming or cooling

      • David Appell says:

        THe US — is Bart T a US citizen? — is rich enough to pay for the salvation of its citizens.

        And it already is.

        The poor of the world? No such savior. Eben couldn’t care less.

        • Mike Flynn says:

          DA,

          The US Is obviously extremely rich. How else could it accumulate a debt of $22 trillion? That’s quite a lot, even using small American trillions. That’s $22,000,000,000,000.

          You appear not care about the poor of the world either. Who cares? Over 250,000 people die in the US from medical mistakes – what are you doing to stop this waste of life?

          Don’t you care?

          Cheers.

        • Eben says:

          Its now about The poor of the world?

          Dude you are slipping , your red colors and communist ideology motivations are showing.

          • David Appell says:

            Its now about The poor of the world?

            Yes, it has been for a long time.

            Did you really somehow miss that?

          • David Appell says:

            Is “communist” the worst thing you can think to call someone?

            Lame, man.

          • JDHuffman says:

            DA, if you’re into labels, what would you call someone that contributes nothing, has no job, no visible means of support, and wants to determine right and wrong for everyone else?

    • gbaikie says:

      The question: Whether 0.1 C/decade or 0.2 C/decade, in the big picture, aren’t both numbers “bad”?

      Not as bad as -0.1 C per decade.

      Having higher CO2 levels make plants grow better.
      Which means that cropland produce more food.
      And one get more lumber per acre of forest land.

      The result of the industrial revolution, has caused a reduction of global poverty and increase in human population.
      Every year we getting more humans which can cause there to a better world in the future.
      And with all this increase human talent and creativity, maybe at some point in the future, solar or wind energy might be able to work.
      In the meantime, if we want to reduce amount of CO2 emissions, we can make more nuclear powerplants to provide electrical power.

      It this point in time, I don’t think anyone actually wants a colder world, but if it ever gets a lot warmer, then we might then want it to cooler- and there are cheap ways to lower the global average temperatures.

      • David Appell says:

        gbaikie says:
        Having higher CO2 levels make plants grow better.

        Then why are there no plants on Venus or Mars, where the atmosphere is 96% CO2?

        • JDHuffman says:

          DA is famous for his stupid questions.

          • David Appell says:

            At what CO2 level does warming overcome the fertilization effect?

          • gbaikie says:

            Plants also need oxygen.

            But how much oxygen do they need? And seems that some kind of plants [say, perhaps, blue green algae] don’t need oxygen and/or can store enough oxygen to live thru the night.

          • David Appell says:

            CO2 is supposed to be plant food.

            So why isn’t it feeding plants on Venus or Mars? They should be having a big party in an atmosphere with 96% CO2.

            So where are they?

          • JDHuffman says:

            It appears DA knows as little about botany as he does physics.

          • gbaikie says:

            –David Appell says:
            May 16, 2019 at 8:54 PM
            CO2 is supposed to be plant food.

            So why isnt it feeding plants on Venus or Mars? They should be having a big party in an atmosphere with 96% CO2.

            So where are they?–

            Mars is perhaps viable destination for human settlements because it has 25 trillion tonnes of CO2. Martians can grow crops for domestic use and export food, fiber, and booze.

            Mercury is also probably viable destination, but has negative factor as compared to Mars because it lacks large amounts of CO2 {one might be able to mine a million tonnes, but not billions of tonnes}.
            Considering that Moon could solve the delta-v problem by making rocket fuel, Mercury is almost as good as Mars- Humans can travel there in a shorter time period and from Mercury as compared to from Earth, it’s quicker to get to Mars from Mercury then from Earth.
            And rocket fuel on Mercury could cheaper on Mercury surface as compared to Earth surface.
            In terms Venus, it has same problem Earth has, it has about 1 gee of gravity. If you want someplace to have 1 gee, Venus could a be second choice to Earth.
            The CO2 of Venus could be useful as source pure carbon, but if going live on Venus, you would live in the sky, and building structure to grow crops on Venus only has advantage of having air pressure vs building structure in space.
            One could grow crops but it’s pretty expensive to export them off planet. There no reason except perhaps the possibility of using Nuclear Orions, that Venus would cheaper to leave than Earth is. Though Earthlings might become less opposed to using Nuclear Orions launching from Earth and/or fission/fusion rockets might be designed to have less radioactive waste.

  41. PhilJ says:

    DA,

    The Myth of the 1970s Global Cooling Scientific Consensus, ….

    Lol cant fool us who were there….

    I remember watching this the first time it was aired:

    https://youtu.be/L_861us8D9M

    • David Appell says:

      You’re another one who has mistaken a dumb, low-brow, sensational TV program for a scientific consensus.

      In fact, by 1970 plenty of scientists had already been warning about global warming from the buildup of greenhouse gases, and by the late ’60s climate models were calculating the warming expected from CO2.

      List of some of those papers and reports here:
      http://www.davidappell.com/EarlyClimateScience.html

      • Mike Flynn says:

        DA,

        You’re another one who confuses a consensus of any sort as having any authority to determine physical fact. Appeals to the authority of the consensus result in accepting all sorts of things which may prove not only to be wrong, but fatal.

        You can keep believing in phlogiston, the luminiferous ether, the indivisibilty of the atom, lobotomisation, Vioxx, or any stupid thing you like.

        CO2 makes nothing hotter. You are delusional if you believe it does. So are people like Schmidt, Mann, Trenberth, and all the rest of the pseudoscientific nutters. Maybe you could try pretending that fluxes can be added, subtracted and multiplied, producing a useful indication of final temperature. Then you could pretend that measured temperatures are inferior to pseudoscientific fantasy temperatures. See how you go – it might work.

        Cheers.

    • David Appell says:

      And be sure to see this graph from a 1982 internal Exxon report. For today’s CO2 and temperature change they were spot on!

      https://davidappell.blogspot.com/2019/05/exxons-1982-projections-for-co2.html

    • I could not care less about a scientific consensus.

      Throughout history, science progress was made by a single scientist, or a small team, FIGHTING the consensus.

      The 1970’s were unusual because the coming global cooling prediction, from a small minority of scientists, got a lot of media attention.

      In the mid-1970s, after 25 years of global cooling (reduced quite a bit by arbitrary adjustments in the past two decades) it would have been risky to publicly announce predictions of a coming global warming problem — hostile people, like Apple here, would have ridiculed them, and character attacked them.

      Although scientists may not have written many studies about predictions of a long-term global warming crisis, global warming was the primary concern in the 1970s, especially after the climate stated warming in the second half of the decade.

      From an article I posted on my blog today, about climatologist Hubert Lamb, I wrote:

      “During the 1960s, the main concern was with industrial pollution.

      There was ambivalence to whether greenhouse warming would be a good thing, with the
      promise of longer growing seasons, and fewer harsh winters.

      Concern about greenhouse gas emissions dominated later, in the 1970s.”

      ” … Until global warming started, roughly in 1975, it was difficult to demonize man made CO2.

      “The man made CO2 emphasis started in 1970, when a group of 70 invited US scientists
      participated in a month-long live-in workshop, to produce a Study of Critical Environmental Problems (SCEP), under the leadership of an energy strategist at Massachusetts Institute of Technology, Carroll Wilson.

      But they provided little solid data, or strong conclusions to support climate alarm
      over man made CO2.”

      https://elonionbloggle.blogspot.com/2019/05/hubert-lamb-1913-to-1997-greatest.html

      • Craig T says:

        “The effect of CO2 increase itself, although clear in the laboratory and in theory, is not proven as applicable in the global environment context where feedback (i.e. consequential) effects operating through the oceans and water vapour in the atmosphere may greatly alter the outcome. Nor is the net effect of the global increase of turbidity (particulate matter) in the atmosphere as yet certain, since (a) the sizes and distribution of the suspended particles in the world atmosphere may make the difference between a net warming and a net cooling effect, and (b) in this matter also complications may arise through some of the substances facilitating the condensation of water vapour to form clouds.”

        Climate, history and the modern world
        H. H. Lamb 1982

        That’s a mainstream science position from the early 80’s.

        • Bill Hunter says:

          Craig T says:

          “The effect of CO2 increase itself, although clear in the laboratory and in theory,. . . ”

          Your premise is incorrect. Neither are at all clear. Its clearer in theory than the laboratory. The extent that its established in the laboratory is that CO2 absorbs infrared light but nothing on how that might in turn warm the surface.

          The theory has that and an intuitive idea that denser CO2 higher in the atmosphere will cause less heat to escape to space. This gives science the intuitive idea that if it doesn’t it must be due to feedback allowing the upper atmosphere to continue to radiate what it needs to radiate.

          However, it it zero, this falls short because all you might be talking about are upper atmosphere (or top skin) processes and you are still in need of surface forcing and surface forcing changes (bottom skin) which could be an entirely different process and could establish the prefeedback sensitivity in the current atmosphere as zero.

          It would be cool if some of this could be established in the laboratory. I see no reason why not. It seems the reason is mostly because of an attitude the science is settled. . . .just the sort of scientific brain block experienced often in the past.

  42. Snape says:

    Svante
    {You need a proper computer, none of these modern gizmos.
    Linux + Chromium is fine.}

    Ive restricted my internet access to a small iPhone – prevents bingeing on chess. So I might be stuck down here, bad punctuation and all.

  43. David Appell says:

    If Roy had any cojones he’d write up his claim that “Half of 21st Century Warming Due to El Nino” and submit it to a good peer reviewed journal, like a real scientist. (Not the iffy journals he usually submits to.)

    Watch how he won’t.

    • Mike Flynn says:

      If David had any cojones, he’d have some.

      But he didn’t, so he hasn’t.

      Don’t look – avoid severe ocular and mental trauma.

      Cheers.

    • Richard M says:

      David, I actually agree that writing this up would be useful. It shows a nice technique for removing ENSO influence on temperature. However, I would suggest also removing the Karlized changes to the ONI first.

      I suspect he would end up with a slightly different time period for no ENSO influence and reduce all of the already low trends.

    • You mean a “pal reviewed” journal, where anything that could reduce the coming global warming crisis scare, will automatically be rejected, by climate zealots like you. Apple?

  44. Mike Flynn says:

    Maybe its fake news.

    “Science has given us unprecedented knowledge of the natural world, from subatomic particles to the majesty of space,” Clooney said. “Science enables us to cure diseases, to communicate across great distances and to fly. Tragically, though, the volumes of invaluable knowledge gathered over centuries are now threatened by an epidemic of dumb fucking idiots saying dumb fucking shit”

    No, George. People think. From time to time, people come up with useful things.

    From time to time, scientists are able to figure out how Nature seems to work, and then other people come up with more useful things, from time to time. Maybe George could curse a cure for the common cold into existence, to help science along. Or a cure for any other so far incurable disease.

    Ah well, maybe George Clooney is right. Who cares? Not me, thats for sure. If George paid me enough, I’d certainly say nice things about him. How about it George? What’s that you say? You don’t care what I think?

    Exactly.

    Cheers.

    • Craig T says:

      “No, George. People think.”

      People think vaccines cause autism. People think Tesla knew how to get free energy from the universe. People think the world is flat.

      Thinking and unprejudiced evaluation of evidence are two different things.

  45. PhilJ says:

    “Tragically, though, the volumes of invaluable knowledge gathered over centuries are now threatened by an epidemic of dumb fucking idiots saying dumb fucking shit”

    He’s referring to the climate catastrophe nutters, surely….

    Such fanatacism will surely lead to violence.

    How’s that for a ‘projection’ ?

  46. Aaron S says:

    I dont see how anyone can oppose that it is time to crop the CMIP 5 GCM assemblage by removing the most warm models and adding new low CO2 sensitivity models until the P50 of assemblage outputs match the empirical data.

    I find it odd that there are so many taking the position that the anticipated heat from 21st century CO2 is in the ocean. Was the deep ocean warming ever the intention of the GCM assemblage? Does deep ocean warming create the same global catastrophic situation as surface warming? Argo shows only the South is warming and the North and tropics are not. What happens to heat stored in S Oceans? Maybe it melts some sea ice but the circumpolar Antarctic current is not likely going to destabilize antarctic ice sheet which has existed for 10s of millions of years through significantly warmer climates. So deep southern ocean warming is probably just a large heat sink for thousands of years. How do the “deep sea” warmers get around the apparent strawman arguement whereby the converstaion about global warming is at the surface, but the warming they defend models with is deep in a small part of the globe?

    • Entropic man says:

      Aaron S

      ” it is time to crop the CMIP 5 GCM assemblage by removing the most warm models and adding new low CO2 sensitivity models until the P50 of assemblage outputs match the empirical data.”

      Cimate sensitivity emerges during a CMIP run, but is not set in advance.Model runs use the same underlying physics, and vary according to different assumptions about future CO2 emissions and randomised effects such as ENSO and volcanoes.

      In hindsight, the P50 for all the runs reflected higher forcings and a larger temperature rise than actually occured.

      Since you accurately predict human behaviour, ENSO or volcanoes in advance, you make multiple runs under different conditions. This allows you to establish the likely upper and lower limits of the range and inform policy decisions.

      In hindsight you can compare empirical data on CO2 emissions and natural variation with the models. You find that the models which best match observed variation also best match observed temperatures.

      • David Appell says:

        Exxon’s 1982 model projected both CO2 level and temperature increase.

        They were spot-on for the present; see Fig 3 in their document:

        “CO2 Greenhouse Effect: A Technical Review,” internal Exxon document, November 12, 1982.

        http://www.davidappell.com/ECS_articles/1982_Exxon_Primer_on_CO2_Greenhouse_Effect.pdf

        • Aaron S says:

          Dave very cool Exxon data. They describe the 1.3 to 3.1 by 2090 they provide was using the climate sensitivity from external models in academia and Exxons model for CO2 production. They even discuss the scenario that CO2 sensitivity was over estimated. So they did nail it. We are headed to the low range of the distribution. The models we use are very similar to upside down climate models. It is how we model hydrocarbon generation. Our models must be calibrated over and over. We would never accept model error similar to IPCC. Thanks for sharing.

          • David Appell says:

            Their uncertainty band is very small. See their Figure 3.

            Their lower limit for 2090 is *NOT* 1.3 C.

          • Richard Greene says:

            If the Exxon prediction was for 2090, how can anyone declare it is correct in 2019?

          • Craig T says:

            Figure 3 projected a 1 C rise in global temperature between 1960 and 2020. GISTEMP global land and sea from 1960 to 2018 has a trend of 0.164 C per decade. That calculates out to be a 0.98 C warming from 1960 to 2020. Not a bad prediction from almost 30 years ago.

          • Bill Hunter says:

            David Appell says:
            May 16, 2019 at 5:48 PM
            “Exxons 1982 model projected both CO2 level and temperature increase.”

            Its not Exxon’s model David. If you actually took the time to read what you post you would see clearly that this graph is sourced to NOAA and early climate modeling there. The Exxon memo is simply assembling emerging publicly-available science information and disinformation as the case may be.

            Craig T says:
            May 20, 2019 at 11:04 AM

            “Figure 3 projected a 1 C rise in global temperature between 1960 and 2020.”

            That would be about 1 C rise in global temperature between about 1980 and 2020. The 1960 to 1980 temperature curve is off the graph.

      • Aaron S says:

        Entropic. Are you suggesting science “can not” accurately predict ghg outputs? I think u may have typed it backwards. Let me clarify your point.

    • David Appell says:

      Aaron, you don’t understand at all.

      Since > 90% of the CO2-trapped heat goes into the ocean, the ocean’s heat gain or loss is BY FAR the best indicator of a planetary energy imbalance caused by atmospheric GHGs.

      And it shows strong and continuous warming since the 1950s:

      http://tinyurl.com/dbjrlr

      • Aaron S says:

        Dave science has empirical data that antarctic ocean temperatures were much much more elevated during the last interglacial when sea level rose 6m or more. We are not even close to these temperatures today.

        I trust only the Argo part of the data you tag. Boat motor room corrections are not acceptable to me. I prefer paleo data over biased data.

        https://www.nature.com/articles/s41467-018-03328-3. See fig 2 for a measurement how hott antarctic seas were 125k yr bp.

        • David Appell says:

          I wrote about what counts — global ocean warming.

          Antarctica is a small subset of the globe.

          • Carbon500 says:

            DA: You say that ‘Antarctica is a small subset of the globe.’
            Really?
            From Alistair Fothergill in his book ‘Life in the Freezer’, published in 1993:
            ‘Antarctica is a frozen continent larger than Europe, larger even than the United States and Mexico combined. A massive icecap covers 98 percent of that land, swallowing a continent higher than any on Earth.’

          • Mr Apple says:
            “Antarctica is a small subset of the globe.”

            Wrong, as usual, Mr. Apple man !

            Antarctica holds 91% of the worlds land ice, Greenland 8%, and the remaining 1% is spread
            over the rest of the world.

            By holding 91% of the world’s land ice, Antarctica is not only physically large, it is HUGE in the concern about global warming melting land ice, and raising sea level.

            (“HHUUUGGGEEEEEEEEE” should be spoken Bernie Sanders style)

            I wrote an article last week titled: “Fears About Ice Melting Are Not Justified”

            https://elonionbloggle.blogspot.com/2019/05/fears-about-ice-melting-are-not.html

      • Richard M says:

        David, there’s been a strong and continuous warming of the oceans since the 1600s. Yup, your 1950 cherry pick is just a point along a continuous warming period which could not have been caused by CO2 for hundreds of years.

        It turns out the warming also correlates to salinity and current changes. But hey, I know you will continue to deny reality.

        Thirumalai et al 2018.

      • Ice core studies identified multi-hundred year lags between estimated temperature peaks, and estimated CO2 level peaks.

        That strongly suggests it took a long time for oceans to heat and release dissolved CO2.

        Therefore, it is possible that oceans warming in the past ten years, for example, have nothing to do with temperature changes in the past ten years.

        Also, the claim of a “planetary energy imbalance” makes no sense for a planet not in thermodynamic equilibrium — our planet is never in “balance” — it’s always changing — cooling, or warming.

        And no one has any idea what a “normal” global average temperature would be.

        Claiming the relatively cool mid-1700s to be ‘normal’, or ‘good”, and then declaring the current temperature to be unnaturally warm, or ‘bad’, is Climate Alarmist nonsense — which is something you love !

  47. ren says:

    From May 17, for several days, jetstream will cause catastrophic thunderstorms in the central US.
    http://virga.sfsu.edu/gif/19051600_jetstream_h36.gif

  48. barry says:

    For difficulties with posting comments in the right place, I understand phones have a poorer time of it. If you’re on a computer, try clearing cache – if you want to do it just for this page, hitting F5 does the trick on Windows operating systems.

    Could also try scrolling to the bottom of the page and if an answer box is already there with a cancel sign next to it, hit the cancel sign.

    If that doesn’t help you, I’m stumped.

  49. PaulS says:

    Couple of problems here:

    1) The global average temperature response to El Nino lags by months. You can see that your chosen mid-2015 cut off date retains a large MEI spike for the 2015/16 El Nino, but cuts off before the actual global average temperature response. If you take the MEI trend to the end of 2014 it is clearly negative.

    2) MEI contains factors which are themselves subject to long-term secular trends so using that index to find long term trends is inappropriate. Both SOI and Geert Jan van Oldenborgh’s detrended Nino3.4 indicate a small negative ENSO tendency up to mid-2015, and a larger negative tendency up to end of 2014.

    The 2000-mid 2018 trend in both these ENSO indices is completely flat, indicating no net influence on the 2000-2018 global average temperature trend from ENSO variability.

    • barry says:

      “MEI contains factors which are themselves subject to long-term secular trends”

      Updated MEI now has 5 components. Which of these are impacted by secular trends? IIRC, SSTs are, like the other groups, detrended with a sliding baseline. But I haven’t checked out the new methodology.

      • PaulS says:

        Many thanks for the link, I wasn’t aware of the new MEIv2. Cross-checking the values with Roy’s graphs above indicates that he is using the old one.

        MEIv2 appears to have less of a long-term positive inclination than MEIv1. The 2000-mid 2018 trend in MEIv2 is very slightly positive.

        • Richard M says:

          Looks like they are assuming a natural warming of the oceans and subtracting that warming from the ENSO values. This will reduce the El Nino values and increase the La Nina ones.

          Just another adjustment based on what these people want to believe. I suspect this index will see record La Nina events in the coming years.

          • Craig T says:

            “Looks like they are assuming a natural warming of the oceans and subtracting that warming from the ENSO values.”

            Are you talking about MEI2? Some ENSO indexes only compare tropical Pacific sea temperatures to average. the Multivariate ENSO Index also includes pressure patterns that more accurately reflect the differences between an El Nino and la Nina.

  50. David Appell says:

    Roy, I really don’t understand your numbers up here, and I don’t think they are what you think they are.

    It’s not so much about the TREND in MEI, it’s about the average. And those are all negative (La Nina-ish; cooling):

    avg Jan1901-Dec2000 = -0.03
    avg Jan2000-Jun2015 = -0.33
    avg Jan2000- April2019 = -0.22

    Last century was overall ENSO-neutral, which is no surprise.

    But since 2000 the average ENSO state has been La Nina-ish.

    Why is not not a slight cooling influence?

    Also, where do you think the El Nino heat is coming from, anyway? From the ocean. And the ocean is strongly and continuously warming.

    • UK Ian brown says:

      That might all change David if the Sun continues to weaken. Prof in my local University says since 1960 the cycles are weakening and expects it could continue for 300 yrs with consequences not seen since the little Ice Age.

      • David Appell says:

        The question of a decline in solar irradiance was studied several years ago by several groups, and it was found that anthropogenic greenhouse gas warming easily swamps any cooling from a Maunder Minimum-like sun. Cooling by 2100 would only be, at most, 0.3 C below IPCC projections. We will not be entering another Little Ice Age.

        “On the effect of a new grand minimum of solar activity on the future climate on Earth,” G. Fuelner and S. Rahmstorf, Geo Res Lett vol. 37, L05707 2010.
        http://www.pik-potsdam.de/~stefan/Publications/Journals/feulner_rahmstorf_2010.pdf

        “Increased greenhouse gases enhance regional climate response to a
        Maunder Minimum,” Song et al, Geo Res Lett vol. 37, L01703 (2010)
        http://www-cirrus.ucsd.edu/~zhang/PDFs/Song_et_al-2010.pdf

        “What influence will future solar activity changes over the 21st century have on projected global near-surface temperature changes?” Gareth S. Jones, et al, JGR v 117, D05103 (2012) doi:10.1029/2011JD017013, 2012.
        http://www.leif.org/EOS/2011JD017013.pdf

        See also:
        http://www.skepticalscience.com/what-would-happen-if-the-sun-fell-to-maunder-minimum-levels.html

        • Eben says:

          Here we go again,
          Always the same idiotic argument the total sun energy radiance as the only mechanism affecting the earth temperature.

          • David Appell says:

            How does the Sun cause more energy gain that it delivers to the Earth?

          • Mike Flynn says:

            DA,

            You posed the following pointless gotcha –

            “How does the Sun cause more energy gain that it delivers to the Earth?”

            You are talking in riddles, even for one as stupid and ignorant as yourself. You have cranked up your gibberish generator too high, on this occasion. Rethink, and couch you gotcha in more comprehensible terms.

            Just a thought.

            Cheers.

          • Eben says:

            You really have no idea do you ?
            Do you hockey stick glasses completely fog up every time you look at anything other than CO2 controlling the earth temperature ?
            https://bit.ly/2WOWYRg

          • David Appell says:

            Eben says:
            You really have no idea do you ?

            That’s right, I don’t.

            Please educate me.

          • gbaikie says:

            “David Appell says:
            May 16, 2019 at 7:36 PM
            Eben says:
            You really have no idea do you ?

            Thats right, I dont.

            Please educate me.”

            I would interested in what others might say.
            They might say it has to do with the Milankovitch cycles.
            Or ocean circulation [the same thing].
            https://en.wikipedia.org/wiki/Ice_age#Causes

            “The causes of ice ages are not fully understood for either the large-scale ice age periods or the smaller ebb and flow of glacialinterglacial periods within an ice age. The consensus is that several factors are important: atmospheric composition, such as the concentrations of carbon dioxide and methane (the specific levels of the previously mentioned gases are now able to be seen with the new ice core samples from EPICA Dome C in Antarctica over the past 800,000 years); changes in the earth’s orbit around the Sun known as Milankovitch cycles; the motion of tectonic plates resulting in changes in the relative location and amount of continental and oceanic crust on the earth’s surface, which affect wind and ocean currents; variations in solar output; the orbital dynamics of the EarthMoon system; the impact of relatively large meteorites and volcanism including eruptions of supervolcanoes.”

            And related:
            Do ice ages come and go slowly or rapidly?
            “Records show that ice ages typically develop slowly, whereas they end more abruptly. Glacials and interglacials within an ice age display this same trend.

            On a shorter time scale, global temperatures fluctuate often and rapidly. Various records reveal numerous large, widespread, abrupt climate changes over the past 100,000 years. One of the more recent intriguing findings is the remarkable speed of these changes. Within the incredibly short time span (by geologic standards) of only a few decades or even a few years, global temperatures have fluctuated by as much as 15F (8C) or more.

            For example, as Earth was emerging out of the last glacial cycle, the warming trend was interrupted 12,800 years ago when temperatures dropped dramatically in only several decades. A mere 1,300 years later, temperatures locally spiked as much as 20F (11C) within just several years. Sudden changes like this occurred at least 24 times during the past 100,000 years. In a relative sense, we are in a time of unusually stable temperatures todayhow long will it last?”

            Or it appears that exiting a glacial period is fast, and entering glacial period is comparatively slow.

            I would say that Global temperature is always a slow process whether it’s warming or cooling.
            But what we calling global temperature is basically the ocean the average surface air temperature [which same as average ocean surface temperature] and this is can have dramatic changes in temperature, or it’s fragile as depends on thin layer of ocean water.
            And well within human capability to alter this thin layer of ocean water- or doesn’t require much energy.
            So all you do is mix warm surface waters [granted, a vast area] with the cold temperature of the ocean- you pump warm water down a few hundred meter. And require less energy than pumping water up against the force gravity. Or pumping water up a well for 100 meter, takes a lot more more energy then simply overcoming the density difference of warm and cold water. Or the weight difference between 20 C and 2 C sea water is not large.

            So the average global ocean surface temperature is about 17 C and this is what we are measuring and calling global average surface air temperature which is called global temperature.

            But what is global temperature is average volume temperature of the ocean, which currently is about 3.5 C and during glacial period the ocean temperature can get as cool as 1 C and during interglacial period it can get as warm as 5 C.

            So if you mix the surface ocean with rest of ocean the surface temperature become 3.5 C. And we as measure global temperature, if entire surface of ocean was 3.5 C, Earth average temperature for a short period [less than 1 year] is less than 5 C [or colder than any time during any glacial period].
            But if mix the surface with rest of ocean, it actually increasing the actual global temperature [because it’s warming the entire ocean]. So human living on Land are freezing their butt off, but Earth is actually warmer {earth surface will fairly rapidly warm up and then human will not be freezing their butt off].

            So if change how much surface water are mixing with the rest of the ocean, that changing global temperature, but it requires thousands of years to warm or cool the ocean.
            There could be all kinds variants, but it seems with our current ocean and land configuration, one has smaller set variants as compare a wide variety of different ocean and land configurations that has had in it’s history.
            And if you didn’t have Milankovitch cycles then that reduces the amount of variation. Or the Milankovitch cycles are effectively altering our ocean and land configuration.

        • Richard Greene says:

          The sun’s energy as measured by sunspot counts DID fall to maunder Minimum levels FOUR TIMES during the lIttle Ice Age.

          Not one of those minimums had the expected temperature change pattern (at least with central England real time measurements) , including the Maunder Minimum.

          That pattern would be that the climate gets cooler and cooler until the end of the minimum.

          That never happened.

          There were some cool (central England) periods between the four minimums.

          It did get very cold (central england) during the Maunder Minimum but the temperature began rising quickly near the end while TSI was at the lowest point in the Little Ice Age, which made no sense.

          Also there is no measured temperature effect that links with the 11 year sunspot cycle.

          Like most of climate science, there are a lot of mysteries, and few answers.

          There are plenty of people who think they have all the answers, like Mr. Apple, but they don’t

        • Eben says:

          Eben says:
          You really have no idea do you ?

          Thats right, I dont.

          Please educate me.

          I already posted it , but , You cannot educate someone out of his religion
          Why waste time arguing with climate shysters about their primitive CO2 temperature control knob theory , I just give the occasional proverbial kick in the head in lieu of debate and move on.

          • David Appell says:

            Sorry, I missed that link.
            What was it, again?

          • Mike Flynn says:

            DA,

            It appears your faux admission of cluelessness and ignorance has backfired somewhat.

            Eben has attempted to educate you as requested, but you have chosen to ignore his well intentioned efforts.

            I support his fallback position – deliver the occasional proverbial kick to the head, and move along.

            Wise words indeed.

            Cheers.

    • Richard M says:

      David, as another poster mentioned above, your average value of the MEI does not have any meaning when looking at trends. That is why Roy showed the trend in both the MEI and the data and how they change when the trend was calculated over an interval with no MEI trend.

      OTOH, you are correct in a way that you missed. If you look at the global temperature in April-September 2018 and compare it to the early 21st century, rather than computing a trend, there is no warming.

      2001-02.. .18 C
      2007….. .15 C
      2014….. .18 C
      2018….. .20 C

      • Craig T says:

        And if you compare the lowest monthly anomaly in 2000 to the lowest in 2018 you get an increase of 0.29 C. That’s why they call it cherry – picking. Trends are more important than comparing any two monthly temperatures and longer trends are more likely to show what to expect in the future.

        • Richard M says:

          Craig T, this entire article is about the effect of noise on trends. What I did was pick periods of minimal noise and compare them. I realize that the answer is against what you want to believe. That is why you support using noisy data instead of trying to find the truth.

  51. PhilJ says:

    EM,

    “Model runs use the same underlying physics”

    And all share the same funadamentally flawed assumption that the atmosphere warms the surface… They will continue to fail regardless of how they are tweaked as a result….

    • David Appell says:

      Wrong. It’s not an assumption, it’s a consequence of the laws of physics — the Earth emits IR, and CO2 absorbs it.

      • Richard Greene says:

        If CO2 absorbed IR, the planet would never cool off, Apple

      • Mike Flynn says:

        DA,

        Bananas emit IR, and bananas absorb it. Its a consequence of the laws of physics.

        No assumption. Proven fact, unless you have evidence to the contrary, which I doubt.

        Cheers

      • PhilJ says:

        DA,

        “its a consequence of the laws of physics ”

        umm no…

        The laws of physics state that heat can only flow from a hotter object to a colder object without compensation.

        ergo the hotter surface warms the atmosphere and NOT the reverse.

        if you can demonstrate the the 2LOT is no longer valid, there’s a nobel prize waiting for you…

        • David Appell says:

          PhilJ says:
          “if you can demonstrate the the 2LOT is no longer valid, theres a nobel prize waiting for you”

          Dummies like you don’t understand the adiabaticity clause in the 2LOT.

          Dumb.

          • David Appell says:

            “The planetary warming resulting from the greenhouse effect is consistent with the second law of thermodynamics because a planet is not a closed system. It exchanges heat with a high-temperature bath by absorbing radiation from the photosphere of its star and with a cold bath by emitting IR into the essentially zero-temperature reservoir of space. It therefore reaches equilibrium at a temperature intermediate between the two.”

            Pierrehumbert RT 2011: Infrared radiation and planetary temperature. Physics Today 64, 33-38
            http://geosci.uchicago.edu/~rtp1/papers/PhysTodayRT2011.pdf

          • Mike Flynn says:

            DA,

            You appear to be appealing to the authority of the oddly GHE dismissive R Pierrehumbert, who writes in your link –

            “Carbon dioxide is just planetary insulation.”

            In other words, no GHE. Just insulation. And a sadly mistaken R Pierrehumbert would no doubt imply that increasing the amount of insulation between the Sun and a thermometer, would make the thermometer hotter!

            What a fool! In the pseudoscientific climate cult world, fantasy is preferred to fact. No wonder they can’t even describe the GHE! A shambling, disorganised mob of fumbling, bumbling, second raters.

            Oh well, who cares?

            Cheers.

          • PhilJ says:

            DA,

            “It therefore reaches equilibrium at a temperature intermediate between the two.”

            ah yes, that brings up the other fundamentally flawed assumption underlying these models, that the Earth is currently in thermodynamic equilibrium with its surroundings…

            It is not. The Earth has been cooling for 4+ billion years, and it will continue to cooling. It may take billions more years yet before the Earth approaches thermodynamic equilibrium with its surroundings such as the Moon or Mercury..

            “Dummies like you ”

            oh, you have thoroughly thrashed me with this amazing display of intellect and wit.. Surely I must admit defeat in the face of such powerful logic…

            what a clown…

        • bdgwx says:

          Phil, “without compensation”. That is an extremely important clause that is often overlooked. Modern statements usually say “spontaneously”, “by its own means”, “without external stimuli”, or the like. The 2LOT is valid for all isolated systems. It’s just that the atmosphere is not an isolated system.

          • JDHuffman says:

            bdgwx, are you STILL trying to imply the atmosphere can violate the laws of physics?

            Why would anyone keep promoting such nonsense?

          • bdgwx says:

            I’m implying that lowered entropy in the atmosphere is not a violation of the laws of physics because the atmosphere is not an isolated system.

          • PhilJ says:

            bdgwx,

            “That is an extremely important clause that is often overlooked”

            the universe is an isolated system and thus the 2LOT applies everywhere.

            All natural processes increase the entropy of the universe and all natural systems evolve to produce the maximum possible increase in entropy..

            In other words, water always flows naturally downhill, and that by following the path of least resistance…

            What compensating work is being performed that causes heat to flow from a colder atmosphere to a warmer surface?

          • JDHuffman says:

            bdgwx says: “I’m implying that lowered entropy in the atmosphere is not a violation of the laws of physics because the atmosphere is not an isolated system.”

            bdgwx, why is that different than me implying that you owe me $1,000,000?

            Either pay up or learn some physics….

          • bdgwx says:

            Phil, heat doesn’t flow from the atmosphere to the surface. The atmosphere reduces the rate of heat loss from the surface. And the more GHGs there are the more the more the rate of heat loss is reduced. This is conceptually similar to temperature of your home in the presence of a furnace and insulation. The temperature will increase as insulation increases. Neither scenario is a violation of the 2LOT because those systems are not being allowed to evolve by their own means since an external stimuli is being applied.

          • Mike Flynn says:

            b,

            You wrote –

            “This is conceptually similar to temperature of your home in the presence of a furnace and insulation. The temperature will increase as insulation increases.”

            My home uses insulation to lower the temperature – no heating needed or required. Too much heat from the Sun.

            How does your GHE concept cope with this?

            You can’t actually describe the GHE, can you? A conceptually imaginary concept, born in the vapid minds of the pseudoscientific climate cultists.

            If, as you write, heat doesn’t flow to the surface from teh atmosphere, then why are thermometers showing increased temperatures, in spite of the fact that the Earth’s surface has cooled over the last four and a half billion years?

            Maybe you need to add more epicycles, or whatever the pseudoscientific climatological equivalent is.

            Cheers.

          • PhilJ says:

            bgdwx,

            “Phil, heat doesn’t flow from the atmosphere to the surface”

            Agreed! This is a breakthrough! we can work from this agreed principle…

            And so I repeat “And all share the same funadamentally flawed assumption that the atmosphere warms the surface…”

            As you agree that heat does not flow from the atmosphere to the surface, then you agree that the atmosphere is not a heat source thus it does not warm the surface.

            Perhaps we are using the word warm differently? To me warm and heat are synonymous , they mean to raise the temperature…

          • Svante says:

            Heat has a well defined meaning in physics.
            It constitutes a transfer of net energy.
            Temperature is stable if there is a separate heat loss of the same size.

          • Craig T says:

            “As you agree that heat does not flow from the atmosphere to the surface, then you agree that the atmosphere is not a heat source thus it does not warm the surface.”

            In the same sense that a reflective mylar blanket is not a heat source thus it doesn’t warm a person. Still someone wrapped in a reflective blanket will be warmer than someone without.
            https://en.wikipedia.org/wiki/Space_blanket

          • bdgwx says:

            Phil,

            Yes. I believe the semantics of “warming” may different between different people.

            When most of us use the word “warming” we are talking about an increase in temperature. In the context of global warming the defining metric is the global mean temperature. If that increases we call it “warming”.

            “warming” in this context can result in the presence of a colder body blocking the radiation from a warmer body thus reducing the rate of heat loss from the warmer body. This mechanism of reducing the rate of heat loss can augment an even hotter body’s ability to increase the temperature of the warmer body.

            Again, the insulation and furnace in your home are conceptually similar. The insulation isn’t producing heat. But it does reduce the rate of heat loss thus augmenting your furnace’s ability to increase the temperature. The temperature in your home will be “warmer” than it would be otherwise if the insulation were not present. And in a similar manner adding more insulation will “warm” your home even though it produces no new heat itself.

          • PhilJ says:

            bdgwx,

            “When most of us use the word warming we are talking about an increase in temperature.”

            Indeed , which is why most people use warming and heating synonymously.

            Hence my confusion when one who admits the atmosphere doesnt heat the surface, also claims the atmosphere warms the surface.

            Your reference to insulation rather drives the point home. The insulation does not warm your house, the heater does…

            If we are agreed on this, I would be happy to explore your idea that the atmosphere is like insulation..

          • bdgwx says:

            Phil,

            Yep. The insulation in your home does transfer heat into your home. The furnace does. Yet when you add insulation the temperature in your home increases. We still call that “warming” because…ya know…the temperature went up.

            What do you call it when the temperature increases?

          • bdgwx says:

            Doh…typo. That should have said “The insulation in your home does NOT transfer heat into your home.” I’m in agreement with you on that. And I’m in agreement that the atmosphere does NOT transfer heat into the geosphere. The heat is already there. It’s just not being allowed to escape to space.

          • PhilJ says:

            bdgwx,

            “The insulation in your home does NOT transfer heat into your home.” I’m in agreement with you on that. And I’m in agreement that the atmosphere does NOT transfer heat into the geosphere”

            Ok, good.

            Now let’s consider the atmosphere as an insulator.

            To me, and insulator is something that retards (or blocks) the flow of energy through its medium.

            and the atmosphere certainly does this to the flow of energy from the sun to the surface. This is (one reason) why the Moon’s surface reaches much higher temperatures in direct sunlight than the earth does…

            so if we increase the amount of insulation, will the insolation at the surface increase or decrease?

            ah but we havent yet determined if we are increasing or decreasing the insulation…

            burning of fossil fuels removes o2 and replaces it with h20 and co2…

            which of these are better insulators?

            h20 moves enormous amounts of energy from the surface to the TOA much more quickly than co2 or o2 so is clearly the worst insulator (retards energy flow the least).

            co2 is orders of magnitude a better insulator than h20 but is a worse insulator than o2.

            are we then increasing or decreasing insulation?

    • Richard Greene says:

      The greenhouse effect is in the troposphere.

      If that effect is warming in the troposphere, then that would men the atmosphere warms the surface.

      The warming could not be expected to be 100% efficient, so the surface warming should be less than the troposphere warming.

      But surface data reflect MORE warming, meaning there is a data problem, or a portion of surface warming is caused by other factors.

      There is no scientific proof that any of the surface warming is caused by CO2.

      Much larger surface temperature changes have had natural causes in the past — in fact there were 4.5 billion years of natural climate changes.

      The claim that CO2 took over in 1940 (or 1970) as the ‘climate controller’ is climate change parrot nonsense.

      I’m sure Mr. Apple will come along soon to do his usual squawking.

      • David Appell says:

        Richard Greene says:
        The warming could not be expected to be 100% efficient, so the surface warming should be less than the troposphere warming.

        What’s your proof of this claim?

        • Richard Greene says:

          Apple where’s your proof that surface warming at a greater rate than troposphere warming does not suggest data collection problems?

          And how about the massive infilling (wild guesses) used for your beloved surface data — more grid cells have infilling than those that don’t.

          Here are some charts explaining the sparse data collection for your beloved surface “data”:

          https://elonionbloggle.blogspot.com/2019/04/for-land-areas-on-chart-gray-signifies.html

          Really bad coverage before 1920:
          https://elonionbloggle.blogspot.com/2019/04/1891-to-1920-land-surface-weather.html

          I’d be embarrassed to use “data” like that … but YOU love it !

          • Richard Greene says:

            I’m waiting to hear your scientific explanation (excuse) for the massive amount of data infilling (wild guessing) in the surface temperatature record perfesser Apple.

            Please give us your “lecture”.

          • David Appell says:

            Richard, are you aware that the satellite measurements

            1) do not measure temperature.

            2) are adjusted much more than the surface datasets.

            3) that adjustments to surface data REDUCE the long-term warming trend?

          • Mike Flynn says:

            David, are you aware that you have not addressed the question.

            Is it because –

            1) You are stupid and ignorant,

            2) You are a vituperative troll,

            3) All of the above?

            The world wonders,

            Cheers.

          • Apple, I am aware that you are the “stopped clock” of climate non-science scaremongering.

            Everything ever claimed about FUTURE global warming being bad news is automatically believed by you.

            The reality of 300+ years of PAST global warming means nothing to you.

            Anecdotal evidence of unusually cold and unusually warm periods in the past 2,000 years mean nothing to you.

            You have your smarmy Mann Hockey Stick Fraud Chart where local tree ring proxy data, not acceptable for global temperature reconstructions, was truncated when the data showed cooling in modern times, and then secretly spliced to surface thermometer data — which were haphazard before 1950 due to excessive infilling, without telling anyone that two completely different data sources were used on one chart — the fraudulent hockey stick chart, that you SO love.

          • Mr. Apple, We are still waiting for your lecture on the massive amount of infilling (wild guessing of numbers by government bureaucrats) in your beloved surface data global average temperature.

            Here are a few related charts for readers patiently waiting for Mr. Apple’s (brilliant, we hope) comments on the low quality of surface temperature numbers:

            https://elonionbloggle.blogspot.com/2019/04/1891-to-1920-land-surface-weather.html

            https://elonionbloggle.blogspot.com/2019/04/for-land-areas-on-chart-gray-signifies.html

          • bdgwx says:

            RG, Is there is a dataset that publishes a global mean surface temperature that you feel is trustworthy that we can use test hypothesis regarding global temperature change?

      • David Appell says:

        Richard Greene says:
        Much larger surface temperature changes have had natural causes in the past in fact there were 4.5 billion years of natural climate changes.

        What caused these changes, Richard?

        And who discovered them? (A: The same scientists who are today warning about man made global warming.)

        • Mike Flynn says:

          DA, you wrote –

          “What caused these changes, Richard?

          And who discovered them? (A: The same scientists who are today warning about man made global warming.)”

          Ooooh! A gotcha! How cunning!

          What happens if he manages to avoid falling into your superbly constructed example of complete foolishness, cunningly concealed as a trap? Will you cry, perhaps?

          Do tell us.

          Cheers.

        • Scientists have been warning about a coming global warming crisis since oceanographer Roger Revelle and his team in 1957.

          It is long past time to stop listening to climate change scaremongering.

          Not for brainwashed climate alarmists like you, of course — you just LOVE predictions of doom — but certainly for sensible people who are enjoying the best climate in their lifetimes — in fact the best climate for humans and animals in over 300 years.

          I know how you hate good news about the climate but that is reality, and the earth is greening too — also reality, ask NASA.

          It’s too bad you leftists are always so miserable and expecting bad news in the future.

          The Holocene interglacial ending might be REAL bad news — you could worry about that — bad news completely unlike a harmless +0.1 degree change in the global average temperature that is mainly in the higher latitudes, mainly in the six coldest months of the year, and mainly at night:

          https://elonionbloggle.blogspot.com/2019/05/us-warming-mainly-at-night-79.html

          • Bill Hunter says:

            Richard – Roger Revelle was an outstanding scientist and never spread alarm about climate change. He always couched in terms of a “potential problem” and promoted research on it. But that’s enough to scare the snot out of the weak minded and apparently create a panic. After all Roger’s generation was far more pragmatic than today’s substance abuse hallucinating generation.

          • Craig T says:

            Roger Revelle’s generation didn’t have the data to show to what extend the impact of increasing CO2 would be. In 1982 Revelle said “We must conclude that until a warming trend that exceeds the noise level of natural climatic fluctuations becomes clearly evident, there will be considerable uncertainty and a diversity of opinions about the amplitude of the climatic effects of increased atmospheric CO2. If the modelers are correct, such a signal should be detectable within the next 10 or 15 years.”

          • Richard Greene says:

            Roger Revelle found out that by predicting a coming climate problem, stated with great certainty, funding to study that problem was much easier to get. Other scientists learned that strategy for getting funding.

            The claim that Revelle was cautious about global warming has been disputed. Al “The Climate Blimp” Gore claimed he was senile and didn’t know what he was saying near the end. He was a co-author of “”What to do about greenhouse warming: Look before you leap,” in 1991. A lawsuit by one of the other authors refuted that charge.

            Revelle’s family claims he was always concerned about global warming. Roger’s daughter, Carolyn Revelle, allegedly wrote:

            “Contrary to George Will’s “Al Gore’s Green Guilt” Roger Revelleour father and the “father” of the greenhouse effectremained deeply concerned about global warming until his death in July 1991.”

            Climate alarm in 1957 was nothing compared with climate alarm in 2019

          • bill hunter says:

            “If the modelers are correct, such a signal should be detectable within the next 10 or 15 years.”

            Problem is the signal faded as noted in this post it has continued to be muted. So if anything we are getting further away rather than closer.

            Richard Greene says:

            “Gore claimed he was senile and didn’t know what he was saying near the end.”

            Al Gore has more BS than a rodeo. Plenty of proof of his clarity of mind are floating around in numerous videos of lectures he gave around that time. Anyway one does not consistently make the point that the science is not settled and even go back to put that precaution in a sentence in the middle of a lecture what he left out apologizing for it when one is senile. Al Gore has likely been senile since the day he was born.

            “Roger Revelle our father and the “father” of the greenhouse effect remained deeply concerned about global warming until his death in July 1991.”

            I said he was concerned and I also said he was a good scientist. A good scientist knows that you have to be dispassionate, independent, and 100% objective to even claim you have science to back up potentially alarming warming. “Concern” rates a big fat zero on the science scale.

            I will say it one more time the past century of warming is not alarming. Alarm comes with every El Nino that pushes the short term trend higher (oh my gawd its accelerating) and the morons start running around like a huge flock of chicken littles. . . .another fine tale of human nature.

  52. David Appell says:

    Are you really trying to deny that carbon dioxide ab.sorb.s infrared radiation?

    That’s just primitive stupid. The ab.sorp.tion was measured in 1859.

    • Richard Greene says:

      CO2 absorbs and re-emits, or re-radiates, energy.

      Just absorbing would be a completely different process — it would get mighty hot on this planet!

      be careful with your language Mr. Professional (fiction) Writer !

      • David Appell says:

        Richard Greene says:
        CO2 absorbs and re-emits, or re-radiates, energy.

        Exactly. And that’s exactly what global warming is.

        • Mike Flynn says:

          DA,

          Bananas absorb and emit IR. So does all matter in the known universe.

          Temperatures are not measured in W/m2.

          Glass is transparent to visible light – the photons ignore it.

          Gavin Schmidt is a mathematician, not a climate scientist (except in his own imagination).

          Michael Mann appears to be delusionally psychotic. Not a Nobel Prize winner at all.

          Neither you nor anybody else has actually managed to describe the GHE in any useful sense.

          Carry on regardless.

          Cheers.

          • richard Greene says:

            I’m not getting your fascination with bananas, Flynn.
            How do you feel about kumquats ?

          • Mike Flynn says:

            rG,

            DA keeps pointing out that CO2, like all matter in the universe, absorbs and emits IR. He seems to believe this makes the Earth hotter. I disagree with the hotter Earth bit.

            At one time, I pointed out that not only do bananas absorb and emit IR, but bananas also emit ionising radiation, as they are radioactive. This makes bananas even more effective than CO2 as a source of heat.

            I’m not sure about the miraculous global warming properties of kumquats, but I’m always prepared to be amazed, I’ll stick to bananas.

            Maybe I should not poke fun at DA. He seems to have enough mental problems, without me adding to them by regarding him as an object of derision, and offering to sell him to anybody who needs a butt for their jokes. Only joking, of course.

            Cheers.

        • Richard Greene says:

          If global warming “is CO2”, then how do you explain the warming seen in Vostok, Antarctica ice core studies, that preceded CO2 changes by hundreds of years, rather than following CO2 changes?

          • bdgwx says:

            CO2 was not the initial catalyzing agent for warming epochs during the glacial cycles. That necessarily means its dependence upon temperature (feedback) was dominating over temperatures dependence upon CO2 (forcing) for the initial interglacial ascent phase. Once the initial catalyzing agent waned CO2’s forcing effect began dominating thus amplifying and prolonging the warming epoch. Contrast that scenario with the PETM or the modern era when a large pulse of CO2 was the initial catalyzing agent for these warming events. In these cases CO2’s forcing effect dominates over its feedback effect in the early stages of the temperature profile.

    • Mike Flynn says:

      DA,

      Are you denying that bananas absorb and emit infrared radiation?

      And, just like CO2, they will radiate infrared ceaselessly, until they reach absolute zero, if allowed to do so!

      Your 16 hours of journalism study hasnt done much for you, has it?

      Cheers.

  53. David Appell says:

    gbaikie says:
    Having higher CO2 levels make plants grow better.
    Which means that cropland produce more food.

    That’s not what the science says.

    For wheat, maize and barley, there is a clearly negative response of global yields to increased temperatures. Based on these sensitivities and observed climate trends, we estimate that warming since 1981 has resulted in annual combined losses of these three crops representing roughly 40 Mt or $5 billion per year, as of 2002.
    — Global scale climatecrop yield relationships and the impacts of recent warming,” David B Lobell and Christopher B Field 2007 Environ. Res. Lett. 2 014002 doi:10.1088/1748-9326/2/1/014002
    http://iopscience.iop.org/1748-9326/2/1/014002

    With a 1 C global temperature increase, global wheat yield is projected to decline between 4.1% and 6.4%. Projected relative temperature impacts from different methods were similar for major wheat-producing countries China, India, USA and France, but less so for Russia. Point-based and grid-based simulations, and to some extent the statistical regressions, were consistent in projecting that warmer regions are likely to suffer more yield loss with increasing temperature than cooler regions.
    – B. Liu et al, Similar estimates of temperature impacts on global wheat yields by three independent methods, Nature Climate Change (2016) doi:10.1038/nclimate3115, http://www.nature.com/nclimate/journal/vaop/ncurrent/full/nclimate3115.html

    “Agriculture is one of the economic sectors most exposed to climate change impacts, but few studies have statistically connected long-term changes in temperature and rainfall with yields. Doing so in Europe is particularly important because yields of wheat and barley have plateaued since the early 1990s and climate change has been suggested as a cause of this stagnation. Here, we show that the impact of climate trends can be detected in the pattern of long-term yield trends in Europe. Although impacts have been large in some areas, the aggregate effect across the continent has been modest. Climate trends can explain 10% of the slowdown in wheat and barley yields, with changes in agriculture and environmental policies possibly responsible for the remainder.”
    — “The fingerprint of climate trends on European crop yields,” Frances C. Moorea and David B. Lobell, PNAS vol. 112 no. 9, 26702675 (2015)
    http://www.pnas.org/content/early/2015/02/11/1409606112.abstract

    Total protein and nitrogen concentrations in plants generally decline under elevated CO2 atmospheres. Recently, several meta-analyses have indicated that CO2 inhibition of nitrate assimilation is the explanation most consistent with observations. Here, we present the first direct field test of this explanation.. In leaf tissue, the ratio of nitrate to total nitrogen concentration and the stable isotope ratios of organic nitrogen and free nitrate showed that nitrate assimilation was slower under elevated than ambient CO2. These findings imply that food quality will suffer under the CO2 levels anticipated during this century unless more sophisticated approaches to nitrogen fertilization are employed.
    — Nitrate assimilation is inhibited by elevated CO2 in field-grown wheat, Arnold J. Bloom et al, Nature Climate Change, April 6 2014.
    http://www.nature.com/nclimate/journal/vaop/ncurrent/full/nclimate2183.html

    Higher CO2 tends to inhibit the ability of plants to make protein And this explains why food quality seems to have been declining and will continue to decline as CO2 rises because of this inhibition of nitrate conversion into protein. Its going to be fairly universal that well be struggling with trying to sustain food quality and its not just protein its also micronutrients such as zinc and iron that suffer as well as protein.
    – University of California at Davis Professor Arnold J. Bloom, on Yale Climate Connections 10/7/14
    http://www.yaleclimateconnections.org/2014/10/crop-nutrition/2014

    • Bill Hunter says:

      David Appell said: “For wheat, maize and barley, there is a clearly negative response of global yields to increased temperatures.”

      You spouting academic model nonsense again David? That sort of stuff is wrong far more often than its right. Fact is wheat production is up globally 33% in 2017 over 1996.
      https://en.wikipedia.org/wiki/International_wheat_production_statistics

      Now that is either due to your imaginary model driven warming trend or due to improved human technology, wouldn’t you think?

    • Thousands of studies confirm what greenhouse owners around the world have known for decades — CO2 enrichment increases plant growth.

      There may a be a few studies that say otherwise, but only a deceptive Climate Alarmist like you would focus on the very few and ignore the other 99%, to support an agenda of scaring people about completely harmless, mild, intermittent global warming. beneficial if you believe in REAL science.

      You should be ashamed of yourself, Apple.

      I published three more summaries of studies proving more CO2 benefits plants:

      https://elonionbloggle.blogspot.com/2019/05/juozapaitiene-et-al-2019-effects-of.html

      https://elonionbloggle.blogspot.com/2019/05/dong-et-al-2019-co2-induced-enhancement.html

      https://elonionbloggle.blogspot.com/2019/05/parvin-et-al-2018-2-year-free-air-co2.html

      And one summary of a study of coral:

      https://elonionbloggle.blogspot.com/2019/05/thomas-et-al-2018-review-of-coral.html

      • David Appell says:

        Richard Greene says:
        Thousands of studies confirm what greenhouse owners around the world have known for decades CO2 enrichment increases plant growth.

        Greenhouse managers can control temperature and water, right?

        Are these controllable outside of a greenhouse? Hmm?

        • Bill Hunter says:

          David Appell says:
          “Greenhouse managers can control temperature and water, right?
          Are these controllable outside of a greenhouse? Hmm?”

          Good question. More uncertainty, except that most crop problems arise out of shortened growing seasons rather. Never seen a problem with a lengthing growing season.

        • The studies supporting CO2 enrichment for better C3 plant growth must exceed contrary studies by over 10 to 1 — perhaps even 99 to 1.

          Many of the studies were done outdoors, Apple.

          So you are in the tiyt (wrong) minority on this subject, as usual Apple.

          Greenhouse owners around the world spend their own money for CO2 enrichment systems, and fuel for them, for a good reason.

          We have 300 years of experience with global warming since the 1690s, and 78 years of experience with global warming and rising CO2 levels since 1940.

          Farming productivity remains in an uptrend.

          More CO2 in the air would help plant growth even more.

          Longer growing seasons would help even more.

          Are you against more food for the malnourished and starving people on this planet ?

          With higher CO2 levels, C3 plants grow faster, larger, and have lower fresh water requirements too — stomata stay open for a shorter period of time to absorb sufficient CO2, so transpiration water losses are reduced.

          Why are you so anti-CO2, and anti-science, Apple ?

          You focus only on the few bad news “studies” while ignoring the other 99% !

          Of course if plants don’t get water, they will die — what does that have to do with CO2 enrichment ?

    • Gordon Robertson says:

      DA…”That’s not what the science says”.

      You mean the pseudo-science with which climate models and climate alarmists are programmed.

  54. Richard Greene says:

    Apple, you’ve done it now — the most clueless comment on this thread:

    Having higher CO2 levels make plants grow better.
    Which means that cropland produce more food.

    “Thats not what the science says” according to Mr. Apple !!!
    .
    .
    .

    Not only is that wrong, but there are thousands of experiments — for you, the lover of experiments, at least when they back your nonsense — to prove that.

    And greenhouse owners using CO2 enrichment systems all around the world — but then what could greenhouse owners know about growing plants ?

    There are more studies every week.

    A summary of the studies required 1,078 pages:
    http://climatechangereconsidered.org/wp-content/uploads/2019/01/CCR-II-Biological-Impacts-full-report.pdf

    A summary of the summary required 20 pages:
    https://www.heartland.org/_template-assets/documents/CCR/CCR-IIb/Summary-for-Policymakers.pdf
    .
    .

    I summarized several experiments in my blog in recent weeks:

    https://elonionbloggle.blogspot.com/2019/05/kaciene-et-al-2019-positive-influence.html

    https://elonionbloggle.blogspot.com/2019/05/lahijani-et-al-2018-huge-potato-growth.html

    https://elonionbloggle.blogspot.com/2019/05/lahijani-et-al-2018-huge-potato-growth.html

    https://elonionbloggle.blogspot.com/2019/05/the-recent-co2-increase-has-had-even.html

    • David Appell says:

      Richard, are you in 7th grade?
      Do you think you’re clever for purposely misspelling my name?
      Do you think that wins points for your views?

      • Mike Flynn says:

        Begone, witless troll!

      • Richard Greene says:

        If “Apple” gets your attention, then it is worth it’s weight in gold !

        My views are based on real science — the study of the past climate, with no wild guess, computer game, always wrong, predictions of the future climate.

        Your views are based on fantasies of a coming climate catastrophe, that never comes, and will never come.

        It appears that your magical thinking about the scary future in your imagination, is much closer to a scary seventh grade campfire fairy tale, than my climate realism.

    • David Appell says:

      https://elonionbloggle.blogspot.com/2019/05/kaciene-et-al-2019-positive-influence.html

      Going by your chart at the top of the page, climate models are spot-on.
      Good to know.

      • The purpose of an absolute temperature chart, as on my blog home page, represented by 135+ red-line thermometers, one for the average temperature of each year on the chart, make the temperature change estimates FAR LESS SCARY than the deceptive temperature anomaly charts, where 0.1 degree C. changes on a chart, that only covers a range of 1 or 1.5 degrees C., in the global average temperature, appear HUGE and SCARY … which is great propaganda for you Climate Alarmists.

        Unlike the honest absolute temperature in F. global warming chart on my home page.

        By the way Apple, you should avoid visiting my blog — every time you peak, another page view is added to the total — 84 page views so far today, 104 yesterday, and 2,607 in the past month. I’d visit your blog, but I don’t want to double your page view count!

      • “Going by your chart at the top of the page, climate models are spot-on. Good to know”.

        That’s not a climate model on my blog home page.

        That’s an absolute temperature depiction of the NASA GISS global average annual temperatures IN THE PAST, by year, from 1880 to 2016, based on data at the time.

        We don’t need models to tell us the PAST temperatures (not that surface data is trustworthy before 1950, but that’s all we had for my chart !.

        The model-based predictions of the FUTURE climate is our concern — with model predictions of a warming rate (excluding the Russian model) that average QUADRUPLE the actual rate of warming from 1940 through 2018.

        Climate alarmists like you are claiming future warming while CO2 is added to the atmosphere will be QUADRUPLE the past warming rate while CO2 was added to the atmosphere.

        That’s the junk science of always wrong climate computer games = your favorite “science”, Apple ?

        • bdgwx says:

          I’d like to talk about that absolute temperature graph. Why did you decide to use -40F and 120F as a range for your y-axis? Typically use 1 or 2 standard deviations above and below the min/max of the variable for the y-axis range.

          • I didn’t decide to use -40 to 120F, although that temperature range, covers most places on our planet, most of the time.

            I “borrowed” the chart from someone else who chose that range.

            But then an actual “red line” thermometer might cover -40 to 120F.

            I would prefer to ignore GISS data before 1950, because there were too few Southern Hemisphere data before the WW II ended, and FAR too few Southern Hemisphere data before 1920.

            But there were no satellite data available before 1979, so I used what data there were — showing the data on “ordinary” thermometers, as on my blog home page, is far less scary than anomaly charts, that cover a range of 1.5 degrees C., and make a 0.1 degree C. changes look too big.

          • bdgwx says:

            The range of the global mean surface temperature is not -40F to 120F though. The point of a graph is to be able to quantify trends and variability in the data at a glace. That isn’t really possible for the graph on your homepage though.

          • bill hunter says:

            bdgwx says:The point of a graph is to be able to quantify trends and variability in the data at a glace.”

            actually thats not the job of graph. Thats the job of mathematics. The job of a graph is to give a realistic view of the data within a relevant context, like showing a correlation between two variable over time. Seems to me the main objective of a temperature graph is to put it into the context that people live in, I suppose from Eskimos to Libyans. but i agree the range could have been -15F to 100f

        • David Appell says:

          Richard Greene says:
          We dont need models to tell us the PAST temperatures….

          What an naive statement.

          “Without models, there are no data.”

          – Paul N. Edwards, “A Vast Machine”
          http://pne.people.si.umich.edu/PDF/Edwards_2009_A_Vast_Machine_Introduction.pdf

          • Models do not produce real data.

            They can be used to analyze real data.

            Models produce whatever numbers / predictions the programmers want them to produce.

            Measurements are real data.

            If they are “adjusted”, the measurements are no longer real data.

            They become someone’s view of what the real data would have been if measured correctly the first time.

            Anyone who doesn’t understand the difference between models and real measurements / observations, is a science denier, and also a Ding Ding Ding bat.

            Now I understand why you are a climate alarmist, Apple — you think models produce real data.

        • David Appell says:

          Climate alarmists like you are claiming future warming while CO2 is added to the atmosphere will be QUADRUPLE the past warming rate while CO2 was added to the atmosphere.

          Who says this?

          Citations?

          • The actual warming from 1940 through 2018 is at a rate of about +0.77 degrees C.
            per century (using UAH data from 1979)

            The average climate model predicts about +3 degrees C. warming in the next century. excluding the Russian model, an outlier, that seems somewhat accurate.

            Most comparisons of the average model prediction and reality start in 1979, only because that’s when weather satellite data began.

            Here’s a popular chart, by Mr. Christy of UAH:
            https://elonionbloggle.blogspot.com/2019/05/climate-models-versus-reality.html

            With that starting point, the average climate models predicts roughly TRIPLE the warming rate in the weather satellite and radiosonde observations.

            It would be more accurate to start in 1940, when man made CO2 emissions started ramping up — then we get to QUADRUPLE the observed warming rate.

            Any way you look at the climate models, they have grossly over-predicted long term global warming.

            They are just as bad when backtested for 1910 through 1940, and even worse from 1940 through 1975.

            You’ve got to stop drinking before you comment here, Apple.

    • David Appell says:

      https://elonionbloggle.blogspot.com/2019/05/lahijani-et-al-2018-huge-potato-growth.html

      Good lord, you need some lessons in presentation.

      Your blog posts are unreadable, son.

      Seriously.

      • Mike Flynn says:

        Begone apple-esque troll!

      • Craig T says:

        “Your blog posts are unreadable, son.”

        I’ve been holding my tongue on that.

        • JDHuffman says:

          Craig, you might want to hold your tongue indefinitely, or at least until you learn some physics.

      • Please don’t read my blog Apple, I just cleaned there yesterday!

        • David Appell says:

          What blog?

          Why should I read it, when what you write here is so wrong?

          • Over 1,000 more page views at my blog since May 13, Apple.

            I’d visit your blog, but I wouldn’t want to double the page views !

            If you agreed with anything I wrote, I’d be worried !

            I am thrilled that you disagree with me.

            You are a climate change scaremonger, always worried about a fictional coming climate change disaster — coming for the past 60-+ years, but it never arrives !

            i am a realist who enjoys the current wonderful climate, and wishes for more global warming for people, and more CO2 in the air for plants.

  55. Mike Flynn says:

    David Appell wrote –

    “Citing research is the OPPOSITE of “appealing to authority.””

    Really? I suppose David is gullible enough to believe that pseudoscientific climate cult nonsense published in “pay to play” journals such as Nature, is true, or even useful? Why even cite it, if you are not appealing to the authority of the authors?

    Next thing, he’ll be be stupid enough to believe that Gavin Schmidt is a climate scientist, or that Michael Mann is a Nobel Prize winner? David wouldn’t be stupid enough to cite “research” from frauds like these, would he?

    David can’t even describe the GHE, can he? What a Wally David is!

    Cheers.

  56. David Appell says:

    Richard Greene says:
    If CO2 absorbed IR, the planet would never cool off, Apple

    OMG, you are denying the most basic of physics.

    Don’t know what to say about that.

    Look here:
    http://clivebest.com/blog/wp-content/uploads/2010/01/595px-atmospheric_transmission.png

    • David Appell says:

      And here:

      1861
      “On the Ab.sorp.tion and radiation of Heat by Gases and Vapours, and on the Physical Connexion of Radiation, Ab.sorp.tion, and Conduction,” John Tyndall, Philosophical Magazine Series 4, 22, 169-194, 273-285 (1861).

      The Bakerian Lecture: On the Ab.sorp.tion and Radiation of Heat by Gases and Vapours, and on the Physical Connexion of Radiation, Ab.sorp.tion, and Conduction, John Tyndall, Philosophical Transactions of the Royal Society of London, Vol. 151 (1861), pp. 1-36
      https://is.gd/QSvdod

      • David Appell says:

        Roy, when are you going to fix this ridiculous problem that prevents writing ab.sorp.tion without the dots???

        • Mike Flynn says:

          DA,

          How about never? What do you intend to do if you don’t receive an answer that suits you?

          Hold your breath until you turn blue? Have a tantrum?

          The world wonders, and waits!

          Cheers.

      • Gordon Robertson says:

        da…”The Bakerian Lecture: On the Ab.sorp.tion and Radiation of Heat by Gases and Vapours…..”

        Written in the days before it was understood that heat can neither be radiated nor absorb-ed. In the days of Tyndall, it was thought heat flowed through an invisible aether as heat rays.

        Appell still thinks heat flows to us from the Sun through a vacuum.

    • Mike Flynn says:

      DA,

      Hes right, and you’re a witless gullible fool. Did your 15 hours of journalism training omit English comprehension?

      Have you ever heard the phrase radiative cooling? This is the process responsible for the cooling of the Earth over the last four and half billion years or so, all your pseudoscientific denialism notwithstanding.

      CO2 does not accumulate, amplify, or store heat. Learn some physics.

      Cheers.

  57. Eben says:

    Half month from the last temperature data point , half month to go to the next one , so maybe watch the video to shorten the waiting
    https://www.youtube.com/watch?v=aYAy871w9t8

    • David Appell says:

      I go by the data.
      And the trend.

      • Mike Flynn says:

        You just keep spouting meaningless rubbish. Data, trend, bananas . . .

        Who cares?

        Cheers.

        • Eben says:

          David Appell is like a dog who has to leave his pissmark on every post to mark he was there.

          • Mike Flynn says:

            E,

            I believe you are right. The data and the the trend certainly indicate the worthiness of your conclusion.

            Quick! Move away from the post – I sense an imminent leg-lifting nearby! Avoid the spray.

            Cheers.

          • Eben says:

            I asked him several times to stay out of my posts , he has no respect for it , he is like a creep you cannot get rid off , you throw him out the door – he crawls back through the window , you throw him out the window – he crawls back through the chimney …

          • David Appell says:

            Eben, you don’t have the right to ask for that.
            No one does.
            Deal with it.

      • Data can be faulty.

        And trends can end.

        And the future climate is impossible to predict, except by liars.

        • Gordon Robertson says:

          Richard…”Data can be faulty. And trends can end”.

          Trends can also be faulty and/or misleading. The UAH trend from 1979 till present is accurate as numbers go but alarmists try to use it as if the planet has warmed accordingly.

          The truth is that the 0.12C/decade trend quoted by the numbers is misleading. UAH knows that, in the 30 year report they acknowledged little or no warming over the entire range. However, alarmists quote the range as if there has been a linear warming of nearly 0.5C over the range.

          There was no true warming from 1979 – 1997 then the trend became flat from 1998 – 2015. The only true, sustained warming has been due to a major El Nino in early 2016. Since 2016, the trend has been negative.

          • David Appell says:

            Gordon Robertson says:
            The truth is that the 0.12C/decade trend quoted by the numbers is misleading. UAH knows that, in the 30 year report they acknowledged little or no warming over the entire range.

            +0.12 C/decade is the trend over UAH’s total LT v6.0 dataset.

            Over the last 30 years, it’s +0.13 C/dec.

            You’d know that if calculating didn’t terrify you. 🙂

        • David Appell says:

          Richard Greene says:
          And trends can end.

          Sure.
          Let us know when they do.

    • Svante says:

      The rain in Spain falls mainly on the plain.

      • ren says:

        You do not worry about the people in Tornado Alley?

        • JDHuffman says:

          Svante only worries about promoting his false religion.

          Reality means nothing to fanatics.

        • Svante says:

          ren says:
          “You do not worry about the people in Tornado Alley?”

          I do, warmer air holds more humidity which can yield more precipitation, both rain and snow. That’s why we shouldn’t mess around with the climate system.

          • Mike Flynn says:

            S,

            You wrote –

            “I do, warmer air holds more humidity which can yield more precipitation, both rain and snow. That’s why we shouldn’t mess around with the climate system.”

            The people who survive in arid hot tropical deserts would love the humidity which you claim exists due to heat.

            Climate is the average of weather, no more, no less. How do you intend people to stop “messing” with the weather? Are you an actual fool, or just pretending you can change the weather to your liking?

            Are you really nutty enough to believe you can “stop climate change”?

            Get a grip, laddie! According to the IPCC –

            “The climate system is a coupled non-linear chaotic system, and therefore the long-term prediction of future climate states is not possible.” Chaotic – good luck with predicting the result of any “messing about” with such a system.

            Cheers.

  58. Carbon500 says:

    barry: the news media is also the route whereby today’s climate scare is being effectively disseminated – so what’s new?
    You said in an earlier post that ‘almost the entirety of skeptical discussion of the science is based on media articles. Thats why they seem to know so little of the science.’
    Really?
    I take no notice of the media scary stories whatsoever – and when do they ever publish anything else?
    I’ve read for example Peter T. Doran and Maggie Kendall Zimmerman’s 2009 paper from the University of Illinois entitled Examining the Scientific Consensus on Climate Change – the original 97% paper – and within minutes marvelled at how such junk made its way into a scientific publication.
    Then there’s ‘ocean acidification’, a term first coined by Ken Caldeira and Michael E. Wickett in 2003. I corresponded some years ago with a scientist in the USA questioning the linguistic twisting of the word ‘acidification’ – by his definition, a change of pH from say 12.14 to 12.13 would be termed ‘acidification.’ I worked for several years in a laboratory research environment, and consider this definition of ‘acidification’ to be bizarre. It’s misleading to say the least, and certainly not something I’d ever encountered previously. The American would not change his position.
    Let’s not forget Michael Mann’s tree rings. Nowhere in his paper does he list what or how many causes of tree ring variability are known – he’s not a botanist or biochemist, and should have given some evidence that he’d considered all possibilities.
    I don’t consider for a moment that dangerous man-made global warming has any basis in reality. Note my use of the words ‘dangerous’ and ‘man made.’ The climate where I live (the UK) has assuredly not changed in all of my 70 years on the planet – and yes, I’ve got plenty of Met Office figures to back up this assertion.
    Fractional changes of temperature do not define climate.
    Finally, from what I read on websites such as this, I doubt that the contributors get their viewpoints from the media as you suggest.

    • Entropic man says:

      Carbon500

      I also live in the UK. We have the good fortune to live in a country barely affected by global warming.

      IIRC the weather station least affected by global warming is the South Pole. The next is Armagh Observatory, up the road from me in Northern Ireland.

      In the British Isles we have the good fortune to live in a global warming sweet spot. Warming due to extra CO2 is countered by a weakening Gulf Stream. It allows us to say with complete honesty that we are not experiencing global warming.

      The rest of the world is not so lucky.

      • Carbon500 says:

        Entropic man: it’s nice to get the viewpoint of a fellow inhabitant of these islands. I would add to your comment the point that we’re fortunate to have long records of weather-related observations over here. I have on many occasions joked that if someone wants to escape dangerous man-made global warming, they should come to the UK.
        My own thoughts are that the whole concept of global change is flawed. I’d like to see plenty of detailed studies of local weather and climate patterns from around the world in order to answer the question – where exactly has demonstrable climate change occurred,
        and over what period of time?

        • Entropic man says:

          The best place to get a review of the climate science literature is the IPCC AR5 WG1.

          https://www.ipcc.ch/report/ar5/wg1/

          • Mike Flynn says:

            Em,

            Climate is the average of weather. What delusional loony would call the study of an average “science”?

            A pseudoscientific climate cultist variety of loony would. No scientist would.

            Just about as stupid as thinking climatology is a valid academic discipline.

            All part of the rich tapestry of life!

            Cheers.

    • Entropic man says:

      Oh yes, I was a botanist.

      You see tree rings because a tree produces wood with larger diameter xylem vessels in Spring and smaller vessels in the Autumn. The boundary between one ring and the next is visible because of the contrast between autumn and spring wood.

      The effect of climate on tree ring growth varies with the species.

      A longer growing season allows trees such as oak and elm more time to grow, hence wider rings. Since a longer growing season is a function of higher average temperatures, tree ring width increases as average temperature increases.

      Drought tolerant species such as bristlecone pine show a stronger correalation with drought. Narrower rings occur under drought conditions as the plant sacrifices photosynthesis for water conservation.

      • Carbon500 says:

        Entropic man: thank you for your interesting comments. Regarding your observation that ‘since a longer growing season is a function of higher average temperatures, tree ring width increases as average temperature increases’ – a longer growing season doesn’t to me necessarily mean increased temperatures, rather, a longer time available for tree ring growth – but then of course I’m not a botanist!
        That said,I can see your point as regards higher temperatures enhancing tree ring width. Presumably this is due to enhanced enzymatic activity of some kind. With enzymes, there’s certainly an optimum temperature at which their reactivity is maximal, but there’s also a close spread of temperatures either side of the optimum within which they’ll have an effect – certainly with the bacterial and mammalian types I worked with. Again, I’m not a botanist, but I would imagine similar principles apply. I’d be reluctant to infer temperatures to within a fraction of a degree based on tree ring measurements.

        • Entropic man says:

          Think of a tree as a machine for converting sunlight, CO2 and water into carbohydrate. Some of that is then used for for energy, some as building material and some for reproduction.

          It gets complicated, but Within reasonable limits the process is independant of temperature, and is mostly limited by the amount of light available. During the growing season the amount of material produced per day is fairly constant, so a longer growing season gives you more productive days, more material, more growth and thicker rings.

        • Entropic man says:

          Carbon500

          The link between length of growing season and average temperature is because trees cued by temnperature have a mimimum growing temperature. They become active when the daily average temperature increases above a critical value in Spring and shut down when it drops in Autumn.

          An increase in the annual average temperature due to global warming means that the critical temperature occurs earlier in Spring and later in Autumn, hence the longer growing season.

      • Mike Flynn says:

        Em,

        From elsewhere –

        “Life can be pretty tough on a tree! Drought, excessive rain, fire, insect plagues and disease epidemics, injuries, thinning, air pollution, all leave their mark on a tree’s annual growth rings.”

        I assume you agree.

        Given a slice of tree, how would you determine air temperature of the environment over the seasons indicated by ring formation?

        Do you have the faintest idea of how ridiculous dendroclimatology sounds to real scientists? You don’t even accept it yourself, I assume. Even Michael Mann had to resort to “Mike’s Nature trick”, and then blame “divergence” for the necessity. When reality is about to expose you to ridicule, a spot of misrepresentation is in order. Claim that the falsification was necessary due to “divergence” – fact diverged from fantasy!

        Carry on dreaming.

        Cheers.

        • Entropic man says:

          Mike Flynn

          Oversimplifying as usual. You should seek treatment for your delusion that you understand science.

          • Mike Flynn says:

            Em,

            You wrote –

            “It gets complicated, but Within reasonable limits the process is independant of temperature, and is mostly limited by the amount of light available.”

            This does not give a lot of support to the use of treemometers.

            Moving right along, maybe you could quote something with which you disagree, and provide a few facts to back yourself up. You wrote –

            “Oversimplifying as usual. You should seek treatment for your delusion that you understand science.”

            I assume you are appealing to your own authority, in lieu of bothering to actually support your assertions?

            I decline to follow your unsolicited advice. Presumably, you were attempting (poorly) to be gratuitously offensive. I can’t be bothered taking offence from such as you, but feel free to waste your time flogging a dead horse if it gives you solace.

            Cheers.

    • Entropic man says:

      “Acidification”

      Working in a lab we would both have described a change from pH 8.2 to pH 8.1 as a reduction in pH, and undertood that an increase in H+ ion concentration had taken place.

      Out in the real world only a limited proportion of the population understand pH, though most know the concept of acid and alkali. More people would undertand if you told them that the oceans are becoming more acid, than if you told them that the ocean pH has decreased.

      If you dislike “acidification”, perhaps you could suggest one word which could be understood by both ourselves and my mother.

      • Carbon500 says:

        Entropic man: thanks for your comments regarding acidification.
        I agree entirely – a change from pH 8.2 to 8.1 is correctly described as a reduction in pH, due to an increase in H+ concentration.
        I think that the term ‘acidification’ is misleading because it implies that the oceans are being turned into acid. Worse still is the phrase ‘we are making the oceans more acid.’ I agree that only a limited proportion of the population will understand how the pH system works – with the understanding of the concept of a buffer much less so. I don’t intend this to sound snobbish – my own understanding of musical harmony is very limited for example; each to his or her own area of knowledge!
        Perhaps a suitable description for a lay person would be to simply say that some scientists believe that human-generated carbon dioxide may be causing slight changes in ocean alkalinity – but that lacks the drama needed for the mainstream media of course!

        • Entropic man says:

          Carbon500

          Acidification = more acid = less alkaline = lower pH = higher [H+]

          To me they are all the same, but then I’m more interested in the science than scoring propoganda points.

          JDHuffman

          Ever kept a tropical marine aquarium?

          I have. A reef tank is kept between pH 8.0 and 8.4, depending on the species. Even a 0.1 pH decrease noticebly affects the welfare of the occupants.

          You mention buffering. Dissolved CO2 becomes H2CO3 then HCO3- and H+ then CO3- and more H+ . This is why increasing dissolved CO2 decreases pH.

          Lime reacts with CO2 to form calcium carbonate, which is how the geological carbon sink works. Shelled animals and diatoms do something similar with carbonate. Once formed and sedimented out, calcium carbonate plays little further part in the carbon cycle.

          • Stephen P Anderson says:

            You’ve kind of got that ass backwards E-man. The CO2 in the atmosphere is in equilibrium with the CO2 in the water. As the temperature of the planet and water increases it drives the CO2 into the atmosphere and according to LeChattliier’s principle drives the reaction from bicarbonate to carbonic acid and CO2 so that the CO2 in the water remains in equilibrium with the CO2 in the atmosphere. So that the reaction goes in both directions depending on temperature.

          • Entropic man says:

            Stephen Anderson

            As usual, there’s more complexity.

            There are two main factors affecting the equilibrium between CO2 in the atmosphere and CO2 in the ocean.

            The first is Henry’s Law that the concentrations of CO2 in the atmosphere and in solution should show the same partial pressure.

            The second factor is that solubility of gases decreases as temperature increases in proportion to the temperature change in Kelvin.

            Put the two together and you can calculate the expected change in dissolved CO2.

            The 40% increase in partial pressure of atmospheric CO2 should induce a 40% increase in dissolved CO2.

            Surface ocean temperatures have increased by 1K, so dissolved CO2 should decrease by 1/288*100 = 0.35%.

            The net increase since 1880 becomes 40-0.35 = 39.65%.

          • Entropic man says:

            This is the increase in ocean surface dissolved C02.

            https://www3.epa.gov/climatechange//kids/impacts/signs/acidity.html

            Roughly from 330ppm to 370ppm since 1980.

            Over the same period atmospheric CO2 increased from 340ppm to 400ppm.

            https://en.m.wikipedia.org/wiki/Keeling_Curve

            There’s a bit of lag, but the data suggests that the level of dissolved CO2 is following the level of atmospheric CO2 upwards.

          • Stephen P Anderson says:

            I don’t think that’s correct E-man. We already know that most of the increase in atmospheric CO2 is due to natural emission so your one dimensional analysis is probably incorrect-I’m almost sure of it-it has to be driven from the surface to the atmosphere.

          • Stephen P Anderson says:

            I’ll have to go back and look at my physical chemistry book.

          • JDHuffman says:

            E-man says: ” Once formed and sedimented out, calcium carbonate plays little further part in the carbon cycle.”

            E-man, since the subject is buffering, and you don’t want to be accused of changing the subject, let me help you:

            “Once formed and sedimented out, calcium carbonate plays a major role in buffering the oceans.”

            Glad to help.

          • Gordon Robertson says:

            entropic…”This is the increase in ocean surface dissolved C02″.

            The EPA??? Climate alarm central.

          • David Appell says:

            Gordon Robertson says:
            The EPA??? Climate alarm central.

            Not under Trump, dumbo.

            “E.P.A. Plans to Get Thousands of Pollution Deaths Off the Books by Changing Its Math,” NY Times 5/20/19.

            https://www.nytimes.com/2019/05/20/climate/epa-air-pollution-deaths.html

          • barry says:

            How about “de-alkanisation”?

        • Entropic man says:

          Stephen Anderson

          Easily tested.

          The consensusview is that the extra CO2 is coming from fossil fuels. About half stays in the atmosphere while the rest increases biomass and dissolved CO2 in the oceans.

          That predicts increasing dissolved CO2, which I have shown.

          If you are correct, then there should be a flow of CO2 from the ocean to the atmosphere and dissolved CO2 should be decreasing.

          Can you show data to support this reduction, and can you explain how this violation of Henry’s Law is possible?

          • Stephen P Anderson says:

            For one, I’m not sure if your application of Henry’s Law is correct. Again, I’ll have to go back and take a look at it. Also, we’ve already shown that total emission is about 100ppm while only about 4ppm is anthropogenic. If the equilibrium level is a little over 400ppm then we know that anthropogenic can only be about 4% of the equilibrium level or about 16-18ppm. So we know the “concensus” view is wrong and, your analysis is certainly flawed. I have not looked much at the ocean acidity issue-I know there is a supposed NOAA acidity project which I don’t trust. I’ll get back with you at some later date.

          • Entropic man says:

            Stephen Anderson

            May I correct your CO2 numbers.

            The atmospheric CO2 concentration has increased from 280ppm in 1880 to 410 ppm now. That is an increase of 130ppm.

            From the total sales of fossil fuels you can calculate the amount of CO2 released when they burn. That is not the equivalent of 4ppm total, but currently 4ppm each year.

            Nor are we at equilibrium. Atmospheric CO2 concentration continues to increase by 2ppm/year wordwide. The ocean and biomass carbon sinks are also increasing by the equivalent of another 2ppm.

            The numbers match. The amount of extra CO2 accumulating in the system matches our fossil fuel burn.

            The data is consilient across many sources, from economic data to scientific data from many countries, which is why I trust it.

          • gbaikie says:

            –The atmospheric CO2 concentration has increased from 280ppm in 1880 to 410 ppm now. That is an increase of 130ppm.–

            And we need to add 150 ppm to double 280 ppm [560 ppm}.
            The warming from 130 ppm added should be about same or less than warming of 150 ppm to 560 ppm.
            Likewise the first 60 ppm added to 280 ppm should the same warming or more than 70 ppm added most recently.
            and if reach 560 ppm it needs to increase to 1120 ppm to have same warming effect as 280 to 560 ppm, and first 280 ppm increase will cause more warm the latter added 280 ppm to reach 1120 ppm.

            So if added 150 ppm and reach 560 ppm it add about same as we already gotten from “1880 to 410 ppm now”.
            And of course, one can ask how warming of 1880 to Now has CO2 caused? And it will be the same or less when reach 560 ppm.
            And when will we reach 560 ppm. 3 time 50 is 2018 + 50 = 2068 AD.

            In 30 years China will probably run out of coal and have made lots of nuclear power station [and not need coal] and rather than China emitted twice as much as US, it could emit 1/2 as much as US.
            Meanwhile a lot out warmists in Europe and US are opposed to the only know way to reduce CO2 emission- nuclear power.
            But as long as China and India and rest of the world does the right thing in terms of making more nuclear power plants, it will matter much about warmists opposition in US and Europe, in 30 to 40 years we should have lower CO2 emission than we do now.
            And after China shown how wrong the warmists are, probably Europe and US will switch over to using more nuclear power and do something about solar and wind wastelands littering the environment.

          • Gordon Robertson says:

            entropic…”The atmospheric CO2 concentration has increased from 280ppm in 1880 to 410 ppm now. That is an increase of 130ppm”.

            280 ppmv is the pre-Industrial level claimed by the liars at the IPCC. The Industrial Era began circa 1760, right when the Little Ice Age was well under way. Cooler oceans would have absorbed more CO2 and lowered the the concentration of CO2 to 280 ppmv from who knows what.

            The IPCC has never proved that figure. They cherry-picked a number from Antarctic ice core samples that suited their lies.

            According to Jaworowski, errors introduced into the ice core samples by melting water and changes in pressure could have raised the pre-Industrial value to 350 ppmv or more.

          • bdgwx says:

            GR, estimates of the preindustrial CO2 concentration came long before the IPCC was even a thing. Experiments that directly measured CO2 in the air were occurring the 1800’s. For example, you can refer to Brown and Escombe (1905) for one such experiment which is consistent with an estimate of 280 ppm.

          • David Appell says:

            gbalkie wrote:
            “Meanwhile a lot out warmists in Europe and US are opposed to the only know way to reduce CO2 emission- nuclear power.”

            Are you by any chance watching “Chernobyl” on HBO?

          • David Appell says:

            gbaikie says:
            “The warming from 130 ppm added should be about same or less than warming of 150 ppm to 560 ppm.”

            False.

            You’re ignoring feedbacks.

          • Bill Hunter says:

            Craig T says:
            “The ocean is not at saturation for CO2”

            Thats correct. The deep ocean is saturated. However, the upper ocean in the photozone, photosynthesis depletes CO2. Thus the expected result of elevated CO2 for the oceans would be greater productivity for the same reasons it has been observed on land. IMO, we are seeing that effect already.

          • Bill Hunter says:

            David Appell says:
            “gbaikie says:
            The warming from 130 ppm added should be about same or less than warming of 150 ppm to 560 ppm.

            False.

            Youre ignoring feedbacks.”

            You mean the 130ppm had no feedbacks David? LOL!

          • Craig T says:

            “You mean the 130ppm had no feedbacks David? LOL!”

            The biggest known feedback from rising CO2 is the increase in water vapor that goes with warming temperature. Since water vapor is another greenhouse gas the feedback is more warming than CO2 alone. The water vapor feedack from 560 ppm CO2 is much greater than 130 ppm.

          • Bill Hunter says:

            Are the two of you losing your minds?

        • Gordon Robertson says:

          carbon…”I think that the term acidification is misleading…”

          No kidding. Anyone who understands the relationship between solutes and solvents knows the theory of ocean acidification is nonsense.

          • Craig T says:

            “Anyone who understands the relationship between solutes and solvents knows the theory of ocean acidification is nonsense.”

            The ocean is not at saturation for CO2. As the solute increases the percent in solution will increase.

          • David Appell says:

            Gordon Robertson says:
            “Anyone who understands the relationship between solutes and solvents knows the theory of ocean acidification is nonsense.”

            Gordon couldn’t be more of an ignoramus IF HE TRIED.

      • JDHuffman says:

        E-man, as usual, your fascination with pseudoscience has led you astray.

        If you believe the oceans are becoming more acidic, your belief doesn’t hurt anyone. You get to believe whatever you want.

        But, a real scientist would ask “what is the pH of the oceans supposed to be?”

        Without a correct answer to that question, you are just worrying yourself for nothing. And a real scientist might ask “how much calcium carbonate resides on ocean floors to buffer any additional acid?”.

        But, you get to worry yourself for nothing, if that is your goal in life.

        • gbaikie says:

          wattsupwiththat has article on the topic:
          https://wattsupwiththat.com/2019/05/18/co2-and-ocean-chemistry/

          –by Dr. Daniele Mazza

          Oceans cover about 71% of the earth surface, but their influence on climate change is not only due to high heat capacity of water , not only to the ocean’s water circulation, but to a fact which is widely underestimated : the pH (acidity level) of sea-water is substantially alkaline, ranging from 8.0 to 8.7 …–

          I roughly say it’s complicated [and probably has a few unknown factors]. And article goes into a bit.

          • JDHuffman says:

            Good find, gbailkie.

            Dr. Mazza administers one more debilitating punch to the already reeling CO2-phobia.

          • David Appell says:

            gbaikie says:
            “…but to a fact which is widely underestimated : the pH (acidity level) of sea-water is substantially alkaline, ranging from 8.0 to 8.7 …–”

            Every solution has a property called “acidity,” related to the log of its concentration of hydrogen ions.

            When the acidity is decreasing, the solution is properly said to be “acidifying,” viz is pH is decreasing.

  59. Eben says:

    Here is how climate shysters produce their propaganda lies
    https://youtu.be/IatVKZZcPG0

  60. Eben says:

    One of the climate influencers unknown to most Birkeland Currents
    https://www.youtube.com/watch?v=pMPIjT6z8LA

    • Gordon Robertson says:

      eben…”One of the climate influencers unknown to most Birkeland Currents…”

      Interesting stuff. Syun Akasofu wrote a book on the solar wind and he talks about this kind of stuff. He has also criticized the IPCC fro failing to acknowledge the Little Ice Age. He claims rewarming from the LIA can explain our current warming.

      A link from your link. ren might like this if he has not already been there.

      https://earth.nullschool.net/

      • bdgwx says:

        You can you tell me more about this “rewarming”? Where does the energy come from? What physical process causes it to transfer into the atmosphere, hydrosphere, cryosphere, lithosphere, etc? How long will “rewarming” last? What causes “rewarming” to initiate?

        • JDHuffman says:

          bfgwx, can you tell us about your obsession with “AGW”? Where did you get the idea that energy can create itself? How long after UAH global anomaly drops below 0 C will it take for you to admit you’ve been deceived? Is there any connection between you using a fake ID, and your addiction to a hoax?

          • David Appell says:

            Ger*an wrote:
            “Where did you get the idea that energy can create itself?”

            Where did you get the dumb idea anyone claims this is happening?

      • David Appell says:

        Gordon Robertson says:
        “He has also criticized the IPCC fro failing to acknowledge the Little Ice Age.”

        What evidence did this guy give that the LIA was global?

        Because these six dozen or so scientists, who did the most comprehensive study to date, found no such evidence:

        “There were no globally synchronous multi-decadal warm or cold intervals that define a worldwide Medieval Warm Period or Little Ice Age.”

        — “Continental-scale temperature variability during the past two millennia,” PAGES 2k Consortium, Nature Geosciences, April 21, 2013
        http://www.nature.com/ngeo/journal/v6/n5/abs/ngeo1797.html

        • David Appell says:

          Gordon has no answer.

          • Apple, your claim that our planet had a stable average temperature for many thousands of years is complete nonsense, for a planet not in thermodynamic equilibrium — a state of constant change … and you would know that, if you had any science knowledge beyond parroting climate modeler scaremongers.

          • Bill Hunter says:

            David is a serf of the establishment. He is so bought in and probably paid for as an official mouthpiece of Environment, Inc.

  61. ren says:

    The combination of rainfall from the storm system this weekend, the one that follows early next week and others on through the end of May will raise the risk of flooding ranging from urban and small streams, as well as another surge of water on some of the major rivers in the Central states.
    https://www.accuweather.com/en/weather-news/tornado-alley-is-certainly-waking-up-severe-weather-twister-outbreak-to-threaten-lives/70008304

  62. ren says:

    Another stratospheric intrusion will take place over California in three days.
    http://oi67.tinypic.com/2q3p64z.jpg

  63. Mark Wapples says:

    I always understood the biggest factor on tree growth was water availability. The ring structure indicates more the differing rainfall yesr to year. In the uk we had a warm year but due to low rainfall in the summer months we had poor tree growth. Due to the wetter weeks since eastet the growth of trees locally is phenomenal.

    • Entropic man says:

      Mark Wapples

      Always more complexity.

      A tree in drought closes its stomata to reduce water loss, which reduces CO2 uptake. A sustained drought will indeed reduce ring growth.

      Trees in Northern Europe rarely experience sustained drought, so it is secondary to temperature as a determinant of ring width. Note too, that the distribution of temperate tree species tends to follow temperature contours rather than other variables. You can see this directly in mountainous country, when tree cover drops to nothing over 100′ of altitude at the treeline. That represents a temperature change of about 0.3C.

      Remember that before you can use tree rings as a climate proxy you need to calibrate. Measure the variation of tree rings grown in known climate and you can identify the effect of climate on ring width. Once calibrated, you can reverse the process and use ring width to deduce climate.

      • JDHuffman says:

        All such proxies are subject to interpretation. That makes them all subject to bias. Once subject to bias, the perversion and corruption sets in.

      • Mike Flynn says:

        Em,

        Climate is the average of weather, no more, no less.

        Your pseudoscientific obsession that intense analysis of the past can be used to predict the future is certainly not shared by the IPCC, which states categorically that future climate states are not predictable.

        What are you trying to say? Do you really believe that increasing the amount of CO2 between the Sun and a thermometer makes the thermometer hotter? Do you really believe that surface temperatures are dictated by CO2 concentrations in the atmosphere?

        That would be about as silly as believing in the self appointed climate scientist Gavin Schmidt, and his peer reviewed paper “Atmospheric CO2: Principal Control Knob Governing Earths Temperature”.

        Have you managed to find a useful description of the GHE yet? No? When you do, maybe I could learn some science from it, do you think?

        Cheers.

  64. After all these comments, I feel we have not solved the problem of forecasting the future climate, and perhaps we are as confused as we ever were, but the confusion is now at a higher level, than before this thread began.

    Perhaps we should consult the climate scientists of the past:

    https://elonionbloggle.blogspot.com/2019/04/actual-climate-change-pronouncements.html

    • gbaikie says:

      –Richard Greene says:
      May 18, 2019 at 12:36 PM
      After all these comments, I feel we have not solved the problem of forecasting the future climate, and perhaps we are as confused as we ever were, but the confusion is now at a higher level, than before this thread began.–

      Our global climate for last million year has been an Ice Age.
      Recently, in last +10,000, it has been the interglacial period of our Ice Age.
      In last +5000 years it appears we been having global cooling.
      Near present time, we are couple centuries into the recovery from the Little Ice Age.
      Over last several thousands of years we have a few centuries of cooling and warming, and during warming periods sea levels rise and in cooling periods the sea level can fall.
      The Little Ice Age might have coolest period in thousands of years and sea level fell during LIA. I think it’s possible that coolest of LIA could be factor in the +5000 year declining trend or next few centuries it could turn around the the apparent long term trend [+5000 years], though maybe not.
      I appears we don’t have the skill to predict global climate or climate, or long weather forecasts.
      But the tropics will remain warm and near polar regions it will remain cold. And appears we are getting less severe weather, and I expect this will continue.

      • Lewis guignard says:

        gbaikie,

        Unfortunately, or maybe not, we who are alive today will not be around to know the answer. In the meantime, the weather is generally nice, and the garden is doing well. As are the bugs and the weeds.

        Best wishes all.

        • Mike Flynn says:

          Lg,

          I have decided to live forever. I am assuming the trend, based on the past, predicts the future.

          So far, so good.

          Cheers.

          • Gordon Robertson says:

            mike flynn…”I have decided to live forever”.

            I’m with you, Mike, I see no logic in dying. I have forsaken all belief in longevity. Believing you’re going to die at such and such an age is the first step to doing so.

        • profP says:

          Just as the dinosaurs said before they became extinct.

      • David Appell says:

        Again, the data say the LIA wasn’t global:

        “There were no globally synchronous multi-decadal warm or cold intervals that define a worldwide Medieval Warm Period or Little Ice Age.”

        — “Continental-scale temperature variability during the past two millennia,” PAGES 2k Consortium, Nature Geosciences, April 21, 2013
        http://www.nature.com/ngeo/journal/v6/n5/abs/ngeo1797.html

        • Gordon Robertson says:

          DA…”Again, the data say the LIA wasnt global:”

          Alarmist data is contrived to support their idiotic paradigm that trace anthropogenic gases have the capability of warming the atmosphere. Proxy data from real scientists, as opposed to the social scientists who program models, show the LIA occurred globally.

          Anyone with half a brain can figure out that Europe could not remain 1C to 2C below normal for over 400 years while the rest of the planet remained normal.

          Only an alarmist weenie like Appell could miss that.

    • David Appell says:

      Richard Greene says:
      “After all these comments, I feel we have not solved the problem of forecasting the future climate….”

      Any intelligent person understands that it’s impossible to forecast future climate.

      To do so you’d have to know the future human emissions of CO2, CH4, N2O, other GHGs, and aerosols.

      And large volcanic explosions, and changes in solar irradiance.

      Anyone who knows such things, please raise your hand. Or at least give us this information in a comment.

      • Although it is painful for me to admit this, and I will have to wash my fingertips with strong soap after typing this, but this Apple comment makes sense.

        Who typed it for you, Apple ?

        • Svante says:

          Although it is painful for me to admit this, I agree with Richard.

          • I changed my mind.

            If Svante agrees with me, I must have been wrong !

            It is imposible to predict the future climate because we don’t know exactly what causes climate change, we don’t know which known causes are most important, and we don’t know if there is a regular cycle that could be predicted.

            There may be causes of climate change not yet known, perhaps extraterrestrial dust in our atmosphere, which exists, but what effect does it have on our climate?

          • Svante says:

            That’s a relief. So you say it’s something else:
            Richard Muller

  65. Snape says:

    Huffy is a nutter
    Gordon is a nut
    The two live together
    In Flynns little hut

    The hut is built of stone
    On a cold and windy knoll
    Perfect for a nut
    A nutter and a troll

    • Mike Flynn says:

      S,

      And Snape rhymes with ape, grape, jape . . .

      You get the general thrust, I’m sure. I’d challenge you to a limerick fight, but it’s bad form for me to duel with an unarmed opponent

      Cheers.

    • Gordon Robertson says:

      snape…

      There is an alarmist called snape,
      Who has the brain of an ape,
      He can’t seem to think,
      Or write logic in ink,
      And with science his mind is agape.

    • profP says:

      Snape, you summarised my patients perfectly!

      • Mike Flynn says:

        pP,

        Have you managed to fix your gibberish generating psychobabble machine?

        It seems to be performing just as poorly as it did before. Ineffective, like most of the witless devices which pseudoscientific climate cultists fall back on, when faced with a lack of science, logic, and rational thinking.

        Maybe you could try praying harder, or shouting louder, do you think?

        Cheers.

        • profP says:

          Mike, why do you remind me of Basil Fawlty in the Psychiatrist episode?

          “….. It is during the idle conversation that Dr (Mr) Abbott calmly announces that he is a Psychiatrist! Basil retreats to the kitchen, immediately defensive, he is horrified, suddenly in the grip of paranoia — warning Sybil to be on her guard. When Sybil probes him as to why he is suddenly so nervous, he reveals his blinkered dislike of Psychiatrists. “Mad as March hares”, he claims, “to them, everything’s connected with sex!”

          There is no reason to be so defensive – I am here to help you and Gordon

          • Mike Flynn says:

            Your psychobabble generator needs upgrading. The nonsense it spews forth is the same outdated rubbish as before.

            You wrote –

            “Mike, why do you remind me of Basil Fawlty in the Psychiatrist episode?”

            You are probably suffering from an episode of psychological projection –

            “Psychological projection involves projecting undesirable feelings or emotions onto someone else, rather than admitting to or dealing with the unwanted feelings.”

            It is not my fault if you feel threatened by my use of facts. I understand why you experience childish feelings of impotence, which you express in the form of irrelevance and nonsensical psychobabble. Troll away – it won’t make fantasy become fact. You won’t be any less stupid and ignorant, and the GHE will still not exist.

            Cheers.

          • profP says:

            Sorry Mike, you are not the psychiatrist here. You are the patient.
            Your claim to have some knowledge of psychology is the same as your claim to have some knowledge of physics (which is zip).

          • Mike Flynn says:

            Begone, psychobabbling troll!

  66. An Inquirer says:

    Somewhat off topic — but it is snowing in southern Minnesota right now. I would not use my memory as scientific data, but this is the latest that I can remember snow. (I do remember that the record book for northern Minnesota has snow in early June.)

  67. Eben says:

    While you were arguing about moons rotomotions The warmistas catastropfestas lost the whole continent of Australia
    maybe there is hope yet

    https://www.youtube.com/watch?v=nfyIiuvKJrg

    • Gordon Robertson says:

      eben…”The warmistas catastropfestas lost the whole continent of Australia maybe there is hope yet …”

      3 kinds of lies: lies, damned lies, and statistics. M. Twain.

      The percentages they mention are likely based on a sample poll of around 1000. Anyone who is honest about statistics knows that sample size is far too small to be significant with a population of 25 million like in Australia.

      Then there’s the media. Here in Canada, our national media, CBC, is uber-alarmist. Any poll they they commission or cite is bound to be corrupt.

      Best answer re polls. You know what dogs do to poles.

      • profP says:

        “The percentages they mention are likely based on a sample poll of around 1000. Anyone who is honest about statistics knows that sample size is far too small to be significant with a population of 25 million like in Australia.”

        Spoken like a true arm-chair ignoramus.
        You know zip about sampling theory.
        In fact, you know zip about anything based on your childish posts.

        • Mike Flynn says:

          pP,

          You wrote –

          “You know zip about sampling theory.
          In fact, you know zip about anything based on your childish posts.”

          Thus speaks the idiot pseudoscientific climate cultist. Maybe you could add some foul language, a la Bill Nye, or that other professional fraudster, (making a living by pretending to be other people), George Clooney.

          That will no doubt impress other fakers, frauds, and pseudoscientific climate cultists.

          You still can’t create fact from fantasy, can you?

          Oh dear, no useful GHE description to be found – just ever more strident shrieking from the usual pack of fumbling bumbling pretenders. Carry on. Maybe you could try spouting some psychobabble?

          Cheers.

          • profP says:

            It must be debilitating being so paranoid 24/7.
            So, calm down, have a drink of warm milk, put your slippers on, and your dressing gown, sit down, put away your keyboard (or whatever device you use), and read a good book. Maybe one by Charles Dickens? Surely he wouldn’t be trying to deceive you?

          • Mike Flynn says:

            Begone, troll.

        • An Inquirer says:

          You might be right about Gordon’s knowledge on sampling theory; I do not know.

          However, in political polls, there are increasing difficulties in getting samples that reflect the population under question. We want samples that are random, independent and yet reflect the population. In a day when “everybody” had landline telephones, questions on sampling techniques were less profound. There are some polling that is still done by calling up landlines, but they typically undersurvey millennials. Conservatives have subgroups keenly intent on privacy, and they often are undersurveyed. However, in the last U.S. election, left wingers had innovative techniques to get votes from their constituents; so they were undersurveyed. (See Orange County California where vote-gathering techniques included neither going to a polling booth nor using the mail.) I have only begun to scratch the surface.

        • Gordon Robertson says:

          prof pee…”Spoken like a true arm-chair ignoramus.
          You know zip about sampling theory”.

          One of us knows nothing about sampling theory and it’s not me. I studied statistics as part of an engineering program not as part of an Arts Fairy day dreaming class.

          When I showed up for an astronomy lecture early one semester I could not get in the door of the classroom. I forced my way to the prof and asked what was up. He told me to wait, he’d sort it out fast.

          When the bell rang, he got the attention of the throng and explained it was an astronomy class, not an astrology class, and that we’d be studying math, not astrology signs. The Arts Weenies let out a collective groan and left us with plenty of room in the class.

          You are a typical Arts Weenie. Your understanding of statistics and sampling is slim to none.

          • David Appell says:

            Gordon Robertson says:
            I studied statistics as part of an engineering program not as part of an Arts Fairy day dreaming class.

            BFD.

            Gordon thinks all he has to do is mention that he once took a class and that makes him a world expert.

            Just as moronic as Trump, who thinks he’s an expert in everything.

          • Mike Flynn says:

            Begone, useless troll!

          • Gordon Robertson says:

            DA…”Gordon thinks all he has to do is mention that he once took a class and that makes him a world expert”.

            Compared to you I am not only an expert, I am a rocket-scientist.

      • David Appell says:

        Gordon Robertson says:
        “The percentages they mention are likely based on a sample poll of around 1000. Anyone who is honest about statistics knows that sample size is far too small to be significant with a population of 25 million like in Australia.”

        Yet again bells in Gordon’s head go “ding-dong.”

        • Gordon Robertson says:

          DA…”Yet again bells in Gordons head go ding-dong.”

          My statistics prof asked me to explain why I thought polls are useless and when I explained he agreed with me. The sample sizes are far too small for the population represented.

  68. Eben says:

    No this is not a technical problem , you are living on the Bizzaro world where fake media posing as news is trying to create alternative reality.

  69. David Appell says:

    Roy, someone on my blog asked a good question.

    If half of 21st century warming was due to El Ninos, how much warming have El Ninos caused in the prior X,000 years?

    Why isn’t the Earth boiling over due to El Ninos?

    https://davidappell.blogspot.com/2019/05/anomalies-from-giss-are-looking-large.html?showComment=1558095345367#c1811870616812794527

    • gbaikie says:

      “David Appell says:
      May 21, 2019 at 7:33 PM
      Roy, someone on my blog asked a good question.

      If half of 21st century warming was due to El Ninos, how much warming have El Ninos caused in the prior X,000 years?

      Why isn’t the Earth boiling over due to El Ninos?”

      I would say El Ninos release heat which warms atmosphere.
      Ocean releasing heat is ocean getting “cooler” and cooler ocean is global cooling. EL Nimos also mix ocean and warm ocean [actual global warming because ocean increases it average temperature].

      Rule: more ocean mixing is warming the ocean. Warming the ocean is global warming, but isn’t measured in terms of what we call global average temperature of about 15 C.
      And of course less ocean mixing is not warming the ocean and you are getting global warming- though air temperature could be warming.

      Another rule: ocean warms and land cools.

      • David Appell says:

        gbaikie says:
        I would say El Ninos release heat which warms atmosphere.

        Do La Ninas absorb heat which cools the atmosphere?

        • Mike Flynn says:

          Who cares?

        • gbaikie says:

          –David Appell says:
          May 21, 2019 at 8:29 PM
          gbaikie says:
          I would say El Ninos release heat which warms atmosphere.

          Do La Ninas absorb heat which cools the atmosphere?–

          I think in a very rough sense, yes.

          But La Ninas does not cool the atmosphere. The Ocean does not cool atmosphere. And the tropical ocean **in a strong way** does not cool the atmosphere. But La Ninas doesn’t warm the atmosphere as much as El Ninos, and you might call that, cools the atmosphere.

          But I think [or guessing] you creeping up to idea, that La Ninos store heat and El Ninos release heat, and so want to say both La Ninos and La Ninos are causing atmosphere to warm, therefore Spencer’s wrong because he saying El Ninos caused global warming- or increase recent [last couple decades] global temperatures trends.

          It is possible Spencer is wrong but such argument doesn’t provide evidence of this.
          I doubt Dr Spencer would claim El Ninos always cause global warming, rather I think it’s more about El Ninos affecting analysis of a short term temperature trend.

      • gbaikie says:

        –And of course less ocean mixing is not warming the ocean and you are getting global warming- though air temperature could be warming.–

        Should be:
        And of course less ocean mixing is not warming the ocean as much and are not getting as much global warming- though air temperature could be warming.
        {since we measure air temperature and call that global temperature, though the ocean might be cooling, air temperature may not indicate in the short term [years] that there is global cooling.

        Btw since I am here correcting/editing:
        I think a more interesting aspect is I think the entire volume of ocean could warm for thousands of years and not having showing up in terms of higher air temperature. And I think this why one see a rapid warming when exiting a glacial period}

    • Gordon Robertson says:

      DA…”Why isnt the Earth boiling over due to El Ninos?”

      Because ENSO cannot create heat on its own. ENSO is part of an oceanic circulation system of which it is a junior partner. Combined with its major partners like the AMO and PDO, it can re-distribute heat in cycles as the oscillations add to and subtract from each other.

      Tsonis claimed after studying the oscillations that they could explain the 20th century warming. He also wondered why we are wasting time flogging the dead horse of anthropogenic warming when we could learn something by studying the oscillations and their phases.

      • David Appell says:

        Gordon Robertson says:
        Because ENSO cannot create heat on its own.

        Roy thinks it does. (See the title to this post.)

        • Mike Flynn says:

          Begone, stupid troll!

        • Gordon Robertson says:

          DA…”Gordon Robertson says:
          Because ENSO cannot create heat on its own.
          Roy thinks it does. (See the title to this post.)”

          A quote from Roy in his article:

          “The fact is we really dont understand the causes of natural climate change on the time scale of an individual lifetime, although theories abound. For example, there is plenty of evidence that the Little Ice Age was real, and so some of the warming over the last 150 years (especially prior to 1940) was natural but how much?”

          Roy has the class to admit that neither he nor any other scientist understands the causes of natural climate change. The message I get from Roy’s article is that the distribution of heat by EN is cyclic. Roy is too smart, unlike you, to claim heat on Earth comes from any other source than solar energy at least, or internally generated heat from the core.

          There is no way ENSO can create heat. It’s very action is to transfer heat between Australia and the west coast of South America. That heat was largely created by the ocean converting solar energy to heat.

        • bill hunter says:

          David, you are being erroneously narrow minded.

          Are you so indoctrinated into the idea that only greenhouse gases can create heat in the lower troposphere that you fail to note that atmospheric or surface temperature only tell a small part of the story related to how much heat the is contained in the atmosphere and oceans?

          Obviously ENSO does create heat in the atmosphere by removing it from the ocean and putting it in the atmosphere. I have not seen a single earth heat energy budget that does not put evaporation of heat out of the oceans as anything but the number one most powerful force in warming the atmosphere.

          ENSO has a role in varying that rate of heat input. El Nino heats the atmosphere, La Nina also heats the atmosphere but at a slower rate. . . .the result is warming and cooling of the atmosphere as other gains and losses remain the same.
          CO2 does not have an inherent variance on a short term scale. So when you see the climate change on daily, weekly, monthly, seasonally, annually, or every five years you know thats not due to CO2. Questionably its due to CO2 for decadal and multi-decadal lengths of time as ocean processes can be be detected on a monthly, seasonally, annually, every five years, decadal, and multi-decadal scales at a minimum and likely on centennial and millennial scales as well.

          You really can’t make an argument against that because the science is clear, oceans overturn on a millennial scale and massive undescribed processes are at work keeping ocean bottoms a lot colder than they would be if there were not polar inputs of very cold brines to the bottom of the oceans.

          While its rather clear these overturnings are primarily driven by the winds just as they are on lakes when surface waters are superchilled by wind resulting in top heavy surface water and freezing seawater has a byproduct of the heavy brines squeezed out of the freezing water resulting in freshwater ice. Even this process heats the atmosphere as latent heat is released with the freezing of ice and the uptake of heat from the ocean surface due to winds blowing across it accelerating the evaporation process.

          Logically these processes are right now and for last 2 or 3 decades been cooling the ocean bottoms with the retreat of ice. Of course we don’t measure the bottom 1/3rd of the ocean so we have no confirmation of that. In the 20th century we saw the ice come and go a couple of times on a multi-decadal scale. Diffusion of heat in the upper ocean into the lower ocean may well be a multi-decadal process.

          Roy’s paper establishes that much of the warming seen in the 21st century is due to changes in the heat rate of ENSO going from a low heating rate to a high heating rate over the portion of the 21st century we have experienced. That rules out most of the heating observed being a result of increasing CO2 unless other processes likely in other regions of the oceans are favoring cooling of the atmosphere and reducing CO2 warming. If you don’t understand that you don’t belong posting in this forum.

          • Craig T says:

            “Obviously ENSO does create heat in the atmosphere by removing it from the ocean and putting it in the atmosphere.”

            It’s more correct to say ENSO changes how heat is distributed. During El Ninos heat stays in surface waters so more is transferred to the atmosphere. During la Ninas currents carry heated surface water into deeper waters and less of that heat makes it into the atmosphere.

            Atmospheric water vapor goes up during an El Nino so less heat is released into space because water vapor is a greenhouse gas. The link is a graph of longwave radiation given off by the Earth and GISTEMP monthly land and ocean temperature anomolies. You can easily see that during El Ninos the OLR goes down. The Earth is cooling less because of the increase in water vapor.
            https://i.imgur.com/Wwp5mSj.jpg

          • bill hunter says:

            Craig T says:

            “Its more correct to say ENSO changes how heat is distributed. During El Ninos heat stays in surface waters so more is transferred to the atmosphere. During la Ninas currents carry heated surface water into deeper waters and less of that heat makes it into the atmosphere.”

            Its only partially correct to say its just a distribution of heat. It is solar heat truly trapped by the ocean. Its a release of heat from the ocean that occurs as a feedback from prevailing currents that cycle cold water from the high latitudes to the low latitudes.

            The ocean is roughly known to support a convective transport system driven by cold and salty water similar to atmospheric convective currents primarily run by heat warmed at the surface. We don’t know a lot about it because we don’t monitor the ocean bottoms. And remote monitoring difficult there because of communication barriers, the water pressure, and the fact these convective currents run very slowly.

            The release of heat from the oceans during an El Nino event is due to a wind reversal of prevailing winds at the surface along the equator. These winds run east to west and are driven by the Coriolis Effect and the trade winds that blow of eastern shores of all oceans. However the Pacific ocean is far larger than the other oceans so its effects result in changes in global mean temperatures because the currents are so much longer and involve so much more water (e.g. far more surface area).

            The pattern at the equator in the Pacific operates like a heat conveyor belt. As the conveyor belt carries water toward Asia it warms and piles up in the west where sealevel is several inches higher than in the east. An El Nino occurs when the east winds diminish and westerlies become more prominant and the warm water sloshes back across the Pacific combined with a cessation of cold water upwelling near the eastern shore of the Pacific because of the lack of offshore winds. I believe it to be a reversal effect in opposition to the prevailing currents that run clockwise on the oceans in the northern hemisphere and counterclockwise in the southern hemisphere, with the currents converging at the equator and travel together along the equator. Thus an el nino spreads existing heat over a large area of ocean surface and transmits a lot more heat into the atmosphere that was subsurface before the reversal occurs and thus incapable of emitting IR in accordance with its temperature. PDO which is believed to be associated with the frequency of El Nino is like an effect of the same ocean wide current pattern. Prevailing winds push warm water up the Japan coast in the Kuroshio current which is known in the US as the Pacific version of the Gulf Stream. The southern running cold current off north America is called the California current. The PDO is some as yet poorly understood anomaly that occurs in these Coriolis effect driven currents. The PDO itself is not known as a temperature variant like El Nino, but more frequent El Ninos are associated with a positive PDO. The cold area in the northwest pacific is almost certainly associated with a starvation of equator heat from the reversal of the normal wind direction and piling of warm water in the western Pacific. Why the PDO occurs in a multi-decadal manner isn’t known. But associating heat from a positive PDO is a no brainer from the increased incidences of El Ninos associated with it.

      • David Appell says:

        Gordon Robertson says:
        Tsonis claimed after studying the oscillations that they could explain the 20th century warming

        Citation?

  70. David Appell says:

    Stephen P Anderson says:
    Also, weve already shown that total emission is about 100ppm while only about 4ppm is anthropogenic.

    Deniers like you always ignore natural *AB.SORP.TION*, which is greater than natural emissions.

    Why is that, Stephen?

    • Mike Flynn says:

      Begone, troll!

    • Gordon Robertson says:

      DA…”Deniers like you always ignore natural *AB.SORP.TION*, which is greater than natural emissions”.

      What on Earth are you raving about now?

      • David Appell says:

        You understand so little you don’t even understand the relevance of my comment.

        Not surprising.

        • Mike Flynn says:

          Begone, nonsensical troll!

          • Stephen P Anderson says:

            Appleman’s a real dingbat-like most leftists. Their idea of utopia is all that matters. They believe in liberty as long as it supports their idea of equality.

          • David Appell says:

            Stephen, my comments are based on science.

            You need to dismiss all science, so you write witless things like this.

            You never prove anything. You never counter the data and evidence. Why are you even here?

        • myki says:

          DA, yes it not surprising.
          Some people get very upset when their ignorance is exposed for all to see. They behave like spoilt children.

  71. Gordon Robertson says:

    Time we heard something from Patrick Michaels, climate skeptic extraordinaire. It was Michaels who single-handedly stood up to the ranting and raving of James Hansen of NASA GISS who was supported financially by handouts from the US government via his buddy Al Gore.

    With buddies like Gore, who needs enemies?

    Anyway Pat was approached by Western Fuels with an offer to fund his fight against Hansen. Of course, he accepted. Why wouldn’t he? He was not asked to compromise his integrity, Western Fuels gained by his skepticism and needed nothing more than to fund something in which they believed.

    Turned out Pat was right and Hansen was wrong.

    https://www.cato.org/people/patrick-michaels

    • Gordon Robertson says:

      When I claim Michaels fought Hansen single-handedly, I don’t mean to minimize the work of Roy and John at UAH. I mean that Patrick went after Hansen on a mission, trying to neutralize his propaganda.

      • David Appell says:

        “When I claim Michaels fought Hansen single-handedly”

        And Hansen will be seen at one of the climate heroes of the 20th century, while Pat Michaels will be seen as a sell-out denier who published no science to back him up and did nothing of any scientific importance ever.

    • David Appell says:

      If you believe whatever the CATO Institute says you are the fool we all know you to be.

      Just today I saw Pat Michaels laughed at again on Twitter.

    • Craig T says:

      “Anyway Pat was approached by Western Fuels with an offer to fund his fight against Hansen. Of course, he accepted. Why wouldnt he?”

      Michaels and his New Hope Environmental Services has tried to hide funding sources. “public disclosure of a company’s funding of New Hope and its employees has already caused considerable financial loss to New Hope.” In 2007 he backed out of being a witness for GM in a Vermont case to keep his backer list confidential.
      https://www.sourcewatch.org/images/e/e5/GreenMtDoc521-3.pdf

      Western Fuels, coal companies and Edison Electric Institute financed Michaels and the Information Council for the Environment to run a PR campaign in 1991 creating doubt about Global Warming.

      From ICE documents:

      Strategies
      1. Reposition global warming as theory (not fact).
      2. Target print and radio media for maximum effectiveness.
      3: Achieve broad participation across the entire electric utility industry.
      4. Start small, start well, and build on early successes.
      5. Get the test concepts developed and implemented as soon as possible.
      6. “Test market” execution in early 1991.

      One possible target audience includes those who are most receptive to messages describing the motivations and vested interests of people currently making pronouncements on global warming-for example, the statement that some members of the media scare the public about global warming to increase their audience and their influence. People who respond most favorably to such statements are older, less educated males from larger households, who are not typically active information seekers, and are not likely to be “green” consumers.

      https://research.greenpeaceusa.org/?a=view&d=2950

      • Gordon Robertson says:

        craig t…”Michaels and his New Hope Environmental Services has tried to hide funding sources. public disclosure of a companys funding of New Hope and its employees has already caused considerable financial loss to New Hope.”

        Sourcewatch!!!????

        That’s like quoting the National Enquirer. A load of alarmist weenies.

        Tell me something scientific Michaels has said that is wrong.

        You need to be a whole lot smarter to understand science and those detractors who go after a scientist like Michaels because he is hurting them. Michaels has been on a hit list of all the alarmist weenies for a couple of decades now.

        None can disprove what he claims using science so they resort to smear campaigns and ad homs.

        Here’s what Sourcewatch has to say about the corruption at Desmogblog. Nothing!!! Desmogblog were funded by a known felon yet Source watch has nothing to say about that. All they do is quote alarmist propaganda from Desmogblog.

        There is nothing in Sourcewatch about John Cook of skepticalscience being a cartoonist, about him dressing up as a Nazi, or him impersonating physicist Lubos Motl. All SW does is quote alarmist crap from SS.

        Get the picture?

        • Craig T says:

          I don’t trust everything I read on Sourcewatch and consider Greenpeace truly alarmist. Both links are to documents they host.

          The Sourcewatch link is to Michaels’ affidavit explaining why he decided not to testify as a witness for Green Mountain Chrysler. The Greenpeace link is to internal documents showing the creation and goals of the Information Council for the Environment. The group was designed as a public relations project by electric companies. Michaels’ role was as lobbyist not scientist.

          • Russell Cook says:

            Didn’t catch this ’til today. The ‘internal documents’ you refer to are from the place I term “Greenpeace USA ne Ozone Action” (http://gelbspanfiles.com/?p=3227), and were NEVER part of any disinformation campaign anywhere (http://gelbspanfiles.com/?p=7477). Pat Michaels had never heard of the directive to “reposition global warming as a theory”, nor had any other skeptic climate scientists until I told them about it. My GelbspanFiles blog details in depth how that particular set of ‘documents’ and the people surrounding them implode as evidence of an industry executives / skeptic climate scientists pay-for-performance arrangement. To this day, those docs are the ‘core bit of evidence’ to say that skeptic climate scientists are ‘industry-paid liars-for-hire’, including in the latest set of global warming lawsuits. I posit that instead of there being some kind of oil/coal industry conspiracy to spread misinformation, what we actually have instead is a small clique of enviro-activists conspiring to spread misinformation about the credibility of skeptic climate scientists.

          • Craig T says:

            Are you saying the Information Council on the Environment never existed?

            The three scientists who form a “science advisory panel” for the campaign said in telephone interviews that the salient element in two of the ads, that some areas might be getting cooler, did not contradict the theory of global warming. But one of the three, Robert C. Balling Jr., director of the office of Climatology at Arizona State University, said in a telephone interview that the advertising campaign designers felt that an ad that simply discussed the contradictory state of evidence for global warming would not have enough punch.

            Dr. Balling and another member of the panel, Dr. Patrick J. Michaels, Virginia’s climatologist and a professor of environmental sciences at the University of Virginia, have both asked to have their names removed from future mailings. Dr. Balling, who taped radio ads used in Flagstaff, said some people who heard the ads “did not like the idea that I was coming on the radio” and acting as “a mouthpiece” for a private group.”

            The Arizona Public Service Company, which serves Flagstaff, declined an invitation to participate in ICE. Mark De Michele, president and chief executive, did not reply to repeated phone calls seeking comment. But he told The Arizona Daily Sun in May, “The subject matter is far too complex and could be far more severe than the ads make of it for the subject to be dealt with in a slick ad campaign.”

            https://www.nytimes.com/1991/07/08/business/pro-coal-ad-campaign-disputes-warming-idea.html

          • Russell Cook says:

            You’ll help yourself if you carefully read and re-read exactly what I said: “The ‘internal documents’ you refer to…were NEVER part of any disinformation campaign anywhere.” Nowhere in my GelbspanFiles blog / online articles do I dispute the existence of the ICE campaign. Instead, I detail how small and otherwise unseen it was, and how it was NOT what Al Gore, Ross Gelbspan, Naomi Oreskes, and their collective pro-AGW blogosphere followers portray it to be, namely a sinister ( http://gelbspanfiles.com/wp-content/uploads/2013/05/TotN-97-radio-interview.jpg ) conspiracy wherein skeptic scientists were paid to spread misinformation which all parties involved knew to be lies. I further suggest that if the top main promulgators of the accusation about the ICE campaign ‘strategizing to reposition global warming’ knew that was false but proceeded with malice on it anyway, then they may have committed one of the biggest acts of libel/slander in history. Friend, rather than bend yourself into pretzel shapes trying to defend your insinuation about those docs being smoking gun evidence of a skeptic/industry execs conspiracy, why don’t you instead prove to us all that they WERE an accepted industry-wide directive which all skeptic scientists were instructed to follow? Meanwhile, look out for a new blog post at my GelbspanFiles later today on this “Reposition Global Warming as Theory” redux situation which you inadvertently led me into.

        • Svante says:

          He didn’t dress up Gordon, someone else Photoshopped him.

  72. David Appell says:

    Reporting on an important paper:

    “Natural cycles had little to do with 20th-century temperature trends: Humans, volcanoes, and the Sun can cover it; ocean cycles need not apply,”
    SCOTT K. JOHNSON – 5/21/2019, Arstechnia
    https://arstechnica.com/science/2019/05/explaining-the-ups-and-downs-of-20th-century-temperatures/

    • Gordon Robertson says:

      DA…”Natural cycles had little to do with 20th-century temperature trends: Humans, volcanoes, and the Sun can cover it; ocean cycles need not apply,
      SCOTT K. JOHNSON”

      1)Who is Scott Johnson.?

      2)He’s wrong. Tsonis et al said so. They studied ocean oscillation over a century and concluded they control warming/cooling on the planet.

      3)OK…I looked him up…he has a Master of Science in Hydrogeology from the University of Wisconsin-Madison.

      An import paper from a nobody, just like you.

  73. Entropic man says:

    Gordon Robertson

    I agree with you that the accuracy of a statistical analysis depends on sample size n

    You will remember that the accuracy improves in proportion to 1/n2.

    The questions for a poll designer are

    1)how much accuracy do you want?

    2) what sample size do you need to reach that accuracy?

    3) How much sampling effort can you put in?

    A poll sample of 1000 people gives accuracies of +/1% for the alternatives.

    If you want 0.1% accuracy you would need to sample 100,000 people. If you want 0.01% accuracy you would need 10 million people.

    • Stephen P Anderson says:

      E-man,
      I knew you had no real understanding of seawater CO2 chemistry. First you need to spend about the next year studying the link below. Henry’s Law has a very small effect on seawater CO2 concentration and it is mostly a surface effect-but it isn’t even quantifiable as far as I can tell. CO2 is in constant circulation between the oceans and the atmosphere. Temperature, salinity, mixing and other factors affect the solubility of CO2 in seawater. As the temperature has increased the solubility of gases in seawater has decreased and because the ocean is a HUGE reservoir of CO2 due to alkalinity it has driven atmospheric CO2. Also there is no ocean pH. The pH of the oceans varies widely from 7.5 to 8.4 but alkalinity is a huge buffer. God is a great designer.

      https://publishing.cdlib.org/ucpressebooks/view?docId=kt167nb66r&chunk.id=ch06&toc.depth=1&toc.id=ch06&brand=eschol

      • bdgwx says:

        SPA said…”Also there is no ocean pH. The pH of the oceans varies widely from 7.5 to 8.4 but alkalinity is a huge buffer.”

        What? Can you clarify what you mean here?

      • Entropic man says:

        From my earlier post.

        “May 18, 2019 at 10:51 AM
        This is the increase in ocean surface dissolved C02.

        https://www3.epa.gov/climatechange//kids/impacts/signs/acidity.html

        Roughly from 330ppm to 370ppm since 1980.

        Over the same period atmospheric CO2 increased from 340ppm to 400ppm.

        https://en.m.wikipedia.org/wiki/Keeling_Curve

        Theres a bit of lag, but the data suggests that the level of dissolved CO2 is following the level of atmospheric CO2 upwards.”

        If not Henry’s Law, what is your explaination for the increase in ocean surface CO2?

        Note that in scientific debate “God did it” is not sufficient.

        • Stephen P Anderson says:

          E-man,
          Read the textbook. It is your premise that man is emitting CO2 in the atmosphere and that this increased CO2 level because of Henry’s Law is raising ocean surface CO2. That is a premature and false premise. You can make an assumption that because CO2 level in the atmosphere increased then because of Henry’s Law there should be a tendancy for CO2 in the liquid in equilibrium with the atmosphere to increase but as the text states CO2 is not an ideal gas and reacts with the water and other minerals and CO2 is stored in the ocean in several forms (carbonic acid, bicarbonate and carbonate) so those are the far overriding factors. As the temperature of the ocean has increased this has made CO2 less soluble and so the result has been for CO2 to go into the atmposphere, which is in equilibrium with CO2 in the water, in equilibrium with carbonic acid, in equilibrium with bicarbonate, in equilibrium with carbonate. There is a large source of CO2 in the ocean. It is the atmosphere’s source. Also, note God created science so yes it is.

          • Entropic man says:

            Stephen Anderson, CraigT

            I’m with Craig here. Your link is clear that an increase in atmospheric CO2 should lead to an increase in dissolved CO2 which should lead to a reduction in pH. More than just Henry’s law is in play, but the basic pattern remains.

            It is a little odd that you put up a detailed link to support your argument, and then contradict it.

            You have it backwards. Man created God. Prescientific societies created Thor to explain thunder and Demeter to explain crops.

            Now we have scientific explainations gods have become obsolete.

          • Stephen P Anderson says:

            No, the basic pattern is that temperature has caused natural emission to increase-Salby has shown this and that anthropogenic emission is only about 4% of the total and therefore equilibrium CO2 is only about 4% anthropogenic or about 18ppm. And, everything has a cause and the cause is always outside of what caused it. Your view has no logic and it is why you’re a leftist.

          • Craig T says:

            “As the temperature of the ocean has increased this has made CO2 less soluble and so the result has been for CO2 to go into the atmosphere.”

            Both atmospheric and ocean borne CO2 are going up.

          • Mike Flynn says:

            CT,

            You wrote –

            “Both atmospheric and ocean borne CO2 are going up.”

            Compared with the levels to which they had fallen previously, one assumes?

            Do you have a point?

            Cheers.

          • David Appell says:

            Stephen P Anderson says:
            There is a large source of CO2 in the ocean. It is the atmospheres source.

            If the ocean is the net source of atmospheric CO2, why is the ocean acidifying?

            (Did it really not occur to you to ask this question???)

          • David Appell says:

            Stephen P Anderson says:
            Salby has shown this

            What’s the citation to that research?

            I’d like to read it.

          • David Appell says:

            Citation, Stephen? Don’t wimp out now.

      • Craig T says:

        “Henry’s Law has a very small effect on seawater CO2 concentration and it is mostly a surface effect-but it isn’t even quantifiable as far as I can tell.”

        From your link:

        “From the foregoing discussion it can be seen that the total CO2 in sea water does not follow Henry’s law for the solution of gases in inert solutions. Nevertheless, the partial pressure of the carbon dioxide in sea water in contact with the atmosphere will tend to establish equilibrium with that in the air. If the pressure is increased the amount in solution will be greater, and if it is reduced the quantity of CO2 will decrease.”

        Because the carbonate reacts with CO2 to form bicarbonate sea water can hold far more CO2 than it would under Henry’s Law.

        • Stephen P Anderson says:

          Craig T,
          Precisely my point. Henry’s Law probably has some effect but is probably small compared to all those other factors and it isn’t quantifiable. You can’t say that anthropogenic CO2 is causing ocean surface pH to decrease. You can just as easily say that increase in temperature is causing ocean surface pH to decrease-maybe. However, I’m not convinced ocean pH is doing much of anything. It varies a lot depending on local and has a lot of buffering capability.

          • Craig T says:

            “You can just as easily say that increase in temperature is causing ocean surface pH to decrease-maybe.”

            If the ocean lost CO2 because it was warming the ocean’s pH would increase. Here’s a graph of data from Hawaii showing seawater CO2 is going up and ocean pH is going down.
            https://www.pmel.noaa.gov/co2/files/co2_time_series_03-08-2017.jpg

          • Mike Flynn says:

            CT,

            I assume you have a reason for spending your time stating an irrelevant fact – you might as well say that water is wet.

            If CO2 levels are returning to their previous position, are you opposed?

            Cheers.

          • Stephen P Anderson says:

            Craig,
            For one thing I don’t trust anything from NOAA. They manipulate data and research to fit the AGW agenda. It is in their best interest to advance the AGW agenda. But, the ocean is an abundant source of CO2. CO2 is less soluble in the ocean at a higher temperature (which also causes pH to drop) so the ocean is emitting more CO2, but the ocean replenishes it. As the CO2 is less soluble it rises and is emitted (gases off) so I would expect the CO2 measured at the surface to go up because it is in equilibrium with the atmosphere. The amount of CO2 in the ocean is infinite for all intents and purposes but it varies at different depths and temperatures, salinity,etc.etc. The chemical equilibrium reactions are shifting to the left (Le Chattlier’s Princilple). The net CO2 is not coming from the atmosphere it is coming from the ocean and also the land. It is a very complex cycle of gassing off at the warmer climates and redissolving at the cooler regions but the net has been an increasing emission. Salby has shown this.

          • Stephen P Anderson says:

            PS, also all the math supports this.

          • Tim Folkerts says:

            Stephen, here is an interesting comment about Salby. What is your take?

            Salby said:
            “CO2 after the turn of the (21st) century continued to increase, in fact if anything slightly faster, but global temperature didn’t. If anything it decreased in the first decade of the 21st century. Now I’m confident the IPCC (Intergovernmental Panel on Climate Change) will come up with an explanation, in fact they’ve come up with several”

            In response, someone noted:
            “Salby’s entire premise is that CO2 in the air directly dependent upon temperature – increase temperature and you increase CO2. Yet here he argues that CO2 can increase without an accompanying increase in temperature. Which contradicts his ‘model’.”

            It does seem that Salby is inconsistent about whether changing temperature causes changing CO2 or not.

          • David Appell says:

            How many times has Salby been fired now?

            I”ve lost track.

          • David Appell says:

            Stephen P Anderson says:
            For one thing I dont trust anything from NOAA. They manipulate data and research to fit the AGW agenda.

            Prove it.

            You can’t.

            I’m 100% sure of this.

          • David Appell says:

            Stephen?

            Where’s your proof?

      • David Appell says:

        Stephen P Anderson says:
        Also there is no ocean pH.

        You are an f-ing moron, Stephen.

    • myki says:

      EM, don’t expect a sensible response from Gordon.
      The topic is well and truly beyond him.
      Nevertheless, he may try to make a contribution. Something for us to laugh at again.

      • Mike Flynn says:

        Begone, troll!

      • Gordon Robertson says:

        myki…”EM, dont expect a sensible response from Gordon.”

        Oh…Mikey’s back. Mikey would not understand anything sensible anyway so any comment from ‘it’ is clearly a moot point.

        Yet another alarmist troll.

        • Entropic man says:

          Gordon Robertson

          Myki is right, though.

          You have not yet provided a statistical answer to my comment on the statistical relationship between accuracy and sample size in polls.

          • Mike Flynn says:

            Who cares?

          • Gordon Robertson says:

            entropic…”You have not yet provided a statistical answer to my comment on the statistical relationship between accuracy and sample size in polls”.

            Was not ignoring you, I have been busy.

            I have heard the justifications from polling companies as to why they can use a 1000 sample poll to justify claiming it can be extrapolated onto a population of 25,000,000 with a confidence level in the 90th percentile. I think they are full of crap.

            My statistics prof was one of the brightest young profs I have ever encountered. He could write complex statistics theory on the blackboard as fast as he talked.

            I button-holed him after class and asked him if opinion polls were accurate. He replied, “Oh, no you don’t, you tell me first if they are accurate and why”.

            So I told him I thought the sample size was way too small. He interrogated me as to what size it should be and when I told him, he told me I was absolutely correct.

            The ratio of the size I referenced, 1000 data points, to the population of Canada, then about 30 million, could in no way be derived from 1000 data points with an error margin within the parameters you suggested.

            To put it bluntly, it cannot be done with any accuracy at all. Pollsters are bs-artists of the highest order.

  74. Entropic man says:

    Stephen Anderson

    “anthropogenic emission is only about 4% of the total and therefore equilibrium CO2 is only about 4% anthropogenic or about 18ppm.”

    Onc again in small and simple words.

    There is a carbon CYCLE. Carbon moves between ocean, atmosphere and biomass, but the amount of natural carbon in circulation remains approximately constant. Carbon released by fossil fuel burning is a small percentage of the carbon in circulation, but it is additive. It increases the amount of carbon in all areas, ocean, atmosphere and biomass.

    Your view has no logic and it is why youre a leftist.

    “Some men think the Earth is round, others think it flat; it is a matter capable of question. But if it is flat, will the King’s command make it round? And if it is round, will the King’s command flatten it?”

    Robert Bolt, “A Man For All Seasons”

    We are discussing physics and chemistry, objective facts independant of politics. A thermometer gives the same reading for a leftist or a rightist.

    • JDHuffman says:

      E-man says: “A thermometer gives the same reading for a leftist or a rightist.”

      But, it is the fanatic that changes the “reading” to match the agenda.