Archive for June, 2015

Can Infrared Radiation Warm a Water Body? Part II

Tuesday, June 30th, 2015

(This is a follow-up to my post from a little over a year ago, but with some exprimental results).

I sometimes see the claim (usually in comments on a blog post) that infrared radiation cannot warm a water body, because IR only affects the skin surface of the water, and any extra heating would be lost through evaporation.

I have tried to point out that evaporation, too, only occurs at the skin of a water surface, yet it is a major source of heat loss for water bodies. It may be that sunlight is more efficient, Joule for Joule, than infrared due to the depth of penetration effect (many meters rather than microns). But I would say it pretty clear that any heat source (or heat sink) like evaporation which only affects the skin is going to affect the entire water body as well, especially one that is continually being mixed by the wind.

Partially water-filled Styrofoam cooler with a temperature sensor in the bottom.

Partially water-filled Styrofoam cooler with a temperature sensor in the bottom.

Last night I tried a little experiment with my Extech SD200 digital temperature recorder and two Styrofoam coolers (doubled up) partially filled to the same depth with salty swimming pool water, with the temperature sensors placed in the bottom, as seen in the first photo.

As seen in the second photo, over one of the coolers I put a piece of aluminum flashing painted white with high IR emissivity paint to block IR emission from the “coldest” part of the sky (directly overhead), but small enough to not restrict air flow around it as evaporation (and sensible heat transfer while the water was warmer than the air) cooled the water in both containers:

Two partially water-filled styrofoam coolers, with one partially shielded with aluminum flashing painted with high-emissivity white paint.

Two partially water-filled styrofoam coolers, with one partially shielded with aluminum flashing painted with high-emissivity white paint.

My FLIR i7 IR imager said that the sky “effective temperature” directly overhead was about 7 deg F, and the temperature of the aluminum sheet (viewed from below) was close to 80 deg. F, indicating that the presence of the sheet should reduce the radiative energy loss from the water, thus keeping the water warmer than if the sheet was not there (which is what the greenhouse effect does to the Earth’s surface).

Of course, these IR imagers do not provide a good estimate of the broadband IR effective emitting temperature of the sky because they are tuned to the 7.5 to 14 micron wavelength range, which avoids some of the greenhouse gas emission/absorption from the sky. So the true broadband-IR emission from the sky would be at a higher effective temperature.

For example, the most recent ground-based radiometer data from Goodwin Creek, MS the day before my experiment (June 28) showed early nighttime downwelling IR fluxes of about 360 W/m2, which corresponds to an effective emitting temperature of about 48 deg. F, considerably warmer than the 7 deg. F atmospheric window measurement I made with my imager.
Also, my backyard has numerous trees (and my house) blocking the lower sky elevations, with only about 30-40% of the sky visible above.

Nevertheless, the metal sheet in the above photo will still block a portion of the colder sky from view by the warmer water, and it should cause the water in the cooler on the right to be a little warmer than the unshielded water on the left.

So, let’s see what happened to the temperatures:

Overnight temperature data (taken every 5 mins) for water in the coolers, and air temperature between the coolers.  A 1-hour trailing average is also shown in the second graph.

Overnight temperature data (taken every 5 mins) for water in the coolers, and air temperature between the coolers. A 1-hour trailing average is also shown in the second graph.

As can be seen in the 5 minute temperature data overnight, the cooler with the IR shield stayed a little warmer. The relative faster cooling of the unshielded cooler was slowed when high-level clouds moved in around 1:30 a.m. (as deduced from GOES satellite imagery).

I used this simple energy balance model to deduce that the shielded cooler had about 6 W/m2 less cooling than the unshielded one, to account for the relative weaker temperature drop of 0.4 deg F over about 8 hours.

I’d like to try this again when the air mass is not so humid (surface dewpoints were in the mid to upper 60s F). Also, putting Saran wrap over the water surfaces would eliminate the primary source of heat loss – evaporation.

Note that the temperature effect is small in such an experiment because the atmosphere is already mostly opaque in the infrared, so adding a shield whose emitting temperature is a little higher than what the sky is already producing won’t cause as dramatic of an effect. But under the right conditions (warm water covered with Saran wrap, a very dry atmosphere, and unobstructed view of the sky) much larger differential impacts on water temperature should be possible.

Smoke Pouring into U.S from Canadian Wildfires

Monday, June 29th, 2015

Portions of up to ten plains states are covered by smoke this morning from hundreds of wildfires now raging in western Canada.

Unusually dry weather combined with thousands of dry lightning strikes has caused most of the fires, with some evacuations being reported. The firefighting conditions are reported to be particularly dangerous, with shifting winds and dry timber.

Yesterday’s color satellite imagery from NASA’s MODIS imager shows the pale blue smoke, with some darker brown smoke colors nearer the fire sources in Alberta and Saskatchewan:

Smoke from Canadian wildfires entering the U.S. on 28 June 2015 (NASA MODIS image remapped into Google Earth).

Smoke from Canadian wildfires entering the U.S. on 28 June 2015 (NASA MODIS image remapped into Google Earth).

A close-up view by MODIS reveals just how dirty the smoke is from a couple of the bigger fires in central Saskatchewan (red dots are satellite infrared-diagnosed hotspots):

MODIS close-up view of fires in Canada, June 28, 2015.

MODIS close-up view of fires in Canada, June 28, 2015.

GOES imagery from this morning shows the smoke now extending into Oklahoma, and the area impacted will expand and drift over the eastern U.S. in the coming days.

Alaska On Fire: Satellite Views 260+ Wildfires

Wednesday, June 24th, 2015

An unusually warm and dry spring has led to widespread wildfire activity in Alaska, with over 260 wildfires now reported and evacuations (some by boat) in progress. Fire crews are currently working only about 15% (three dozen) of those fires.

The NASA MODIS satellite imagery from yesterday shows the infrared satellite-indicated locations of fires, with pale blue smoke covering nearly half the state (click image for full size):

NASA MODIS satellite imagery of Alaska from 23 June 2015 showing infrared-sensed fire hotspots (red) dots from 260+ wildfires.

NASA MODIS satellite imagery of Alaska from 23 June 2015 showing infrared-sensed fire hotspots (red) dots from 260+ wildfires.

The warm dry weather is due to atmospheric high pressure anchored over the state, likely influenced by the strengthening El Nino and the persistent “warm blob” of water in the eastern North Pacific.

Auroras Seen as Far South as Georgia and Arkansas

Tuesday, June 23rd, 2015

The severe geomagnetic storm late yesterday produced rare auroras seen as far south as Georgia and Arkansas last night.

This photo was taken by Tyler Penland, an astronomer and weather observer in N. Georgia:

Rare aurora over N. Georgia on 23 June 2015 (Tyler Penland).

Rare aurora over N. Georgia on 23 June 2015 (Tyler Penland).

The display was more spectacular farther north, of course. Here’s a photo from Billings, MT:

Aurora in Billings, MT, 23 June 2015 (Ben Chorn).

Aurora in Billings, MT, 23 June 2015 (Ben Chorn).

And in Denoir Valley, WY, the colors were amazing, with no FM radio station reception during the peak in the display around midnight:

Denoir Valley, WY aurora on 23 June 2015 (Mike Kenny)

Denoir Valley, WY aurora on 23 June 2015 (Mike Kenny)

In Marquette, MI, Shawn Malone (LakeSuperiorPhoto.com) captured this view looking right up through the ribbons of light:

Marquette, MI view of the 23 June 2015 aurora display (Shawn Malone, LakeSuperiorPhoto.com).

Marquette, MI view of the 23 June 2015 aurora display (Shawn Malone).

The same solar storm brought rare auroras to Australia as well:

Aurora Australis captured in Victoria, Australia on 22 June 2015 (Caitlin Gordon).

Aurora Australis captured in Victoria, Australia on 22 June 2015 (Caitlin Gordon).

More aurora photos from the current event can be seen at the SpaceWeather.com realtime image gallery.

2015 Will Be Record Warm in Surface Temperatures…But Still Below Model Forecasts

Monday, June 22nd, 2015

With 5/12 (41.7%) of the votes counted, John Christy and I are now prepared to call 2015 as the winner of the Warmest Year in the Thermometer Record election. The latest exit polling of El Nino forecasts suggests an unusually hot turnout from the East Pacific region this year, which is why we are calling the election early.

Of course, our UAH satellite data analysis (as well as the RSS analysis) for the lower troposphere continue to show nothing spectacular, although the current forecast for a strong El Nino this year will make 2015 one of the warmest years since 1979.

But today’s post will just deal with the latest global warming pause-busting dataset out of NCDC (now NCEI), which purports to remove evidence for a global warming “hiatus” seen in other datasets. Since the KNMI Climate Explorer website has only the ERSST (ocean) data available for new Karlized version 4 dataset, and since the oceans pretty much drive annual averages anyway, we will stick to the oceans between 60N and 60S latitudes.

The following plot shows anomalies from the 1981-2010 (30-year) monthly averages, but repositioned vertically on the graph as departures from the 1979-1983 period mean. In the first plot I have removed the average effect of El Nino and La Nina events, which ends up being 0.069 C per MEI index value one month before the temperature measurement (based upon detrended data). The second plot shows the original data.

CMIP5-global-oceans-vs-ERSST-v4

As can be seen, even with the El Nino effect removed (first plot, above) it appears that 2015 is likely to be a record warm year anyway, at least in this official dataset. But even with the highly controversial Karlization procedure applied to the data, the observed warming trend is still only about 60% of the average warming trend in the CMIP5 climate models for the global oceans (+0.18 C/decade for the models, +0.11 C/decade for the observations). This is true whether you compute trends for the entire period, or only since 1996, which is where the two temperature time series diverge more noticeably.

Which brings up a point I have mentioned before: We could have a record warm year, every year, but what really matters is just how much that warming is.

If there was no natural variability, and we had perfect measurements, each successive year could be 0.01 C warmer than the prior year and thus be a new, record warm year…but would we really care?

It’s the long-term difference between (1) the climate models used to promote energy policy changes and (2) the observations, which should drive the global warming debate, not qualitative “record warmest year” statements.

And on that score, even using Tom Karl’s new pause-busting surface temperature dataset, the models continue to come up short.

So, as we approach the United Nations COP-21 (21st Conclave Of the Party-goers) in Paris this December, we’d all better get used to the inevitable “warmest year on record” rhetoric.

Even the Pope is on board this time.

Stossel’s “Science Wars”, Tomorrow 8 p.m. EDT on Fox Business

Thursday, June 18th, 2015

WMON_STOSSEL_science_wars2

I’ll be on tommorow’s Stossel Show (Fox Business Channel, 8 p.m. EDT Friday), where John gets my reactions to global warming climate change Climate Crisis™ statements made by Al Gore, Bill Nye, and Neil DeGrasse Tyson.

It will be interesing to see if I get bleeped. 😉

NASA Satellite Reveals Guadalupe Island Glory

Wednesday, June 17th, 2015

Anyone who has traveled on airplanes a lot has probably seen the glory (or halo) phenomenon when looking at the shadow of the airplane on the cloud deck below. A rainbow-colored circle can sometimes been seen.

But the same kind of phenomenon can sometimes be seen in color satellite imagery….but it requires the right conditions. The following image was taken yesterday, south of California (click image for full size).

Optical glory phenomenon seen by the NASA MODIS imager on 16 June 2015.

Optical glory phenomenon seen by the NASA MODIS imager on 16 June 2015.

When the sun reaches it’s northernmost extent in late June, it is almost directly over the marine stratocumulus cloud deck that often exists southwest of California. As the NASA color imagers on the Aqua and Terra satellites pass over, they are looking straight down. In the imaginary “satellite shadow” region below, under the right conditions, the glory phenomenon can be seen, but only a few time each year.

Due to the latitude of Mexico’s Guadalupe Island, and the persistent marine stratocumulus layer there, I’ve found this to be the best place to see the event. The reason the glory is elongated is that the satellite imager doesn’t actually take a 2-D photo, but scans directly under the satellite path below, basically building up an image with a bunch of narrow scans. Repeated image slices through the circular glory builds up an elongated glory.

Pretty cool.

TRMM Satellite Reentering the Atmosphere Tonight

Monday, June 15th, 2015
Japan's Hayabusa satellite renters the atmosphere in June, 2011.

Japan’s Hayabusa satellite renters the atmosphere in June, 2011.

NASA’s very successful Tropical Rain Measuring Mission (TRMM) satellite will mostly burn up upon reentry tonight. The latest estimated time of re-entry from Space-Track.org right now is 4 a.m. GMT, give or take 1.5 hours.

To show you just how uncertain these predictions are, that time was moved up by 35 minutes from a prediction just 12 hours before, which is almost half a world away in terms of distance. In other words, it just about impossible to know where the satellite will reenter, except that it will be between about 35 N and 35 S latitudes.

Orbital predictions are very accurate when all you have to account for is gravity; once atmospheric drag comes into play, it’s a whole different ball game.

This news article from a couple days ago quotes NASA as saying that about 12 spacecraft components could survive re-entry and hit the surface. They also say the chance that one of these could hit someone somewhere is 1 in 4,200. I’m a little surprised it’s that high. But then there are a couple billion potential targets. 😉

If I thought there was a decent chance it will reenter over the southeast U.S., I’d set my camera up for extended time lapse session tonight. But I’m pretty sure that would be a waste of time.

What Causes the Greenhouse Effect?

Saturday, June 13th, 2015

I’ve had a request to (once again) go through an explanation of the (poorly-named) Greenhouse Effect (GHE). Hopefully there is something which follows that will help you understand this complex subject.

The greenhouse effect usually refers to a net increase in the Earth’s surface temperature due to the fact that the atmosphere both absorbs and emits infrared radiation. (Our miniscule enhancement of the natural greenhouse effect with carbon dioxide emissions, and its possible role in global warming, is a separate issue).

This GHE temperature increase is frequently quoted as being around 60 deg. F, thus keeping the Earth from being an ice planet, since its average surface temperature is somewhere around 59 or 60 deg. F.

This 60 deg. F warming attributable to the GHE is actually incorrect; the greenhouse effect on surface temperature, if left to its own devices, would actually be at least twice that strong…more like 140 deg F average surface temperature…but most of that theoretical surface temperature rise is short-circuited by convective heat loss from the surface caused by convective air currents, in turn caused by the greenhouse effect, which also largely creates the weather we experience.

That’s right – without the greenhouse effect, we would not have weather as we know it. The greenhouse effect, energized by solar heating, creates weather.

The GHE is somewhat controversial among some skeptics, probably because we can’t “see it” the way we can see visible sunlight and the resulting heating of surfaces sunlight falls upon – a rather non-controversial cause-and-effect process. It instead involves infrared (IR) light, which we cannot see, but which is an essential part of the energy flows in our climate system…and in most other systems that generate heat. You can actually feel if it is sufficiently strong (e.g. radiant heat from a stove or fire).

I must preface the following discussion with this: The temperature of any object represents a balance between energy gained and energy lost by that object. Temperature is an energy balance issue. Unless phase changes are involved (e.g. melting ice), if more energy is gained than lost, temperature goes up. If more energy is lost than gained, temperature goes down. Understanding this is fundamental to understanding weather and climate, as well as the following discussion.

The atmosphere contains “greenhouse gases” (GHGs), which means gases which are particularly strong absorbers and emitters of IR radiation. In the Earth’s atmosphere, the main GHGs are water vapor and carbon dioxide. Absorption and emission of IR go together because anything that is a good absorber of IR is also a good emitter, although in general the rates of absorption and emission are not the same since absorption is mostly temperature-independent but emission is very temperature-dependent.

In the classical Kiehl-Trenberth global energy budget diagram, the energy flows I have marked with an “X” would not exist without GHGs:

greenhouse-gas-and-KT-diagram

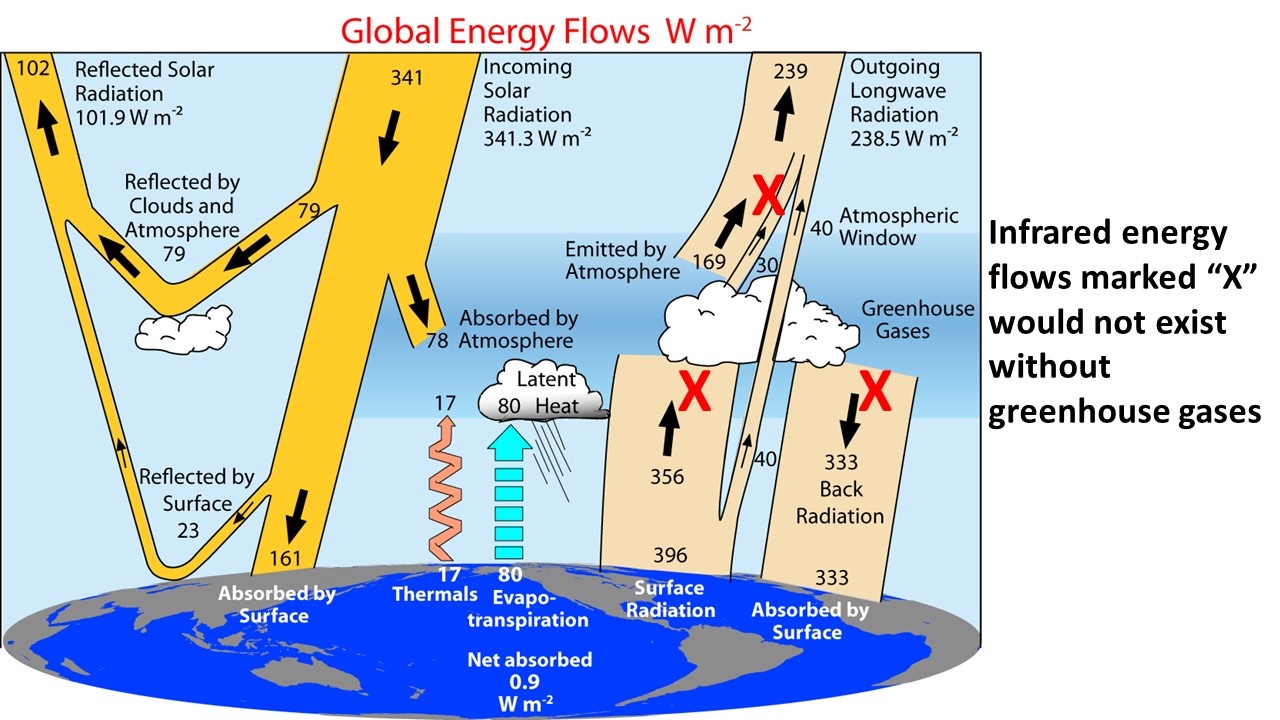
Now, recall I said that temperature is a function of rates of energy gain and energy loss. Thus, those energy flow arrows marked with an “X” in the above diagram represent huge flows of energy which can affect temperature, if they really exist.

So, let’s now think through what happens as sunlight enters the climate system. As the Earth’s surface absorbs sunlight it warms up. As it warms up, it emits more and more IR energy, limiting its temperature rise (remember “energy balance”?).

If the atmosphere could not intercept (absorb) any of that surface-emitted IR energy, the energy would readily escape to outer space and as a result it has been estimated that the Earth’s average surface temperature would be only about 0 deg. F. But we really don’t know exactly because there would be a lot more ice, which would reflect more sunlight, which would make temperatures even colder. Also, we have no idea why kinds of clouds would exist under those conditions. Suffice it to say the Earth would probably be too cold for most life as we know it to survive.

But the atmosphere DOES absorb IR energy. The IR absorption coefficients at various wavelengths, temperature, and pressures have been measured for water vapor, CO2, etc., in laboratories and published for decades.

This absorption means the atmosphere also EMITS IR energy, both upward and downward. And it is that DOWNWARD flow of IR energy (sometimes called “back radiation”) which is necessary for net warming of the surface from the greenhouse effect.

(Technical diversion: This is where the Sky Dragon Slayers get tripped up. They claim the colder atmosphere cannot emit IR downward toward a warmer surface below, when in fact all the 2nd Law of Thermodynamics would require is that the NET flow of energy in all forms be from higher temperature to lower temperature. This is still true in my discussion.)

Now, some will claim the atmosphere’s decreasing temperature with height is also necessary for the greenhouse effect to occur. While this is true, the decrease in temperature with height in the troposphere is ultimately caused by the greenhouse effect itself.

You see, as long as an atmosphere (it doesn’t matter from which planet) has greenhouse gases, the temperature will decrease with height. Without convection, the temperature would decrease drastically with height…the so called “pure radiative equilibrium” case, first demonstrated by Manabe and Strickler (1964). The net effect of GHGs is to strongly warm the surface lower atmosphere temperature, and strongly cool the upper atmosphere temperature, compared to if those gases did not exist. The GHE makes the atmosphere so unstable that convection – weather – results, which restores the atmospheric temperature lapse rate to somewhere between dry adiabatic and moist adiabatic.

Remember, without greenhouse gases, the upper atmosphere could not lose the energy it accumulates from all sources, and would stay warm, and the atmosphere would not destabilize and cause convective overturning (weather).

This net result is not intuitively obvious. I sometimes use the (admittedly imperfect) analogy of insulation in a house in winter (even though heat conduction is a different physical process from radiation). Given the same rate of energy input into the home by its heating system, addition of insulation slows the net rate of heat flow from the warmer interior to the cold exterior, causing higher temperatures inside and lower temperatures outside, compared to if the insulation did not exist.

Again, temperature is the result of energy gain AND energy loss. If you reduce the rate of energy loss, temperature will rise…even if the energy input is the same. Extremely high temperatures can even be created with very little energy input…even from a tiny battery…if you can reduce the rate of energy loss to near zero. You cannot say anything about temperature based upon the rate of energy input alone, any more than you can say what the average level of a lake will be based upon the rate of water input alone. It just ain’t physically possible.

Analogous to insulation in a heated home, greenhouse gases reduce the net rate of infrared energy transfer from the surface and lower atmosphere to outer space, causing the surface and lower atmosphere to be warmer, and the upper atmosphere to be colder, than if greenhouse gases did not exist.

Since the effect is not entirely intuitive, years ago we programmed up the equations ourselves in a 1-D radiative-convective model for me to be convinced this is what actually happens. When the model is initialized with global average sunlight and atmospheric greenhouse gas concentrations, from any initial temperature profile you want (even absolute zero), it eventually equilibrates to the observed average vertical temperature structure of the atmosphere.

And I suppose it is the non-intuitive nature of the process (I required a model demonstration to finally believe it) that breeds so much controversy and alternative ideas. I get that.

Now, I know that this post will cause a few people (you know who you are) to object with hand-waving arguments involving technical jargon that what really happens is something different. But until they put their ideas in the form of physical equations based upon known (and laboratory-measured) processes, which conserve energy, in a time-dependent model that also produces the observed average temperature profile of the atmosphere, I will not believe them.

What those people need to do is go read a book on atmospheric radiation, say Grant Petty’s A First Course In Atmospheric Radiation. I know Grant, and he is a brilliant and careful scientist. If you disagree with him (and the many other experts who agree with him), you’d better have some pretty good evidence to back your case up.

The bottom line, then, is the Greenhouse Effect, due mostly to greenhouse gases, is largely caused by the fact that the atmosphere emits IR energy downward, the so-called “back radiation”. This single component of the whole GHE process basically then determines all of the other features of the greenhouse effect and leads to net GHE warming of the Earth’s surface.

You can measure the greenhouse effect yourself with a handheld IR thermometer pointed at the sky, which measures the temperature change caused by a change in downwelling IR radiation. In a clear sky, the indicated temperature pointing straight up (“seeing” higher altitudes) will be colder than if pointed at an angle (measuring lower altitudes). This is direct evidence of the greenhouse effect…changes in downwelling IR change the temperature of a surface (the microbolometer in the handheld IR thermometer). That is the greenhouse effect.

If I’ve make a mistake in the above, I’ll fix it. I realize some might not like the way I’ve phrased certain things. But I’ve been working in this field over 20 years, and the above is the best I can do in 1-2 hours time. From some of the objections you will see in the comments, you will find it is a complex subject, indeed.

Greenpeace? Or Greendeceit?

Friday, June 12th, 2015

I just about made it out of Heartland’s 10th International Conference on Climate Change, now winding down near Capitol Hill, without having to deal with one of the 25 media outlets registered there known to be antagonistic to the view that global warming is neither all human-caused nor dangerous.

Then, a sharply dressed, very young man introduced himself (from Greenpeace) and asked if we could talk. Hmmm…

Oh, OK, I know we won’t agree, but maybe he wants to report on what was happening at the conference. I try to give everyone the benefit of the doubt. (Except the BBC…they burned that bridge twice).

The conversation began innocently enough, but then after 10 minutes of smiling accusations and baseless assertions, I was getting a little annoyed.

He even asked me if I considered him a “global warming Nazi“. I said, no, and explained the history of my use of that label (which I still stand by).

I said it’s obvious we are at opposite ends of the spectrum and tried to extricate myself from the conversation.

Then one of the conference staff and a security guard approached and said, basically, do you know this young man has a mic on him, and the young lady sitting across the way has a video camera recording your conversation?

Well, no I didn’t! How utterly delightful…and professional!

I said, well, my opinion of Greenpeace just went down a notch.

Did I ever have a positive view of Greenpeace, they asked me?

Well, yes, I’d say I once did.

And I said Patrick Moore (one of the Greenpeace co-founders) once did, too.

They both groaned. 🙂

It’s too bad that Greenpeace now has to resort to deception to achieve their goals.

At the next conference I think I am going to agree to an interview with anyone…and make my own recording. If what Greenpeace did was illegal (I have no idea if you can record someone in DC without their knowledge), then I will let the interviewer know I will record them if they are recording me.

Then, if they cut and paste together pieces to make me look bad, I’ll have evidence of what really transpired.