UAH V6.0 Global Temperature Update for May 2015: +0.27 deg. C

June 8th, 2015 by Roy W. Spencer, Ph. D.

NOTE: This is the second monthly update with our new Version 6.0 dataset. Differences versus the old Version 5.6 dataset are discussed here.

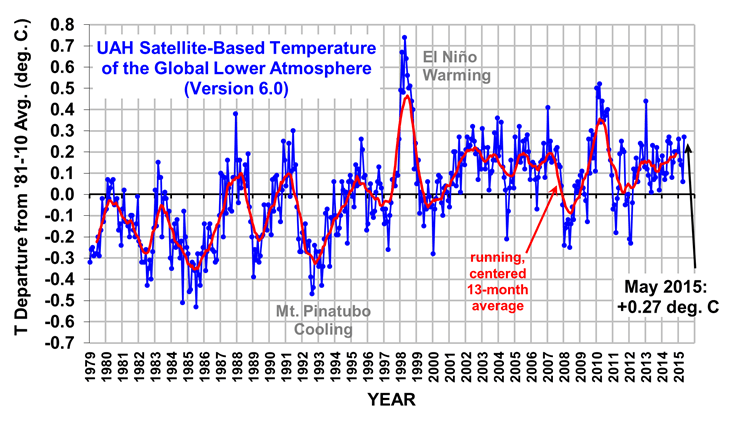
The Version 6.0 global average lower tropospheric temperature (LT) anomaly for May, 2015 is +0.27 deg. C, up considerably from the April, 2015 value of +0.06 deg. C (click for full size version):
UAH_LT_1979_thru_May_2015_v6

The global, hemispheric, and tropical LT anomalies from the 30-year (1981-2010) average for the last 5 months are:

YR MO GLOBE NH SH TROPICS
2015 1 +0.26 +0.38 +0.14 +0.12
2015 2 +0.16 +0.26 +0.05 -0.07
2015 3 +0.14 +0.23 +0.05 +0.02
2015 4 +0.06 +0.15 -0.02 +0.07
2015 5 +0.27 +0.33 +0.21 +0.27

I suspect that the May warming is due to El Nino-related warmth in the Pacific.

The global image for May, 2015 should be available in the next several days here.

The new Version 6 files, which should be updated soon, are located here:

Lower Troposphere: http://vortex.nsstc.uah.edu/data/msu/v6.0beta/tlt
Mid-Troposphere: http://vortex.nsstc.uah.edu/data/msu/v6.0beta/tmt
Tropopause: http://vortex.nsstc.uah.edu/data/msu/v6.0beta/ttp
Lower Stratosphere: http://vortex.nsstc.uah.edu/data/msu/v6.0beta/tls


101 Responses to “UAH V6.0 Global Temperature Update for May 2015: +0.27 deg. C”

Toggle Trackbacks

  1. RW says:

    Thanks for the report.

  2. jerry l krause says:

    Hi Roy,

    This response has been prepared for your next post, regardless of what its topic might be. For it is related to your previous comment to me: “yes, the dewpoint temperature is always below the temperature. Not sure what you are claiming that proves, Jerry.” (Climate Polling Results Lead to Weird Press Coverage August 13, 2014) and to your post of April 10, 2015 (Why Summer Nighttime Temperatures Don’t Fall Below Freezing). Which, if you read my responses to this post, you did not respond to them. Hence, there is no evidence that you read them.

    For convenience I quote a portion of your post. You began: “There’s something about the greenhouse effect /sky radiation / downwelling infrared / back radiation issue that keeps drawing me back to the subject.

    “I guess it’s the number of people who don’t believe the so-called greenhouse effect exists (I still get e-mails from them, even today), combined with the difficulty of convincing them that their everyday experience is consistent with its existence.

    ”So, just for laughs, here’s another demonstration, involving a simple model of the cooling of the soil at night.

    “At night the soil cools by loss of infrared radiation. The Stefan-Boltzmann equation lets us estimate the rate at which IR energy is being lost based upon surface temperature and emissivity, and simply dividing that by the product of the soil depth and soil bulk heat capacity gives us the rate at which the soil layer temperature will fall. Basic physics and thermodynamics.

    “From that we can make a simple time-dependent model to calculate the change in temperature throughout the night. This simple spreadsheet model I’ve provided here will allow you to change assumed parameters to see how to get a realistic temperature decline over 12 nighttime hours. What you will find is that the temperature falls to unrealistically cold levels unless you assume a large downwelling energy flux from the sky into the soil (also adjustable in the model).

    “If you are wondering, “what about cooling of the atmosphere in contact with the ground?”, well just make the soil layer deeper…it turns out that 0.2 meters of soil is equivalent in bulk heat capacity to about 200 m of atmosphere.

    “The adjustable parameters (in red in the spreadsheet) are soil depth (0.2 m is typical for day-night temperature changes), the soil heat capacity (2.5 is typical, water is 4.18), the IR emissivity (0.90-0.95 would be typical), the downwelling sky radiation intensity (0 for all you sky dragon slayers [SDSs] out there, 250-350 for the rest of us), and the starting temperature (300 K is about 80 deg. F).

    “For example, for a 0.2 m moist soil layer (about 8 inches thick), starting at 80 deg. F, the rate of energy loss over 12 hours is enough to cool that soil layer down to 25 deg. F….IF you don’t assume any downwelling IR from the sky (the SDS-recommended setting):

    “But, if you assume the Trenberthian global-average value of 330 W/m2 for downwelling sky radiation, the soil cools from 80 to about 67 deg. F, a much more realistic value.”

    My comments will be based upon the common saying: ‘intuitive knowledge keeps pace with accurate definition.’ Which Elzevirs, the publishers of Galileo’s book—Dialogues Concerning Two New Sciences—called to the attention of the book’s readers. It has taken me several years to comprehend it. Slowly, I have become convinced that accurate definition ultimately refers to the specific natural system (phenomenon) being studied.

    For several years I have studied historical weather records (wunderground.com) of various locations at various seasons to see the observed temperature difference between an afternoon high temperature and the low temperature of the next morning when the skies are reported to be continuously clear. The headings of the twelve columns which comprise the dataset of these records are: Time, Temp, Dew Point, Humidity, Pressure, Visibility, Wind Dir, Wind Speed, Gust Speed, Precip, Events, Conditions. The latter eleven headings are the factors used to accurately define the atmosphere every hour, if not more often. Most headings need no definition. But the last three might. Precip is the amount of precipitation that has been measured since the previous record. Events is the precipitation event occurring at the time including fog. Conditions is the condition of the atmosphere (sky): clear, partly cloudy, mostly cloudy, overcast.

    In describing (defining) your scenario, you do not specify one of these eleven factors. Even the temperature you refer to is not of the atmosphere but of the soil. To be meaningful, your scenario requires that the sky condition be clear.
    Since Galileo’s science was built on actual observation, not thought experiments; I call to your attention a portion of the historical weather record observed May 10 and 11, 2015 at the nearest airport to Huntsville AL. For the period (a little more than 10hrs) between sunset on the 10th and sunrise on the 11th, the sky was observed to be continuously clear. The recorded observation just before sunset for the atmosphere’s temperature was 82.9 (degrees Fahrenheit) and that for the atmosphere’s dew point temperature was 65.3. After sunset the first recorded observation for the temperature was 80.2 and for the dew point was 65.1. Before sunrise on the 11th the temperature was 69.6 and the dew point was 65.3. After sunrise the temperature was 67.6, the minimum temperature of the 11th, and the dew point was 65.1.

    These observations do not refute the greenhouse effect. In fact they might seem to support it because the atmosphere’s temperature never decreased to the atmosphere’s dew point temperature. A critical observation of this night and morning is never reported because it is not directly related to the atmosphere. But it is very easy to observe if it exists. It is the dew which is commonly observed to form on surfaces, totally exposed to the clear sky, when their temperatures do cool to the dew point temperature. Blades of grass, roofs of cars and houses are some of these common exposed surfaces. The sensor of the atmospheric temperature is not directly exposed to the clear sky because the temperature it would measure during the daytime, if directly illuminated by direct solar radiation, would not begin to reflect that of the atmosphere. I often have observed that dew does not form on the top of my van parked under a tree at the same time dew has formed on the tops of nearby cars fully exposed to the clear sky. This explains the temperature difference observed between the temperature of the atmosphere (measured under a roof 1.5m above the surface) and the observed dew point temperature of the atmosphere when dew has clearly begun to form on exposed surfaces well before sunrise.

    But how do I know that dew began to form on the stated exposed surfaces during this night? It is because of your accurate definition that the soil was moist. More than 40 years ago, I was expected to teach about the greenhouse effect in my chemistry classes. At that time, an example of the greenhouse effect cited in textbooks and news articles was the warm summer nights of Iowa. For it was reasoned that these warm nights were the result of the abundant water vapor that was in its well-known humid atmosphere. For water vapor was (is?) the best greenhouse gas known. Because I grew up on a farm, I knew from everyday experience, if the soil was moist and the atmosphere’s temperature 80 at sunset, that dew would form on surfaces exposed to a clear sky during that night, releasing the latent heat of condensation of the water vapor.

    And I know that this example of the greenhouse effect quietly disappeared from the textbooks and news articles. But I know it is very easy to overlook the obvious. For only a day or two ago, as I write this, did I see that your scenario was merely a rerun of this old, discarded, example of the greenhouse effect.

    Have a good day, Jerry

    • fonzarelli says:

      Jerry, as a kid growing up i used to like to read james michenor novels. It gave me good practice for reading your (long…) comments! If i were to boil down (the meaning of) your comment you’re saying that the latent heat content of water vapor can also account for night time warming. (correct?) Any idea how much warming can be attributed to heat content in comparison to green house gases? Thanx, fonzie…

      • gbaikie (@gbaikie1) says:

        It seems it would be less than 5 C in terms of the average temperature.
        It seems one gets most warming where there is the most water vapor. So mostly in tropics.
        Tropics generally doesn’t have wide swings in day and nite temperature. So, water vapor doesn’t make the day warmer, instead reduces night time cooling.
        Which also what greenhouse gases do [btw].
        The next significant area of latent heat warming would be related to clouds- so water vapor adding to to water droplets
        of clouds- in terms of size and number.
        Of course there is lot of clouds in tropics, but I think cloud in temperate zone have number of reasons they prevent nights cooling as much as without clouds, and one those factor is related to latent heat of condensation.

      • jerry l krause says:

        Hi fonzarelli,

        Just a short comment for now. Been to the Oregon Outback learning how the pioneers, who settled this state, did pre-internal combustion engine. My concession was the internal combustion engine powered chainsaw because I did not have a partner to pull the other end of a draw-saw. But I did use a bow-saw to limb from time to time.

        You wrote: “If i were to boil down (the meaning of) your comment you’re saying that the latent heat content of water vapor can also account for night time warming. (correct?)”

        Wrong. Relative to the earth’s diurnal temperature cycle, nothing really warms between sunset and sunrise as solar radiation is the earth’s principal source of energy. I totally agree with Roy when he stated: “At night the soil cools by loss of infrared radiation.” That is if ‘earth’s surface’ if substituted for ‘soil’. For the only way the earth’s surface, whether solid or liquid, can cool by loss of infrared radiation is that this radiation is transmitted through the atmosphere, which contains greenhouse gases, to space.

        Initially the sensible heat of the earth’s surface is the source of the energy that is being radiated to space. But once the surface cools to the atmosphere’s dewpoint temperature, the latent heat of condensation of the atmosphere’s water vapor becomes the principal source of energy that is being radiated to space and the rate of the surface cooling drastically decreases because of the magnitude of water vapor’s latent heat of condensation.

        Have a good day, Jerry

        • fonzarelli says:

          Jerry, a very robust conversation came up the last post (“TRMM satellite coming home next month”) on the subject of “night time warming”. In the end, i was convinced that the disagreements among the commentors was much ado about nothing. After all the semantic wrangling by some really brilliant participants, i’m convince that it’s o.k. to say that GHGs (assuming the basic mechanics of “back radiation” are correct) actually DO warm the night time surface. As long as the surface is cooling faster than GHGs can warm the surface then there is NO violation of the second law of thermodynamics. None the less, the GHGs do in fact warm…

  3. Werner Brozek says:

    The average after 5 months is 0.18 and this would rank 6th if it stayed this way for the rest of the year. RSS also ranks 6th after 5 months. In contrast, GISS and Hadcrut4.3 are in first place after 4 months and there is no way that May will knock either one out of first place.

    • Pause continues, nothing happening to the temperature trend other then being greatly influenced by ENSO phase.

      • Simon says:

        Except if we have an El Nino like 1998 Roy is going to need a new graph coz we will leap off the top from this starting point. Hold on that must mean we are still warming… doesn’t it?

        • geran says:

          Simon, are you really “Norman”?

        • Aaron S says:

          The irony Simon is that the 0.4 C event would only get us to the IPCC model base case global temperature… so in the unlikely event we get such a step it only support the P50 scenario, which is basically as u say off the graph. So if that doesnt happen do you agree the models are running hot?

  4. Aaron S says:

    I (like others) am excited to observe if this El Nino represents a step change in global temperature… or just a short term event. Thanks for the update.

      • fonzarelli says:

        Aaron, last summer you asked me for a link about a pair of russian solar scientists (who predicted the current weak solar cycle). Here (at last…) is one of them. This paper has Abdussamotov’s predictions going forward into the future. It appears as though this year is d-day for planet earth according to him…

        SALVATORE, in the paper, abdussamatov mentions that the end of the maximum of solar cycle 24 happened at the end of 2014. Once in the abstract: “…after the maximum phase of the 24th solar cycle approximately since the end of 2014” And three times in the paper itself: “…after the maximum phase of the solar cycle 24 approximately since the end of 2014”, “…after the maximum phase of solar cycle 24 (approximately at the end of 2014)” & “Approximately in the end of 2014 we begin the descent…”
        (So it looks like “crazy davy” owes you another dinner…)

        • Aaron S says:

          Thanks i will have a look.

          • fonzarelli says:

            Aaron, thanks for acknowledging receipt. I also recall playing a lengthy game of “computer tag” (blog tag?) trying to get the solanki paper to you last summer. (i’ve done funner things…)

  5. geran says:

    Dr. Roy, a stupid question, as you have time: Is there an online source for the UAH 30-year monthly averages. That is, May’s global anomaly is +0.27, meaning it is 0.27 ºC ABOVE the average. But, what is that “average” value.

    (It’s “stupid” only because I have been following UAH temps for years and only just now thought to ask it!)

    Thanks.

    • Roy Spencer says:

      The average value depends upon the time of year and location. If it’s the global annual average for 1981-2010 you are asking about, I don’t think we paid attention to the actual number, but it can be computed from the monthly gridpoint annual cycle data, in hundredths of Kelvins, here:
      http://vortex.nsstc.uah.edu/data/msu/v6.0beta/tlt/tltmonacg_6.0beta2

      Just perusing the data, I see that even in the tropics the temperatures are not much above freezing (273K). I’m guessing the global average will be around 260 K, maybe a little more.

      • geran says:

        Ok, that helps.

        1) Just to help me sort the data, is the data set, you linked to, ALL temps or just “global”?

        2) For example, is the last value, 239.14 K, for May 2015? Is it “global” or something else?

        Thanks, again!

  6. What the accurate data is telling us is the pause is intact and CO2 is having no impact on the temperature over land or oceans for that matter.

    • David A says:

      Wrong Salatore.

      Hadley’s sea surface temperature anomaly for May was the 2nd highest of any month since 1850, after only last August.

      http://www.metoffice.gov.uk/hadobs/hadsst3/data/HadSST.3.1.1.0/diagnostics/HadSST.3.1.1.0_monthly_globe_ts.txt

      2014 was a record year for SST, according to Hadley’s data. So far 2015 is tied with it.

      Ocean heat content in the top 2000 meters of the ocean has a positive acceleration:

      http://davidappell.blogspot.com/2015/05/another-large-jump-in-ocean-warming.html

      • JohnKl says:

        oDavid A,

        IR re-emitted by atmospheric gasses to the ocean surface would at best penetrate a very small distance before being absorbed by water, maybe a few centimeters. However, water proves transparent to the visible spectrum and it will as a result penetrate deep into the ocean water before being absorbed by particulate matter in the ocean or the ocean floor. Therefore the likely cause of ocean warming down to 2000 meters would be fluctuations in absorption of the visible spectrum or in other words direct solar radiation. Thanks and…

        Have a great day!

        • David A says:

          John:

          1) The ocean’s surface is turbulent, not mirror smooth. Water in a top thin layer mixes with water beneath it.

          2) Even if the surface were perfectly smooth, warming of a top thin layer would result in some of that heat conducting downward.

          3) The warming air just above the ocean surface reduces reduces ocean heat loss into the atmosphere, which in effect warms the ocean. Same for a net reduction in the ocean’s IR emissions, with increasing GHGs (including water vapor) just above it, absorbing and radiating more back down.

          4) Winds. See
          http://www.realclimate.org/index.php/archives/2013/09/what-ocean-heating-reveals-about-global-warming/?wpmp_tp=1

          • mpainter says:

            David A,
            In fact, water is opaque to LWIR and energy from that wavelength is very transient, being absorbed at the air/water interface and converted to latent energy within seconds. The profile of sea surface temperature shows that heat flows from the subskin to the air-ocean interface (conduction), hence the energy incident from IR cannot move downward from the interface.
            The dominant and overriding process of the ocean surface is evaporation, understandably since this is the primary means by which oceans cool. Incidental IR merely accelerates that process.
            Does wind add heat to the ocean? Absolutely not as wind accelerates evaporation rates, the higher the wind, the higher the rate of evaporation.
            Your link reveals that the author, one “stefan”, lacks understanding of all of these processes.
            The claim that wind somehow increases SST or OHC has got it backwards.

          • Scott says:

            mpainter and JohnKl,

            Please stop embarrassing CAGW skeptics with these claims. They’re patently absurd. I discussed this at length with mpainter a few posts ago. I posted multiple mechanisms by which absorbed energy from IR light could be transferred to increased depths and two real-world experiments showing this, and the most I got in response was that I needed to study a graph (TWA ocean temp profile) that mpainter clearly doesn’t understand.

            Case in point, you say “converted to latent energy within seconds” after absorbance of IR. You’re also on record saying the IR is fully absorbed within 3 um of depth. But these two claims when combined actually negate your conclusion. Reason? Simple: root(2Dt) for water in one second (so less than your plural seconds) is 68 microns, or about 20x longer than your posited absorbance depth. I posted this on the previous thread, which you ignored. You later said I needed to demonstrate some mechanism showing that heat transfer could outpace an evaporation rate. I posted similar calculations a second time only to be ignored a second time. Of course, anyone who’s ever done real-life heat transfer calculations knows that for something like the ocean the convective mixing is much more important than the diffusional distance, so we’re talking many orders of magnitude faster than what is needed.

            I do no not get along with David A at all, but here he is absolutely correct.

            -Scott

          • mpainter says:

            Scott,
            On that exchange you demonstrated inability to read the data and a lack of understanding of convection, which is a thermodynamic process. You still think of convection in terms of molecular diffusion or as being caused by the turbulence of waves. You apparently do not understand that convection requires warming with depth instead of cooling. You would not allow me to remedy your confusion, but threatened “to kick your a$s”.

          • Scott says:

            mpainter,

            On that exchange you demonstrated inability to read the data and a lack of understanding of convection, which is a thermodynamic process.

            Please show me how I “demonstrated inability to read the data”. I came to a different conclusion than you about a plot. I’ve backed up my conclusion with mechanisms, but all of your support has been proof by assertion. As for convection, you have a very limited view of convection, similar to what I might expect a high schooler to have. People who actually do this, like chemical engineers, define it quite differently than you appear to. Just see this for instance:
            http://en.wikipedia.org/wiki/Convective_heat_transfer
            Specifically, the first sentence says enough:
            Convective heat transfer, often referred to simply as convection, is the transfer of heat from one place to another by the movement of fluids.

            So as long as there is any temperature difference (which you acknowledge as true) and there is bulk fluid flow (waves, obviously true), there is convective heat transfer. So yes, waves are important and a major component of convection.

            You still think of convection in terms of molecular diffusion or as being caused by the turbulence of waves. You apparently do not understand that convection requires warming with depth instead of cooling.

            This just shows your massive ignorance. You think that convective heat transfer only occurs due to buoyant forces. Just read this sentence from the above link:
            Convection can be “forced” by movement of a fluid by means other than buoyancy forces (for example, a water pump in an automobile engine).
            Or ask any practicing chemical engineer if turning on a fan in a room increases the convective heat transfer. In this case, the bulk movement of the fluid through waves forces the convection.

            You would not allow me to remedy your confusion, but threatened “to kick your a$s”.

            I allowed free discussion…certainly no disallowing of remedies. The problem is, all you’ve given is proof by assertion. When I try to “remedy” your confusion/ignorance, you are the one not allowing it. I did the diffusion calcs…ignored. You asked for a way to transfer energy faster than evaporation (basically asking for something that would falsify your conjecture)…I provided the diffusion calculation again…ignored again. I’ve also provided two real-world examples that are easy to perform showing that you’re wrong…also ignored.

            As for the threat, the quote is both incorrect and out of context. For interested readers, here is the actual link (which mpainter never seems to provide [links] no matter what’s being discussed):
            http://www.drroyspencer.com/2015/05/new-satellite-upper-troposphere-product-still-no-tropical-hotspot/#comment-192656
            Here’s the full quote, still missing context:

            Give me the link to your Met Office profile and let me kick your @s$ with it…

            While I shouldn’t have said that, it’s clearly not the “violence” you indicate given that a hyperlink isn’t something physical. So why did I say it? Frustration from someone being so wrong and ignoring all the examples of how he/she is wrong. I also tend to match my rhetoric to the rhetoric of the person I’m conversing with, and these were previous things from mpainter to or about me:

            “And so you prefer to assert your views ignorantly.” [despite my assertions having backing]
            “Scot Sez ‘ I ain’t gonna look at no profile'” [despite no LINK to the profile to go off of]
            “…you are spouting nonsense…”[In reference to not studying a non-existent link]
            “You are incoherent.”[Despite discussion and examples that any competent engineer would understand.]

            Oh, and of course a couple of “Tsk, Tsk” comments thrown in there. After my comment, there was this comment:

            Study the data, then report your deductions, assuming that you are capable of such. I’ll wager that you are not. Probably you will never make the effort. …[some imaginary agreement between a misnamed person that mpainter later chided me for not knowing gender]… So, your pretense of having read our exchange falls to the ground, where lies your pretense at science.

            How is that at all respectful rhetoric? If you want to complain about supposed threats of violence, fine. Then go look in the mirror if and contemplate a little if you want to have a respectful conversation.

            Are you willing to actually learn yet, or are you just going to continue to project your confusion/ignorance onto other people? You still have not addressed my criticisms of your conjecture except for a little proof by assertion. Even when you asked to be shown something faster than evaporation and were shown it by orders of magnitude, you ignored it.

            -Scott

          • mpainter says:

            Scott:
            I note that you give as an example of convection the water pump of an automobile engine as intended to refute my assertion that convection in the ocean depends on warming with depth.

          • FTOP says:

            I thought I heard it all until I clicked on the link, but the justification for CAGW is boundless it its creativity.

            Wind is now able to drive temperatures up. I can’t wait to help save the world by getting people to stop blowing on their soup. All it does is warm the bottom of the bowl and heat it further.

            Another humanity saving measure from your friendly climate scientists.

          • You fail to recognise David Appell’s genious. Only he has realised that an atmospheric gas (CO2) can selectively warm the ocean surface layer but fail to warm the atmosphere.

        • JohnKl says:

          Hi Scott and David,

          Thank you for your replies. However, your points appear irrelevant for several reasons.

          First, allow me to address the Scott. You fail to address my points directly instead seemed concerned primarily with statements made by mpainter. Infrared long wave radiation will be absorbed quickly by water. The fact that energy may be conveyed by turbulence to lower depths doesn’t change the fact that the shorter wavelength visible spectrum contains far greater amounts of energy and penetrates far deeper than infra red radiation. Hence, the visible spectrum must play much greater role in ocean temperature especially at depth. Denial of basic physics wont help your case.

          2nd, David, given multiple causes you have yet to prove infrared played a significant role in the oceans warming at depth rather than the the visible spectrum or other causes.

          Have a great day!

          • Scott says:

            JohnKl says:
            June 9, 2015 at 8:06 PM

            Hi John,

            I’m not denying any basic physics, although mpainter is. Instead, I failed to read your comment properly and just assumed that your views aligned with mpainter, who’s views I vehemently disagree with. I apologize for this, I was in error. I see nothing wrong with your claims and agree with them. I do think the cutoff for significant energy being directly absorbed from visible light is probably ~200 m (see e.g. http://oceanservice.noaa.gov/facts/light_travel.html ), so additional heating at further depths is indirect no different from IR heating.

            Assuming that visible light levels are constant over mid- and long-time scales (an assumption I disagree with actually), then a major factor in SSTs would be changes in IR. That doesn’t mean that changes in infrared ARE the cause of SST changes, just that they COULD BE. But according to mpainter, IR doesn’t raise SSTs at all b/c IR absorbance just leads to evaporation, thus lowering the SST. Yet, I have personally used a CO laser cutter to vigorously heat up water from above, which should be impossible with his/her view.

            -Scott

          • fonzarelli says:

            Howdy John, i just noticed something interesting in a tisdale link posted by salvatore (june 9 11:35am) further on down the page. The argo data from the ukmo begins shortly after the peak of solar cycle 23 and shows a downward trend until 2010. At that point solar cycle 24 begins and from the argo data we then see an upward trend til the present. Certainly nothing definitive here, BUT it is interesting…

      • crakar24 says:

        David please tell us where Hadley got his data from dating way back to the 1800’s……………when will you people learn to think for yourselves rather than just swallow the bullshit

        • David A says:

          Crakar: The Hadley Centre’s methods are documented on their site and in their papers.

        • mpainter says:

          Why don’t you tell us yourself, David A.
          Share your understanding with us. Por favor.

        • If they have data going back to the 1800’s then the simple answer is their measurements are based on the output of a computer model, and not observations only. Eco worriers prefer virtual reality to reality these days.

      • No David the data you are using is not correct.

  7. My position because I am in position to do it is I will not let the IPCC influence my opinion on what the climate is doing and where it may be heading. In addition agenda driven data put forth by AGW enthusiast I likewise ignore just like they do with data which is not agenda driven.

    Satellite data,radiosonde data and agencies of the like of Weatherbell Inc., is the data I rely on to see where the state of the climate is and where it may be heading.

    • David A says:

      You own agenda is clear — you accept the data you like, and reject the data you don’t, seemingly without any rational reason. That’s not scientific.

      • David, the IPCC is a not a credible place for science when their short term projections have failed.

        • David A says:

          Thomas, in order for climate models to do short-term predictions (~1-2 decades), they’d need to know the natural variability which will happen over that time, since that can still be of the same level as AGW at this point — especially volcanic eruptions, changes in solar intensity, and ENSOs.

          How are modelers supposed to read the future?

          Also, WHY is it necessary for climate models to do short-term predictions?

          • mpainter says:

            The failure of the GCM’s over the past two decades are the only empirical measure we have of the reliability of the models, David.
            How long should we suspend judgement before drawing conclusions? Thirty years? Forty? Ha, good luck on keeping the AGW ball in the air for much longer. Scientists with a juggling act, and slapsticks.

          • Lewis says:

            Dear David A., I will ask again: what is it about AGW we are supposed to be afraid of?

            Increased CO2 in atmosphere leads to better plant growth?

            Higher temperatures in upper latitudes making more land available for human agriculture?

            Or is it just the flooding of Miami, NYC, New Orleans and a few other cities, stupidly placed on the ocean front, which had been rising for the past 20,000 years?

            If none of the above, please explain.

          • If you accept David Appell’s argument that it takes multiple decades to verify climate model output, he must also admit that no climate model can be used as evidence for anything… yet. In other words, the models are all based on a particular (and somewhat far fetched) theory of extreme temperature sensitivity to CO2.

          • fonzarelli says:

            Lewis, cities don’t get “placed”, they just kind of grow into what they are. It’s very interesting to read about the history of galveston. In it’s day it was poised to become THE big city on the gulf, but the hurricane at the turn of the century changed all that. And as a consequence, houston took it’s place… (galveston, we have a problem?)

      • tonyM says:

        David A:
        David A:
        That’s a bit rich coming from you. Reflect on your earlier comment of SST and ocean heat increases.

        Righteo, the ocean T must have accelerated by 0.000001C per century. Must be due to the 25.623 joules of energy previously hidden in Trenberth’s deep blue sea. It’s coming to bite us now. Sorry, my error, I’m out by 4.123j on that number.

        Now what I want to know is it before or after the adjustments? Is it before or after they decide which buoys are not working? Is it before or after homogenization, infilling and past-ur-eyesing. Is it before or after da Kurt arbitrary, finger in air adjustment mode at full swing? Is it before or after a misapplied kriging fad? Is it before or after Jones loses his homework?

        All we need now is for Phil Jones to come and tell us his error level; this will be followed swiftly by Gavin’s anomoly accuracy to one percent. Perfect, one can rely on their persistence.

        There, that’s real science for you!

        Why do you bother complaining about science with all this. Previously you have said the CAGW conjecture can’t be tested. What sort of science is that? Oh yes, you subscribe to Mickey Mouse Mann’s post modern version of science that proofs are for spirits and maths; climatology is for the personal feel good factor. As long as it feels right you just keep proselytising and spin the yarns.

        Guess that is why Joe Bastardi told Mann to go learn how to read a weather map.

        In case anyone feels I may have exaggerated just go look at Willis Eschenbach’s recent post on error levels for oceans (WUWT). I think Willis is even being generous in allowing the full error level reduction of the mean by supposed “extra” sampling.

        I have lumped SST and ocean into the same bag. So what it’s full of the same chaff anyway?

        Keep at it Salvatore!

        • David A says:

          Tony: Over the 10 years of Argo data for the top 2000 meters of the ocean, the acceleration of heat content is +0.08 W/m2 per year.

          http://davidappell.blogspot.com/2015/05/another-large-jump-in-ocean-warming.html

          Quoting this number in Celsius fails to note the between heat and temperature.

          • mpainter says:

            The Argo deep ocean temperature data showed a decrease in OHC when there was an “adjustment” made in 2009, I believe, and now we have deep ocean warming. All very simple, something anyone can see, never mind that neither the LT nor SST has warmed for over 15 years.
            But it seems that only the faithful put any faith in the Argo data.

          • David A says:

            Perhaps you mean the correction for a bias in XBT data found around that time?

            http://earthobservatory.nasa.gov/Features/OceanCooling/

            The global SST *has* warmed over the last 15 years, by +0.09 C according to the HadSST3 data:

            http://woodfortrees.org/plot/hadsst3gl/from:2000/to:2015

          • mpainter says:

            David, thanks for the reply.
            What does xbt data have to do with Argo data? That seems to be a spurious issue.

            What do other data sets say about SST? Your .06°C/decade trend does not impress, especially in view of the fact that SST is determined by insolation, not CO2 ( see my comment this thread).

            What does “Stefan” say about the studies which show reduced cloud coverage, globally, circa 1985-2000? Anything? Or does he ignore such studies?

          • mpainter says:

            Also, David, your NASA link is me more PR than science, but it is very revealing about the mindsets and confirmation bias in some scientists.
            A few quotes:
            Josh Willis: ” The oceans are absorbing more than 80% of global warming” he says “If you aren’t measuring heat content of the upper ocean, you aren’t measuring global warming”.

            Well, no global warming to be measured, and Argo shows cooling of the oceans, and AGW is in big trouble. What to do?

            Josh Willis said that he regarded the cooling shown by Argo data to be ” a speed bump on the way to global warming”.
            But by 2009, Argo still showed cooling, and folks were getting alarmed. Something had to be done. Obviously Argo data had to be warmed.
            One more quote from that link:

            “On blogs and radio talk shows, AGW deniers cited the results [Argo cooling] as proof that global warming wasn’t real and that climate scientists didn’t know what they were doing”.
            So they warmed the data. And see how the globe warms, as _everyone_ knows it should.
            Summation. Argo data shows cooling, but the data has been doctored to show warming.
            Note there is no independent source of Argo data, so they good folks controlling the data can rest assured that there will be no embarrassment on this point.

          • fonzarelli says:

            mpainter, isn’t it odd that with the holocene it was about land warming, but with modern warming we have to dive into the oceans to find it?

          • tonyM says:

            David A:
            As usual you never answer the questions posed but simply divert to some other fantasy. Bluntly, most of us no longer have faith in data which has been touched by NOAA/CRU/GISS. Even TOA balances are so far out that they simply adjust them to the level of models – models which have consistently failed. Real science here!

            As for your comment re the difference between T and heat content, pray tell, how do they measure the heat content of the ocean? I guess they have a giant weighing machine calibrated for “heat” content.

            In may have escaped your observation, but no one has ever been scalded by jumping into pure ocean despite all the kazillions of joules of “heat” contained therein. I wonder why?

            Stick to Mickey Mann who claimed to be a Nobel laureate; he has all the answers.

          • mpainter says:

            Yea, fonzarelli, at the start of the Holocene there was plenty of warming, yessir, see how the ice sheets melt. But these days, warming is a scarce commodity, so you have to dig for it in places where no one else thinks to look.. like the bottom of the ocean.

          • Interesting that David Appell only wants to talk about ocean temperature measurements on a blog dedicated to atmospheric temperature measurements. The great thing about ocean temperature measurement is that it’s deeply uncertain and quite spotty. The more difficult it is to measure something, the more the eco worriers love the data set. What better place to hide their paranoia in?

            And of course, if the data sets showed opposite trends, David Appell would ignore the oceans and only want to talk about the atmosphere. That’s what cranks do.

      • TedM says:

        David A says “you accept the data you like, and reject the data you don’t”

        Is this a classic case of projection?

  8. Thanks, Dr. Spencer. I have updated your graphic in my climate and meteorology pages.
    Not surprised to see the continued ENSO is showing its effect in the global temperature.

  9. Dan Pangburn says:

    Analysis shows that there is no significant net energy change to the planet from ocean cycles (with this assumption, R^2 = 0.97+ since before 1900) so ENSO must eventually go down as much as up.

    • Roy W. Spencer says:

      yes, if there’s a big warm El Nino, it’s usually followed by a big cool La Nina.

      • tonyM says:

        Dr Spencer,
        Have asked you before but I can’t help but observe that the global T changes in satellite records could be lumped into two categories: 1978 PDO shift and the 1978 El Nino shifting the levels upwards to new plateaus.

        I am aware of McItrick’s paper suggesting that if one allows for the great PDO shift in 1978 then there is no statistically significant warming since 1980. Statistics can be quite meaningless for even blind Freddie would observe that the T plateau of the last decade or more has shifted up compared to the plateau before the 1998 El Nino to 1980 (even if we don’t exclude the 1998 – 2000 Nino/Nina yoyo).

        Is there any explanation for these two plateus ie why do they seem to persist after major ocean shifts rather than discharge ocean heat to the atmosphere, radiate more to space and return to the previous ‘quasi equilibrium’ level?

        On the topic of this year’s pending El Nino I seem to recall a comment by Joe Bastardi that this would not be such a major event due to the waters off the coast of Australia being cooler than before the 1998 event. My recall on this may be hazy and would welcome some comment.

        • tonyM says:

          Found Joe’s comment.

          My memory is poor as he said the WARMER waters off the Oz east coast would provide lower pressures and hence the easterly winds would not abate as much.

        • yes, I’ve written and we’ve published on the ability of natural multi-decadal climate cycles to change the global energy balance by about the same amount as estimated from greenhouse gas forcing.

          As a result of the IPCC assuming natural climate forcing does not exist (the term, or any term analogous, is absent from their previous reports), they have overestimated climate sensitivity by at least a factor of 2.

          Yes, the ocean and atmosphere has “warmed” to some extent. But (1) there is little to no evidence that it’s a bad thing; (2) more CO2 is probably good for the biosphere; and (3) we can’t significantly slow our use of fossil fuels anytime soon, anyway, without embracing nuclear power again.

          • David A says:

            Why is the relevant question what is good for the biosphere, and not what is good for humans? The biosphere will get along without us (except for the species we drive to extinction.) Is there some evidence that the pre-industrial level of atmospheric CO2 was a problem for the biosphere?

          • mpainter says:

            What is wrong with atmospheric CO2, pray tell David.

          • TedM says:

            Are you assuming that humans are not part of the biosphere, and do not benefit from positive interactions within it.

          • gbaikie says:

            –(3) we can’t significantly slow our use of fossil fuels anytime soon, anyway, without embracing nuclear power again.–

            Again?
            “As of April 2015, 30 countries worldwide are operating 443 nuclear reactors for electricity generation and 66 new nuclear plants are under construction in 15 countries.

            Nuclear power plants provided 10.9 percent of the world’s electricity production in 2012. In 2014, 13 countries relied on nuclear energy to supply at least one-quarter of their total electricity.”
            http://www.nei.org/Knowledge-Center/Nuclear-Statistics/World-Statistics

            What does again mean? US has constantly had about 20% of electrical power from nuclear energy. And world has been generally increasing the amount of nuclear energy use.

            I would say in terms nuclear energy in US it’s been static for decades. And I guess due ever increasing global demand of electrical power, the addition of new nuclear power plants may not be keeping up with that increase demand- particularly in China and India [though both adding as much as they can].

            Alternative energy on other hand is minuscule in terms of providing any electrical power for global electrical needs and in countries where they high percentage of solar and wind, such as Germany, it has done nothing to reduce CO2 emission.
            So Nuclear power has continued to be the only means of reducing CO2 emission [assuming one has already tapped the easier hydro power projects in a region]. And over the years reduced billion of tonnes of CO2, which otherwise would emitted from coal power plants.
            The only countries which have made nuclear energy the major source of electrical power of a country are those listed 13 countries which are getting 25% of more of the electrical power from nuclear energy.

            I would say “we” can’t do anything about it {US and Europe], because we encouraged heavy use of electrical power to countries like China, and China and india are building coal plants as fast as they can [and nuclear plants can’t made as quickly] to have enough energy.
            So if we wanted to do something about CO2, we would increase heavy industry so they it’s energy needs could met with not coal plants [or wood burning plants].
            Or “we” can’t do much about CO2, because China produces twice as much CO2 as the US, and India will soon also being emitting twice as much as US.

            One thing we could do is try to get India and China to make more and use more natural gas- which US is world leader in natural gas use and production. And gas power plants are competitive with coal in the US [which resulted in US CO2 emission lowering].

          • Gordon Robertson says:

            @Roy “Yes, the ocean and atmosphere has “warmed” to some extent”.

            According to the UAH 33 year report it’s about 0.3C in 33 years, based on the 1980 – 2010 global average. Most of that seems to have come in a sudden step of about 0.25 C circa 2001, following the 1998 extreme El Nino.

            As a diehard physics type I am sensing that warming as an impulse-type shock to the atmospheric-ocean system caused by the sudden 1997/98 El Nino spike.

          • “Is there some evidence that the pre-industrial level of atmospheric CO2 was a problem for the biosphere?”

            All basic common sense and logic gets thrown out with David Appell. Extra CO2 gets pumped into green houses to aid food production because plant life loves it. But that’s not evidence!

          • fonzarelli says:

            For the “umpteenth” time folks (sigh?):

            http://www.woodfortrees.org/plot/esrl-co2/from:1959/mean:24/derivative/plot/hadcrut4sh/from:1959/scale:0.22/offset:0.10

            Carbon growth has tracked with temperature since the inception of the mlo data set. China and India can build as many factories as they want. It won’t effect carbon growth one iota (let alone temperature)…

          • An Inquirer says:

            David A: “Is there some evidence that the pre-industrial level of atmospheric CO2 was a problem for the biosphere?”

            We might have differing concept of what is a problem for the biosphere, but for farmers to get only 50 bushels of corn per acre IS A PROBLEM. At the present time, I believe that of current product levels, 38 bushels per acre is due to increased CO2 levels. That feeds a lot of people!

  10. Rick Adkison says:

    I was wondering when some warming might show up from this El Nino since it has been ongoing for awhiule (albeit initially weakly). We certtainly have gotten alot of rain in Kansas this Spring which I suspect is probably related.

  11. ossqss says:

    With Paris looming in December, it’s gonna get hot, one way or another!

    Just sayin,,,,

    https://www.youtube.com/watch?v=EhZba-P7R18

  12. Tim Wells says:

    Not much warming in the UK, very few warm days so far and we are into June. If things are true, we could be in for another historically cold winter, as in 2010, when we saw record cold and levels of snow.

  13. Tim Wells says:

    Not much warming in the UK, very few warm days so far and we are into June. If things are true, we could be in for another historically cold winter, as in 2010, when we saw record cold and levels of snow.

  14. Aaron S says:

    Roy, or anyone, is there any research comparing the sensitivity of different data sets to global events like volcanoes la nina and el nino? It seems to me such research could add to understanding given volcanoes have a duration and have nothing to do with ocean temps and the enso cycle could be compared directly to land and ocean temps. I just feel some of the filters NOAA use likely would not work as well as less manipulated data through dynamic events. Ive never seen them all plotted together.

    • Pinatubo was the single biggest climate event in the satellite record that could be used to test estimates of climate sensitivity, and the resulting cooling showed up pretty well in the satellite data. But sensitivity requires a pretty accurate knowledge of the *forcing* causing the cooling, and that estimate is pretty uncertain, since all we had was ERBE measurements. Combined with the uncertainties of an ENSO event at about the same time and the associated change in vertical ocean circulation, there are simply too many variables to get much out of the data. Back when I looked at it I decided you could get just about any answer you wanted.

    • Gordon Robertson says:

      @Aaron S “is there any research comparing the sensitivity of different data sets to global events like volcanoes la nina and el nino?”

      Does this reveal anything related to your question? It’s a study by Tsonis et al of the all the oceanic oscillations between 1900 and 2000.

      link:

      http://onlinelibrary.wiley.com/doi/10.1029/2007GL030288/full

      PDF only:

      http://onlinelibrary.wiley.com/doi/10.1029/2007GL030288/pdf

  15. pochas says:

    As a matter of interest, the “Quasi Biennial Oscillation” (QBO) is discussed here.

    http://www.geo.fu-berlin.de/en/met/ag/strat/produkte/qbo/

    The easterly vs westerly wind pattern is diagrammed (Figure 1) and note that during the 1997 – 1998 El Niño the zero line (no wind at all) reached the surface for an extended time. That means that the trade winds quit and the stagnant atmosphere let the sea surface warm because there was little convection along the Intertropical Convergence Zone. Currently, the QBO zero velocity line is high in the atmosphere which, to my way of thinking, makes a strong El Niño unlikely in the short term.

    This illustrates the importance of convection as a mechanism for regulating the earth’s temperature. When convection weakens, temperatures go up fast. When it strengthens, things cool down, but only slowly.

    Why does an El Niño produce a step up in temperature which seems not to go away? Because sunlight warms the top 100 meters of ocean, but only the top millimeter is involved in reradiating the heat to space. So incoming shortwave is efficiently trapped but reradiating the trapped heat requires mixing the top 100 meter layer to bring the warm water to the surface, an inefficient process that takes a long time.

    • mpainter says:

      The step-up is interesting. The El Ninos previous to and following the late warming trend show no step-up.
      Also interesting is the down-step of stratospheric temperature associated with the volcanoes El Chichon and Pinatubo.

    • Rob JM says:

      The 97 El Nino was a response to an ongoing 5% decrease in cloud cover. El Nino is a oceanic cooling process that warms the atmosphere before the energy is lost to space. There are initially positive feedback due to disruption of the normal convective cooling process, but eventually it forms a super heat pump that usually overshoots and leaves a deficit that causes La Nina.

      • Gordon Robertson says:

        @Rob JM…”The 97 El Nino was a response to an ongoing 5% decrease in cloud cover”.

        That explanation seems far too simple. ENSO is known to be affected by the Pacific Decadal Oscillation, which has nothing to do with cloud cover. The severity of ENSO is directly coupled to the phase of the PDO.

        Tsonis et al discovered that several oceanic oscillations like ENSO, the PDO, the Atlantic Multidecadal Oscillation, the Arctic Oscillation, etc., can account for all warming/cooling and climate changes between them over decades. When the oscillations align, they produce warming and when they don’t they produce cooling.

        There is no such thing as a positive feedback in the atmosphere. PF requires an independent amplifier and feedback on it’s own cannot cause amplification. Due to the constraints of the 2nd law, all feedbacks in the atmosphere must be negative.

        There is a type of positive feedback used in servo-systems but there is no gain associated with it. It depends only on the sign of the feedback.

    • Gordon Robertson says:

      @pochas …”When convection weakens, temperatures go up fast”.

      That’s what Lindzen claimed. He said that the average temp of the surface would be 72 C without convection.

      I experienced 40 C one day in a local desert climate without a trace of a breeze. It was unbearable to my rain forest adjusted body. The effect of the direct rays of the Sun without a convective breeze was too hard to take.

      Locals told me they sometimes left thermometers out of the shade for a laugh, and they would reach 56 C. I know that is highly unscientific but it lends credence to Lindzen’s claim.

  16. Climate science is in the dark ages from not agreeing or for that matter really not knowing why/how the climate of the earth changes to not even being able to agree on present and past data. Between all the adjustments and all the different sources to collect climate data I would say this field is in the dark ages. It is the only scientific area where one can say no progress has been made.

    The other side of the coin is ,there is opportunity because of the state this field is in.

    • Lewis says:

      Salvatore,

      Yet we KNOW, AGW exists and is a problem which must be addressed by raising the cost of energy, which mostly affects the poor.

      And, as always, I hope you’re wrong and the earth stays as warm as it is or gets warmer.

  17. Lasse says:

    Greenland inland-ice yearly melting is one month behind schedule. Not seen before!
    http://www.dmi.dk/uploads/tx_dmidatastore/webservice/e/n/i/b/m/Melt_combine.png

  18. Gordon Robertson says:

    Note that this area of warm water in the North Pacific that the University of Washington labeled ‘The Blob’ occurred in 1977 and labeled ‘The Great Pacific Climate Shift’, which later became the ‘Pacific Decadal Oscillation’.

    http://icecap.us/images/uploads/THE_GREAT_PACIFIC_CLIMATE_SHIFT_II.pdf

    I had read elsewhere that global temps rose a mysterious 0.2C in 1977. Same thing happened circa 2001, when they rose another 0.2C. That’s 0.4C of warming that is unaccounted for. It’s about half the warming claimed by the IPCC over the entire 20th century.

    If you factor in the recovery from the Little Ice Age, all warming attributed to anthropogenic warming by the IPCC has been accounted for without resorting to anthropogenic explanations.

  19. Werner Brozek says:

    UAH6.0 Update: With the May anomaly of 0.272 for UAH6.0, the pause there stays at 18 years and 4 months from February 1997 to May 2015.

    (RSS has a pause of 18 years and 6 months from December 1996 to May 2015. GISS and Hadcrut4.3 do not really have a pause at all since it is only a few months.)

  20. Dan M says:

    The pause may not be a pause, it may be the norm.

    The 1980’s and early 1990’s were cooler due to catastrophic volcanic effects that even warmists admit affected the climate.
    Mt St Helens 1980
    El Chichon 1982 which mitigated the strong El Nino of 1982-3 and affected the subsequent 2 years
    Mt Pinatubo 1991

    No eruptions since these have put nearly as much particulate matter into the upper atmosphere.

    Remove these effects and I wonder what the global average temperature would be since 1979 and what type of anomaly we would be talking about(or not talking about, since it would be so small).

  21. mpainter says:

    Inquirer,
    Your figures seem doubtful. You put that 76% of today’s corn production is due to increased CO2 levels. Can you substantiate that claim?

  22. Espen says:

    David A asks: “Is there some evidence that the pre-industrial level of atmospheric CO2 was a problem for the biosphere?”

    Not being optimal and being a problem is not the same thing, so your question is not well posed. I assume that you by “pre-industrial” don’t count as far back as 20000 years ago, but at that time, at the end of the last glacial maximum, lack of CO2 was really a problem, and the world’s terrestrial photosynthesis activity was only half of today’s: http://www.nature.com/ngeo/journal/v5/n1/full/ngeo1324.html

    • dave says:

      Thank you for a link to an interesting little paper.

      If one interprets it rightly (“…conversion of inert carbon pool…”) the authors are saying that sometimes the earth burns fossil fuel.

      Perhaps, we are just the latest, unwitting, tool in the hand of Gaia!

      • Espen says:

        Dave, I don’t have access to the full paper, but I don’t think they’re talking about fossil fuels, but rather inert carbon in soils and sediments.

  23. I mentioned your commendable transparency with regard to the issues prompting the version 6 revisions, and to your handling of the revisions.

    A reader posted this question, which I pass on to you. When did you post your code?

    Here’s the post:

    What happened to NASA’s missing weather satellites & their vital data about global warming?
    http://fabiusmaximus.com/2015/06/15/missing-satellites-global-temperature-85912/

  24. Possible dupe comment.

    I mentioned the high transparency of your team’s handling of the differences between the datasets of UAH and RSS, and the version 6 revisions. A comment asked a question — which I pass on to you — when did your team post its code?

    Here’s the post: What happened to NASA’s missing weather satellites & their vital data about global warming?
    http://fabiusmaximus.com/2015/06/15/missing-satellites-global-temperature-85912/

  25. Ken says:

    I have a question. I’ve noticed over at https://ghrc.nsstc.nasa.gov/amsutemps/amsutemps that some of the “channels” have failed at various times. Does this cause any problems with accuracy? Also, Will the satellite temperature records continue to be monitored in the long term? Or should we worry that there might come a time when too many satellites have failed and the “adjusted” thermometer record is the only available source for global temperature?

    • dave says:

      Ken :

      “…worry…”

      The observations from successive instruments overlap in time and are “dove-tailed” together. A bit like in dendochronology.

      So no need to worry.

Leave a Reply