Archive for June, 2020

CMIP6 Climate Models Producing 50% More Surface Warming than Observations since 1979

Thursday, June 25th, 2020

Those who defend climate model predictions often produce plots of observed surface temperature compared to the models which show very good agreement. Setting aside the debate over the continuing adjustments to the surface temperature record which produce ever-increasing warming trends, let’s look at how the most recent (CMIP6) models are doing compared to the latest version of the observations (however good those are).

First, I’d like to explain how some authors get such good agreement between the models and observations. Here are the two “techniques” they use that most annoy me.

  1. They look at long periods of time, say the last 100+ years. This improves the apparent agreement because most of that period was before there was substantial forcing of the climate system by increasing CO2.
  2. They plot anomalies about a common reference period, but do not show trend lines. Or, if they show trends lines, they do not start them at the same point at the beginning of the record. When you do this, the discrepancy between models and observations is split in half, with the discrepancy in the latter half of the record having the opposite sign of the discrepancy in the early part of the record. They say, “See? The observed temperatures in the last few decades nearly match the models!”

In the following plot (which will be included in a report I am doing for the Global Warming Policy Foundation) I avoid both of those problems. During the period of strongest greenhouse gas forcing (since 1979), the latest CMIP6 models reveal 50% more net surface warming from 1979 up to April 2020 (+1.08 deg. C) than do the observations (+0.72 deg. C).

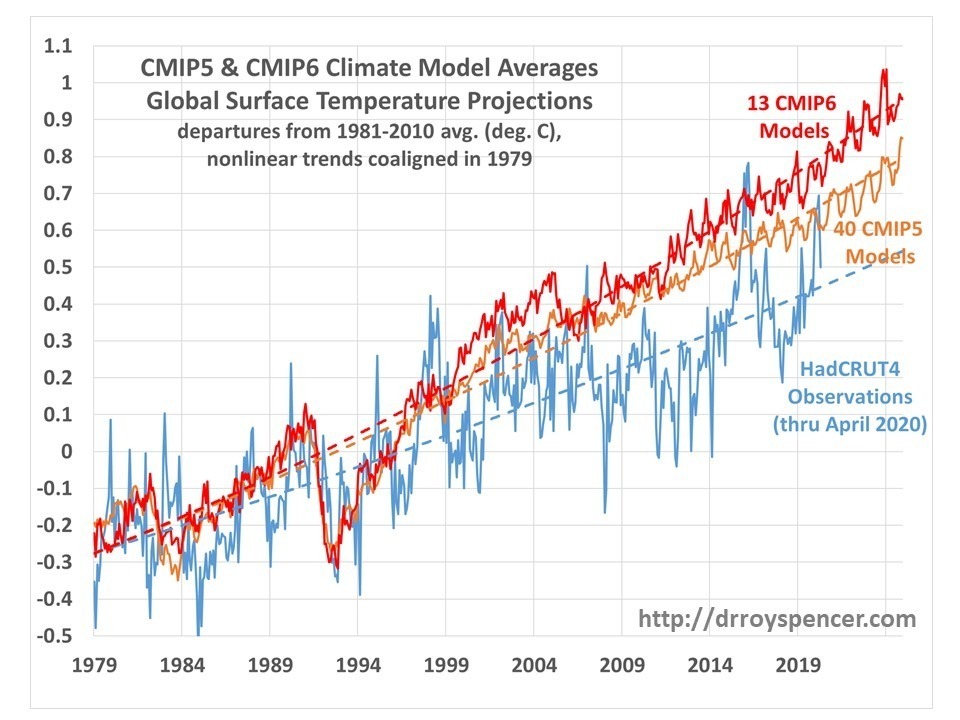
Note I have accounted for the trends being somewhat nonlinear, using a 2nd order polynomial fit to all three time series. Next, I have adjusted the CMIP time series vertically so that their polynomial fit lines are coaligned with the observations in 1979. I believe this is the most honest and meaningful way to intercompare the warming trends in different datasets.

As others have noted, it appears the CMIP6 models are producing even more warming than the CMIP5 models did… although the KNMI Climate Explorer website (from which all of the data was downloaded) has only 13 models archived so far.

COVID-19 Global Economic Downturn not Affecting CO2 Rise: May 2020 Update

Friday, June 5th, 2020

The Mauna Loa atmospheric CO2 concentration data continue to show no reduction in the rate of rise due to the recent global economic slowdown. This demonstrates how difficult it is to reduce global CO2 emissions without causing a major disruption to the global economy and exacerbation of poverty.

After removal of the strong seasonal cycle in Mauna Loa CO2 data, and a first order estimate of the CO2 influence of El Nino and La Nina activity (ENSO), the May 2020 update shows no indication of a reduction in the rate of rise in the last few months, when the reduction in economic activity should have shown up.

I had previously explained why the slowdown would likely not be large enough to affect measured atmospheric CO2 levels compared to natural variations in global sources and sinks of CO2. I calculated that the Energy Information Administration-estimated 11% reductions in CO2 emissions during 2020 would have to be four times larger to stop the rise of atmospheric CO2 over 2019 values (assuming no substantial natural variations in CO2 sources and sinks).

UAH Global Temperature Update for May 2020: +0.54 deg. C

Tuesday, June 2nd, 2020

The Version 6.0 global average lower tropospheric temperature (LT) anomaly for May, 2020 was +0.54 deg. C, up from the April, 2020 value of +0.38 deg. C.

The linear warming trend since January, 1979 is +0.14 C/decade (+0.12 C/decade over the global-averaged oceans, and +0.18 C/decade over global-averaged land).

Various regional LT departures from the 30-year (1981-2010) average for the last 17 months are:

 YEAR MO GLOBE NHEM. SHEM. TROPIC USA48 ARCTIC AUST 
2019 01 +0.38 +0.35 +0.41 +0.36 +0.53 -0.14 +1.15
2019 02 +0.37 +0.47 +0.28 +0.43 -0.02 +1.05 +0.05
2019 03 +0.34 +0.44 +0.25 +0.41 -0.55 +0.97 +0.59
2019 04 +0.44 +0.38 +0.51 +0.54 +0.49 +0.92 +0.91
2019 05 +0.32 +0.29 +0.35 +0.40 -0.61 +0.98 +0.38
2019 06 +0.47 +0.42 +0.52 +0.64 -0.64 +0.91 +0.35
2019 07 +0.38 +0.33 +0.44 +0.45 +0.10 +0.33 +0.87
2019 08 +0.39 +0.38 +0.39 +0.42 +0.17 +0.44 +0.24
2019 09 +0.61 +0.64 +0.59 +0.60 +1.14 +0.75 +0.57
2019 10 +0.46 +0.64 +0.28 +0.31 -0.03 +0.99 +0.50
2019 11 +0.55 +0.56 +0.54 +0.55 +0.21 +0.56 +0.38
2019 12 +0.56 +0.61 +0.50 +0.58 +0.92 +0.66 +0.94
2020 01 +0.56 +0.60 +0.53 +0.62 +0.73 +0.12 +0.66
2020 02 +0.76 +0.96 +0.55 +0.76 +0.38 +0.02 +0.30
2020 03 +0.48 +0.61 +0.34 +0.63 +1.09 -0.72 +0.17
2020 04 +0.38 +0.43 +0.34 +0.45 -0.59 +1.03 +0.97
2020 05 +0.54 +0.60 +0.49 +0.66 +0.17 +1.15 -0.15

The UAH LT global gridpoint anomaly image for May, 2020 should be available within the next week here.

The global and regional monthly anomalies for the various atmospheric layers we monitor should be available in the next few days at the following locations:

Lower Troposphere: http://vortex.nsstc.uah.edu/data/msu/v6.0/tlt/uahncdc_lt_6.0.txt
Mid-Troposphere: http://vortex.nsstc.uah.edu/data/msu/v6.0/tmt/uahncdc_mt_6.0.txt
Tropopause: http://vortex.nsstc.uah.edu/data/msu/v6.0/ttp/uahncdc_tp_6.0.txt
Lower Stratosphere: http://vortex.nsstc.uah.edu/data/msu/v6.0/tls/uahncdc_ls_6.0.txt