
 Home/Blog
… if you haven’t had a comment approved here before, I will need to approve your first one. Then your comments should be approved automatically after that. Sometimes I get busy and won’t check for several days, but I will try to check once or twice a day.
Archive for December, 2022
A reminder on commenting here…
Thursday, December 22nd, 2022Climate Sensitivity from 1970-2021 Warming Estimates
Monday, December 19th, 2022In response to reviewers’ comments on a paper John Christy and I submitted regarding the impact of El Nino and La Nina on climate sensitivity estimates, I decided to change the focus enough to require a total re-write of the paper.
The paper now addresses the question: If we take all of the various surface and sub-surface temperature datasets and their differing estimates of warming over the last 50 years, what does it imply for climate sensitivity?
The trouble with estimating climate sensitivity from observational data is that, even if the temperature observations were globally complete and error-free, you still have to know pretty accurately what the “forcing” was that caused the temperature change.
(Yes, I know some of you don’t like the forcing-feedback paradigm of climate change. Feel free to ignore this post if it bothers you.)
As a reminder, all temperature change in an object or system is due to an imbalance between rates of energy gained and energy lost, and the global warming hypothesis begins with the assumption that the climate system is naturally in a state of energy balance. Yes, I know (and agree) that this assumption cannot be demonstrated to be strictly true, as events like the Medieval Warm Period and Little Ice Age can attest.
But for the purpose of demonstration, let’s assume it’s true in today’s climate system, and that the only thing causing recent warming is anthropogenic greenhouse gas emission (mainly CO2). Does the current rate of warming suggest (as we are told) that a global warming disaster is upon us? I think this is an important question to address, separate from the question of whether some of the recent warming is natural (which would make AGW even less of a problem).
Lewis and Curry (most recently in 2018) addressed the ECS question in a similar manner by comparing temperatures and radiative forcing estimates between the late 1800s and early 2000s, and got answers somewhere in the range of 1.5 to 1.8 deg. C of eventual warming from a doubling of the pre-industrial CO2 concentration (2XCO2). These estimates are considerably lower than what the IPCC claims from (mostly) climate model projections.
Our approach is somewhat different from Lewis & Curry. First, we use only data from the most recent 50 years (1970-2021), which is the period of most rapid growth in CO2-caused forcing, the period of most rapid temperature rise, and about as far back as one can go and talk with any confidence about ocean heat content (a very important variable in climate sensitivity estimates).
Secondly, our model is time-dependent, with monthly time resolution, allowing us to examine (for instance) the recent acceleration in deep ocean temperature (ocean heat content) rise.
In contrast to Lewis & Curry and differencing two time periods’ averages separated by 100+ years, our approach is to use a time-dependent model of vertical energy flows, which I have blogged on before. It is run at monthly time resolution, so allows examination of such issues as the recent acceleration of the increase in oceanic heat content (OHC).
In response to reviewers comments, I extended the domain from non-ice covered (60N-60S) oceans to global coverage (including land), as well as borehole-based estimates of deep-land warming trends (I believe a first for this kind of work). The model remains a 1D model of temperature departures from assumed energy equilibrium, within three layers, shown schematically in Fig. 1.
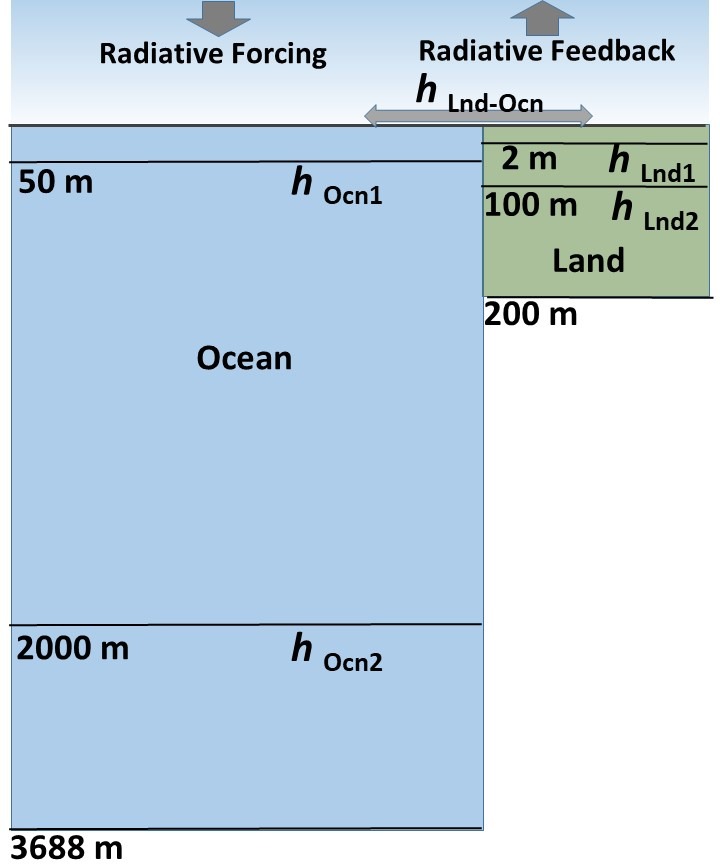
One thing I learned along the way is that, even though borehole temperatures suggest warming extending to almost 200 m depth (the cause of which seems to extent back several centuries), modern Earth System Models (ESMs) have embedded land models that extend to only 10 m depth or so.
Another thing I learned (in the course of responding to reviewers comments) is that the assumed history of radiative forcing has a pretty large effect on diagnosed climate sensitivity. I have been using the RCP6 radiative forcing scenario from the previous (AR5) IPCC report, but in response to reviewers’ suggestions I am now emphasizing the SSP245 scenario from the most recent (AR6) report.
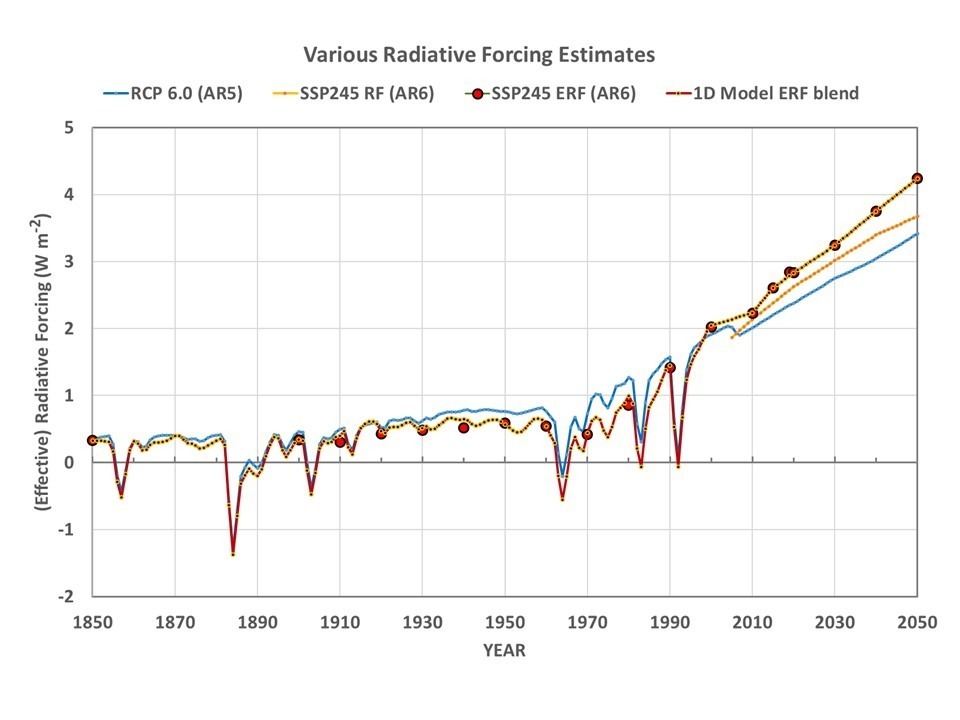
I run all of the model simulations with either one or the other radiative forcing dataset, initialized in 1765 (a common starting point for ESMs). All results below are from the most recent (SSP245) effective radiative forcing scenario preferred by the IPCC (which, it turns out, actually produces lower ECS estimates).
The Model Experiments
In addition to the assumption that the radiative forcing scenarios are a relatively accurate representation of what has been causing climate change since 1765, there is also the assumption that our temperature datasets are sufficiently accurate to compute ECS values.
So, taking those on faith, let’s forge ahead…
I ran the model with thousands of combinations of heat transfer coefficients between model layers and the net feedback parameter (which determines ECS) to get 1970-2021 temperature trends within certain ranges.
For land surface temperature trends I used 5 “different” land datasets: CRUTem5 (+0.277 C/decade), GISS 250 km (+0.306 C/decade), NCDC v3.2.1 (+0.298 C/decade), GHCN/CAMS (+0.348 C/decade), and Berkeley 1 deg. (+0.280 C/decade).
For global average sea surface temperature I used HadCRUT5 (+0.153 C/decade), Cowtan & Way (HadCRUT4, +0.148 C/decade), and Berkeley 1 deg. (+0.162 C/decade).
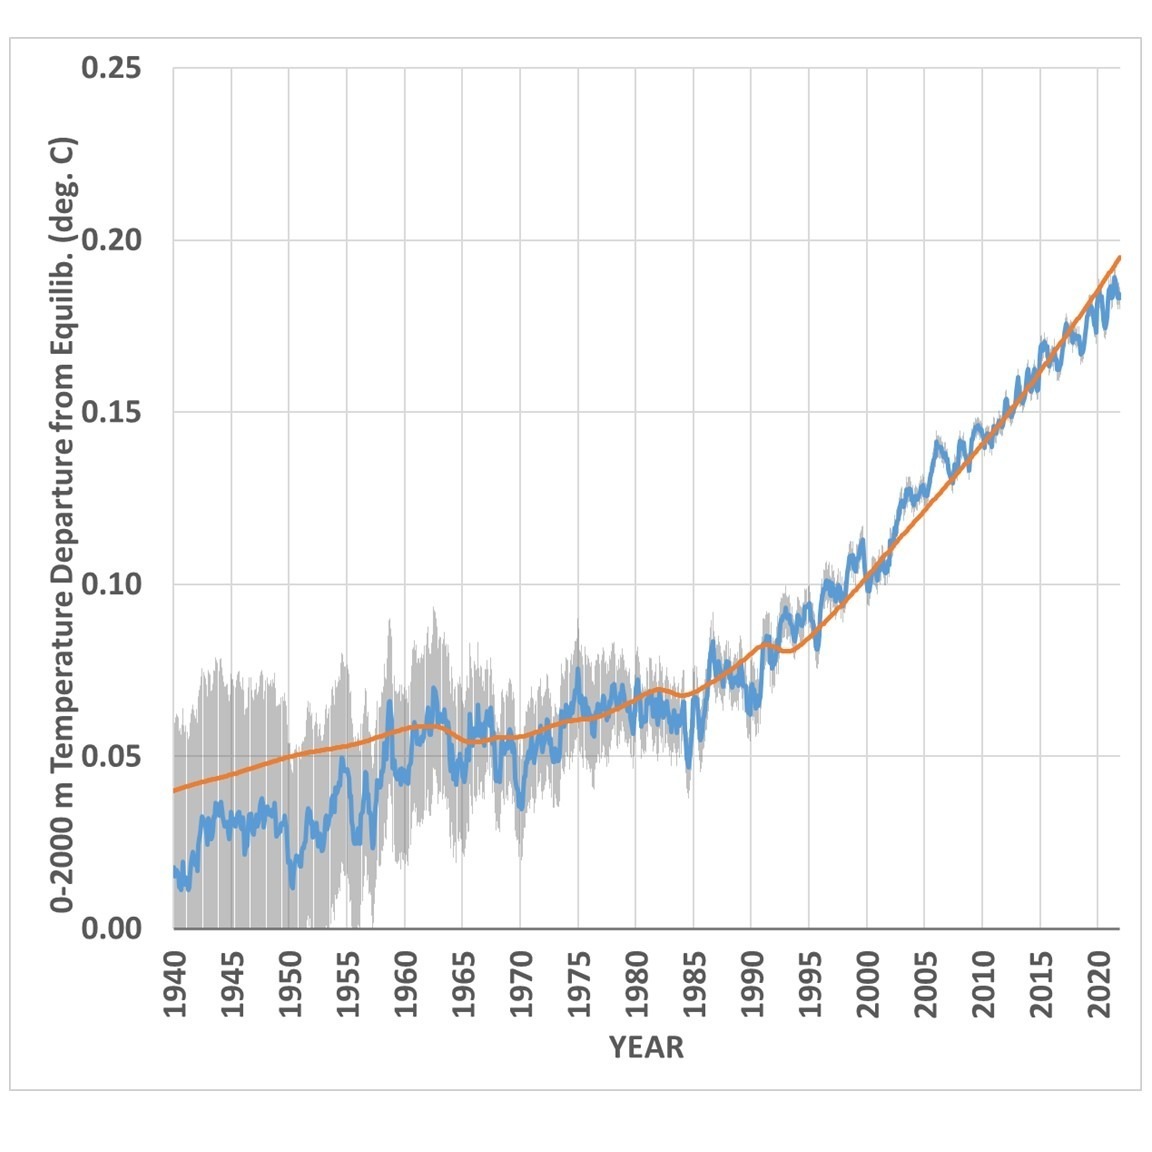
For the deep ocean, I used Cheng et al. 0-2000m global average ocean temperature (+0.0269 C/decade), and Cheng’s estimate of the 2000-3688m deep-deep-ocean warming, which amounts to a (very uncertain) +0.01 total warming over the last 40 years. The model must produce the surface trends within the range represented by those datasets, and produce 0-2000 m trends within +/-20% of the Cheng deep-ocean dataset trends.
Since deep-ocean heat storage is such an important constraint on ECS, in Fig. 3 I show the 1D model run that best fits the 0-2000m temperature trend of +0.0269 C/decade over the period 1970-2021.
Finally, the storage of heat in the land surface is usually ignored in such efforts. As mentioned above, climate models have embedded land surface models that extend to only 10 m depth. Yet, borehole temperature profiles have been analyzed that suggest warming up to 200 m in depth (Fig. 4).
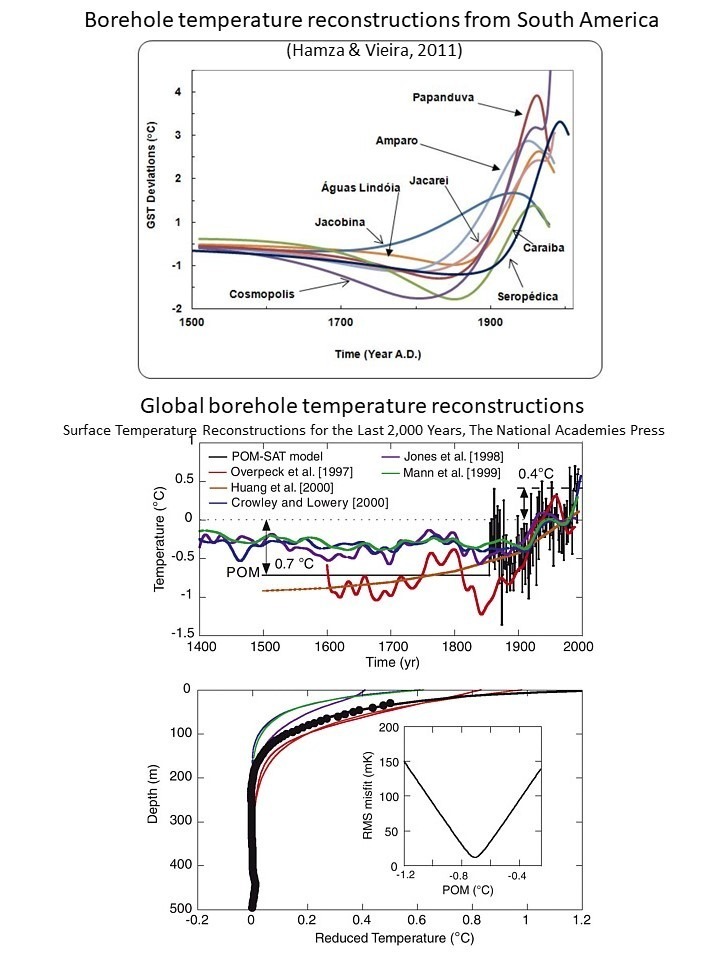
This great depth, in turn, suggests that there has been a multi-century warming trend occurring, even in the early 20th Century, which the IPCC ignores and which suggests a natural source for long-term climate change. Any natural source of warming, if ignored, leads to inflated estimates of ECS and of the importance of increasing CO2 in climate change projections.
I used the black curve (bottom panel of Fig. 4) to estimate that the near-surface layer is warming 2.5 times faster than the 0-100 m layer, and 25 times faster than the 100-200 m layer. In my 1D model simulations, I required this amount of deep-land heat storage (analogous to the deep-ocean heat storage computations, but requiring weaker heat transfer coefficients for land and different volumetric heat capacities).
The distributions of diagnosed ECS values I get over land and ocean are shown in Fig. 5.
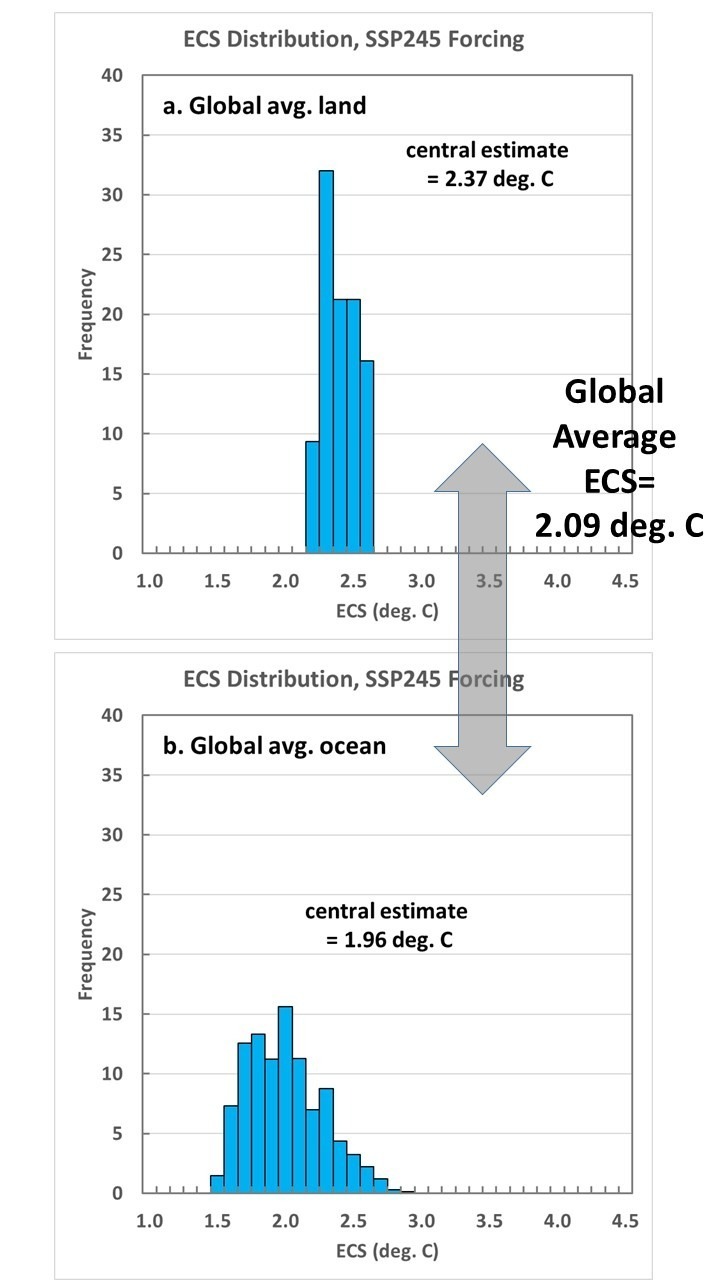
The final, global average ECS from the central estimates in Fig. 5 is 2.09 deg. C. Again, this is somewhat higher than the 1.5 to 1.8 deg. C obtained by Lewis & Curry, but part of this is due to larger estimates of ocean and land heat storage used here, and I would suspect that our use of only the most recent 50 years of data has some impact as well.
Conclusions
I’ve used a 1D time-dependent model of temperature departures from assumed energy equilibrium to address the question: Given the various estimates of surface and sub-surface warming over the last 50 years, what do they suggest for the sensitivity of the climate system to a doubling of atmospheric CO2?
Using the most recent estimates of effective radiative forcing from Annex III in the latest IPCC report (AR6), the observational data suggest lower climate sensitivities (ECS) than promoted by the IPCC with a central estimate of +2.09 deg C. for the global average. This is at the bottom end of the latest IPCC (AR6) likely range of 2.0 to 4.5 deg. C.
I believe this is still likely an upper bound for ECS, for the following reasons.
- Borehole temperatures suggest there has been a long-term warming trend, at least up into the early 20th Century. Ignoring this (whatever its cause) will lead to inflated estimates of ECS.
- I still believe that some portion of the land temperature datasets has been contaminated by long-term increases in Urban Heat Island effects, which are indistinguishable from climatic warming in homogenization schemes.
UAH Global Temperature Update for November, 2022: +0.17 deg. C
Tuesday, December 6th, 2022Sorry for the late posting of the global temperature update, I’ve been busy responding to reviewers of one of our papers for publication.
The Version 6 global average lower tropospheric temperature (LT) anomaly for November 2022 was +0.17 deg. C departure from the 1991-2020 mean. This is down from the October anomaly of +0.32 deg. C
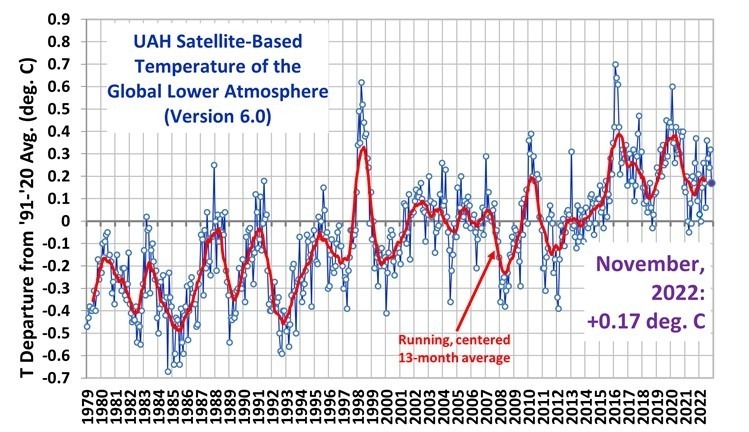
The linear warming trend since January, 1979 now stands at +0.13 C/decade (+0.12 C/decade over the global-averaged oceans, and +0.18 C/decade over global-averaged land).
Various regional LT departures from the 30-year (1991-2020) average for the last 22 months are:
| YEAR | MO | GLOBE | NHEM. | SHEM. | TROPIC | USA48 | ARCTIC | AUST |
| 2021 | Jan | +0.13 | +0.34 | -0.09 | -0.08 | +0.36 | +0.50 | -0.52 |
| 2021 | Feb | +0.20 | +0.32 | +0.08 | -0.14 | -0.65 | +0.07 | -0.27 |
| 2021 | Mar | -0.00 | +0.13 | -0.13 | -0.28 | +0.60 | -0.78 | -0.79 |
| 2021 | Apr | -0.05 | +0.06 | -0.15 | -0.27 | -0.01 | +0.02 | +0.29 |
| 2021 | May | +0.08 | +0.14 | +0.03 | +0.07 | -0.41 | -0.04 | +0.02 |
| 2021 | Jun | -0.01 | +0.31 | -0.32 | -0.14 | +1.44 | +0.64 | -0.76 |
| 2021 | Jul | +0.20 | +0.34 | +0.07 | +0.13 | +0.58 | +0.43 | +0.80 |
| 2021 | Aug | +0.17 | +0.27 | +0.08 | +0.07 | +0.33 | +0.83 | -0.02 |
| 2021 | Sep | +0.26 | +0.19 | +0.33 | +0.09 | +0.67 | +0.02 | +0.37 |
| 2021 | Oct | +0.37 | +0.46 | +0.28 | +0.33 | +0.84 | +0.64 | +0.07 |
| 2021 | Nov | +0.09 | +0.12 | +0.06 | +0.14 | +0.50 | -0.42 | -0.29 |
| 2021 | Dec | +0.21 | +0.27 | +0.15 | +0.04 | +1.63 | +0.01 | -0.06 |
| 2022 | Jan | +0.03 | +0.06 | -0.00 | -0.23 | -0.13 | +0.68 | +0.10 |
| 2022 | Feb | -0.00 | +0.01 | -0.02 | -0.24 | -0.04 | -0.30 | -0.50 |
| 2022 | Mar | +0.15 | +0.27 | +0.02 | -0.07 | +0.22 | +0.74 | +0.02 |
| 2022 | Apr | +0.26 | +0.35 | +0.18 | -0.04 | -0.26 | +0.45 | +0.61 |
| 2022 | May | +0.17 | +0.25 | +0.10 | +0.01 | +0.59 | +0.23 | +0.19 |
| 2022 | Jun | +0.06 | +0.08 | +0.04 | -0.36 | +0.46 | +0.33 | +0.11 |
| 2022 | Jul | +0.36 | +0.37 | +0.35 | +0.13 | +0.84 | +0.56 | +0.65 |
| 2022 | Aug | +0.28 | +0.32 | +0.24 | -0.03 | +0.60 | +0.50 | -0.00 |
| 2022 | Sep | +0.24 | +0.43 | +0.06 | +0.03 | +0.88 | +0.69 | -0.28 |
| 2022 | Oct | +0.32 | +0.43 | +0.21 | +0.04 | +0.16 | +0.93 | +0.04 |
| 2022 | Nov | +0.17 | +0.21 | +0.12 | -0.16 | -0.51 | +0.51 | -0.56 |
The full UAH Global Temperature Report, along with the LT global gridpoint anomaly image for November, 2022 should be available within the next several days here.
The global and regional monthly anomalies for the various atmospheric layers we monitor should be available in the next few days at the following locations:
Lower Troposphere:
http://vortex.nsstc.uah.edu/data/msu/v6.0/tlt/uahncdc_lt_6.0.txt
Mid-Troposphere:
http://vortex.nsstc.uah.edu/data/msu/v6.0/tmt/uahncdc_mt_6.0.txt
Tropopause:
http://vortex.nsstc.uah.edu/data/msu/v6.0/ttp/uahncdc_tp_6.0.txt
Lower Stratosphere:
http://vortex.nsstc.uah.edu/data/msu/v6.0/tls/uahncdc_ls_6.0.txt


