Archive for January, 2017

The Trump Climate Dump: Why It Doesn’t Matter if Even 100% of Scientists Agree on Global Warming

Friday, January 20th, 2017

Given current technologies, it makes no sense to destroy $100 Trillion in wealth this century for an unmeasurable reduction in warming.

Bjorn Lomborg.

Everything humans do requires energy. Everything.

The more efficiently we can do those things, the greater humanity prospers. Affordable energy is part of that efficiency.

But when human prosperity suffers, people die.

So, can it really be called “anti-science” that the moment Trump was inaugurated, the White House deleted all references to climate change on their web pages?

No, I don’t consider it anti-science. Because science has nothing to say about what it would cost in terms of human suffering to avert climate change. What to do about climate change is a matter of engineering and economics… not science.

As a lukewarmist I believe (but can’t prove) that humans are probably responsible for some of the recent warming (which has been mostly benign).

I further believe (but can’t prove) that humans will cause somewhat more warming in the future…. I’d put my best guess at maybe another 1 deg. C this century, based upon our (and others) research into climate sensitivity.

But until some new energy technology comes along (probably from the private sector) we are stuck with fossil fuels for the foreseeable future. The oil industry’s use of fracking has already reduced carbon dioxide emissions — through a switch from coal to natural gas — by more than any government command-and-control efforts.

As Bjorn Lomborg has recently estimated, efforts to “fight” global warming under the U.N.’s Paris Agreement could cost the world $100 Trillion in lost wealth by the end of this century.

That, I guarantee you, will lead to (preventable) deaths, due to poverty and all problems stemming from poverty.

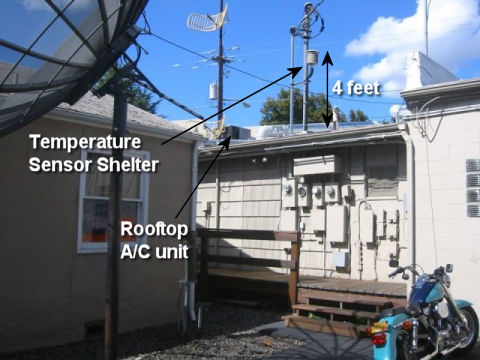
And for what gain? An unmeasurable decrease in further warming of maybe 0.1 deg. C at best (and that’s assuming climate sensitivity is high and that we are in for several deg. C of future warming — which I don’t). As someone who knows how temperatures trends are measured on the ground (I’ll bet none of the thermometer climate data “experts” passed NWS weather observer certification exams like I did) and by satellite (I’m the co-inventor), I can say that this level of future temperature reduction is unmeasurable by any system we have.

So, while the White House deletion of “climate change” references from their website might be met with accusations that the new administration is anti-science, what I suspect it really means is that President Trump does not want to waste time and destroy prosperity just for those who want to feel good about their efforts to Save The World™.

Because the price for them feeling good might well mean the premature deaths of millions.

And that’s the way I would argue this issue. Poverty kills millions. As far as we know, human carbon dioxide emissions have killed no one. In fact, it has saved millions of lives and increased prosperity. For example, I’ve blogged before on the fact that more CO2 has increased corn crop productivity more than rising temperatures have hurt it, and that climate models have badly botched forecast warming post-1960 in the U.S. Corn Belt.

Eventually, we will probably run out of fossil fuels. We will probably have replacements before that ever happens, anyway. Those replacements will arise through market forces, not governmental fiat.

I don’t really care where our energy comes from. As long as those sources benefit humanity.

Trump’s NOAA Administrator Must Address the Temperature Record Controversy

Wednesday, January 18th, 2017

Roseburg, Oregon official USHCN temperature monitoring site shows examples of spurious heat influences that accumulate over the years, spuriously exaggerating the “global warming” signal.

An article appeared in the Washington Post yesterday entitled, “Who Will Lead NOAA Under President Trump?“. Written by the Capitol Weather Gang’s Jason Samenow, it lists three top contenders:

Scott Rayder, senior adviser for development and partnerships at the University Corporation for Atmospheric Research
Barry Myers, chief executive of AccuWeather in State College, Pa.
Jonathan White, president and chief executive of the Consortium for Ocean Leadership

The article addresses important issues facing NOAA in the coming years, such as making our weather forecasting capability the best in the world while still respecting the role of the private sector in adding value to the data collection and modelling role the government has taken leadership in.

Yet, something is missing….

You see, the names mentioned are part of the existing establishment, and we all know that President Trump is interested in “draining the swamp”.

They might be perfectly fine candidates — if Hillary Clinton had won the election.

What is missing is NOAA’s controversial role in promoting the U.N. plan to use global climate change as a way for the U.N. to oversee the redistribution of the world’s wealth and deindustrialize the West. (Note that’s not my claim…it’s their claim). It is well known that most of the countries that signed on to the Paris Agreement did so because they hope to gain from those transfers of wealth.

And we also know the result of CO2 emissions reduction will be a huge amount of pain (up to $100 Trillion loss of wealth this century) for no measurable impact on global temperatures, even using the U.N.’s over-inflated warming predictions.

NOAA has been actively “adjusting” the thermometer record of global temperatures over the years by making the present warmer, and the past colder, leading to an ever increasing upward temperature trend. This supports the global warming narrative the current administration, and the U.N., favors.

In my opinion, NOAA needs leadership that will reexamine these procedures. It took a TV meteorologist, Anthony Watts, to spearhead a site inspection of nearly all of the temperature monitoring locations in the U.S., even forcing NOAA to admit that many of their temperature monitoring stations were simply of no use for monitoring climate trends, when parking lots and air conditioning exhaust fans gradually encroached on these sites, causing spurious warming. Watts’ research has suggested that, after removing the contaminated stations, a substantial fraction of the reported warming in the U.S. simply disappears.

Why did it take an outsider — with no funding — to do what NOAA should have done to begin with?

Yes, providing data and analysis addressing the global warming issue is only one part of NOAA’s responsibility (which includes ocean research as well).

But it is by far the most important part of NOAA’s mission when it comes to the future health of the U.S. economy.

The new NOAA Administrator needs to address this issue head on, and not whitewash it. I seriously doubt any of the three candidates listed above will do that.

Satellite Reveals End of “Unending” N. California Drought

Saturday, January 14th, 2017

With more rain and snow on the way, the supposed “unending drought” that the New York Times reported on last year has, in a matter of weeks, ended — at least in Northern California.

Yesterday’s color satellite imagery from NASA shows the dramatic changes which have occurred since the same date three years ago:

– Widespread and deep snowpack
– Greening vegetation
– Rivers overflowing their banks
– Strong river discharge into the Pacific Ocean

NASA Aqua MODIS color satellite imagery of N. California separated by exactly three years, showing dramatic snowpack increase, vegetation greening, and river discharge into the Pacific Ocean.

Here’s a zoomed version of the NASA Terra MODIS image yesterday covering the San Francisco Bay area northeastward toward Sacramento:

NASA Terra MODIS zoomed image on 13 January 2017 covering San Francisco to Sacramento.

The latest GFS model forecast for the next 10 days predicts another 2 to 10 inches of rain, depending on location, with several more feet of snow at higher elevations.

The Frigid 48: U.S. Average Temperature 11 deg. F

Saturday, January 7th, 2017

As predicted here ten days ago, portions of all of the Lower 48 states are below 32 deg. F at 6 a.m. EST this morning (animation here):

Surface temperature and wind patterns at 6 a.m. January 7, 2017.

The spatial average temperature over the Lower 48 at 6 a.m. is 11 deg. F, which is fully 9 deg. (!) colder than at any time last winter (20 deg. F) which occurred twice in January of 2016.

Global Satellites: 2016 not Statistically Warmer than 1998

Tuesday, January 3rd, 2017

Strong December Cooling Leads to 2016 Being Statistically Indistinguishable from 1998

The Version 6.0 global average lower tropospheric temperature (LT) anomaly for December 2016 was +0.24 deg. C, down substantially from the November value of +0.45 deg. C (click for full size version):

The resulting 2016 annual average global temperature anomaly is +0.50 deg. C, which is (a statistically insignificant) 0.02 deg. C warmer than 1998 at +0.48 deg. C. We estimate that 2016 would have had to be 0.10 C warmer than 1998 to be significantly different at the 95% confidence level. Both 2016 and 1998 were strong El Nino years.

The 38 years in the satellite record, ranked from warmest to coolest (and ignoring statistical uncertainty) are:

RANK YEAR deg.C.
01 2016 +0.50
02 1998 +0.48
03 2010 +0.34
04 2015 +0.26
05 2002 +0.22
06 2005 +0.20
07 2003 +0.19
08 2014 +0.18
09 2007 +0.16
10 2013 +0.13
11 2001 +0.12
12 2006 +0.11
13 2009 +0.10
14 2004 +0.08
15 1995 +0.07
16 2012 +0.06
17 1987 +0.05
18 1988 +0.04
19 2011 +0.02
20 1991 +0.02
21 1990 +0.01
22 1997 -0.01
23 1996 -0.01
24 1999 -0.02
25 2000 -0.02
26 1983 -0.04
27 1980 -0.04
28 1994 -0.06
29 2008 -0.10
30 1981 -0.11
31 1993 -0.20
32 1989 -0.21
33 1979 -0.21
34 1986 -0.22
35 1984 -0.24
36 1992 -0.28
37 1982 -0.30
38 1985 -0.36

The global, hemispheric, and tropical LT anomalies from the 30-year (1981-2010) average for the last 24 months are:

YEAR MO GLOBE NHEM. SHEM. TROPICS
2015 01 +0.30 +0.44 +0.15 +0.13
2015 02 +0.19 +0.34 +0.04 -0.07
2015 03 +0.18 +0.28 +0.07 +0.04
2015 04 +0.09 +0.19 -0.01 +0.08
2015 05 +0.27 +0.34 +0.20 +0.27
2015 06 +0.31 +0.38 +0.25 +0.46
2015 07 +0.16 +0.29 +0.03 +0.48
2015 08 +0.25 +0.20 +0.30 +0.53
2015 09 +0.23 +0.30 +0.16 +0.55
2015 10 +0.41 +0.63 +0.20 +0.53
2015 11 +0.33 +0.44 +0.22 +0.52
2015 12 +0.45 +0.53 +0.37 +0.61
2016 01 +0.54 +0.69 +0.39 +0.84
2016 02 +0.83 +1.16 +0.50 +0.99
2016 03 +0.73 +0.94 +0.52 +1.09
2016 04 +0.71 +0.85 +0.58 +0.93
2016 05 +0.54 +0.65 +0.44 +0.71
2016 06 +0.34 +0.51 +0.17 +0.37
2016 07 +0.39 +0.48 +0.30 +0.48
2016 08 +0.43 +0.55 +0.32 +0.49
2016 09 +0.44 +0.49 +0.39 +0.37
2016 10 +0.41 +0.42 +0.39 +0.46
2016 11 +0.45 +0.41 +0.50 +0.37
2016 12 +0.24 +0.19 +0.30 +0.21

The UAH global image for December, 2016 (and annual image for 2016) should be available in the next several days here.

The new Version 6 files should be updated soon, and are located here:

Lower Troposphere: http://vortex.nsstc.uah.edu/data/msu/v6.0/tlt/uahncdc_lt_6.0.txt
Mid-Troposphere: http://vortex.nsstc.uah.edu/data/msu/v6.0/tmt/uahncdc_mt_6.0.txt
Tropopause: http://vortex.nsstc.uah.edu/data/msu/v6.0/ttp/uahncdc_tp_6.0.txt
Lower Stratosphere: http://vortex.nsstc.uah.edu/data/msu/v6.0/tls/uahncdc_ls_6.0.txt

Cold to be Followed by Southern Snowstorm

Monday, January 2nd, 2017

The coast-to-coast cold that will be spreading across the U.S this week will be be accompanied by the development of a Gulf Coast low pressure center that will threaten the South and Southeast with substantial snowfall by the weekend.

The low is just now approaching N. California and will intensify as it travels across the Inter-mountain region, the Texas panhandle, then travel eastward along the Gulf coast by the weekend.

The latest GFS model forecast total snowfall by midday Sunday shows the possibility of 6-12 inch snowfalls across portions of about ten southern states, including Oklahoma, Missouri, Arkansas, Tennessee, Mississippi, Alabama, Georgia, the Carolinas, and Virginia (graphic courtesy of Weatherbell.com):

Total snowfall accumulation by midday Sunday, Jan. 8, 2017 as forecast by the NWS GFS forecast model.

It’s still too early to tell what areas will get the greatest snowfall, which in the current forecast approaches two feet in the higher elevations of North Carolina. It’s also possible that a wintry mix including freezing rain will exist along the southern edge of the frozen precipitation region.

UPDATE:
As of Tuesday morning (Jan. 3, 2017), the snow path looks like it will be farther south than depicted above, with lesser snow totals: 6-12 inches only over eastern N. Carolina, and up to 3 to 6 inches elsewhere.