
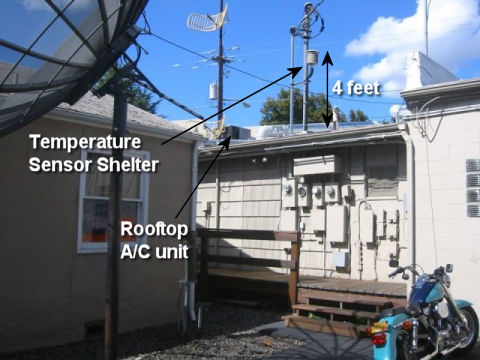
Roseburg, Oregon official USHCN temperature monitoring site shows examples of spurious heat influences that accumulate over the years, spuriously exaggerating the “global warming” signal.
An article appeared in the Washington Post yesterday entitled, “Who Will Lead NOAA Under President Trump?“. Written by the Capitol Weather Gang’s Jason Samenow, it lists three top contenders:
Scott Rayder, senior adviser for development and partnerships at the University Corporation for Atmospheric Research
Barry Myers, chief executive of AccuWeather in State College, Pa.
Jonathan White, president and chief executive of the Consortium for Ocean Leadership
The article addresses important issues facing NOAA in the coming years, such as making our weather forecasting capability the best in the world while still respecting the role of the private sector in adding value to the data collection and modelling role the government has taken leadership in.
Yet, something is missing….
You see, the names mentioned are part of the existing establishment, and we all know that President Trump is interested in “draining the swamp”.
They might be perfectly fine candidates — if Hillary Clinton had won the election.
What is missing is NOAA’s controversial role in promoting the U.N. plan to use global climate change as a way for the U.N. to oversee the redistribution of the world’s wealth and deindustrialize the West. (Note that’s not my claim…it’s their claim). It is well known that most of the countries that signed on to the Paris Agreement did so because they hope to gain from those transfers of wealth.
And we also know the result of CO2 emissions reduction will be a huge amount of pain (up to $100 Trillion loss of wealth this century) for no measurable impact on global temperatures, even using the U.N.’s over-inflated warming predictions.
NOAA has been actively “adjusting” the thermometer record of global temperatures over the years by making the present warmer, and the past colder, leading to an ever increasing upward temperature trend. This supports the global warming narrative the current administration, and the U.N., favors.
In my opinion, NOAA needs leadership that will reexamine these procedures. It took a TV meteorologist, Anthony Watts, to spearhead a site inspection of nearly all of the temperature monitoring locations in the U.S., even forcing NOAA to admit that many of their temperature monitoring stations were simply of no use for monitoring climate trends, when parking lots and air conditioning exhaust fans gradually encroached on these sites, causing spurious warming. Watts’ research has suggested that, after removing the contaminated stations, a substantial fraction of the reported warming in the U.S. simply disappears.
Why did it take an outsider — with no funding — to do what NOAA should have done to begin with?
Yes, providing data and analysis addressing the global warming issue is only one part of NOAA’s responsibility (which includes ocean research as well).
But it is by far the most important part of NOAA’s mission when it comes to the future health of the U.S. economy.
The new NOAA Administrator needs to address this issue head on, and not whitewash it. I seriously doubt any of the three candidates listed above will do that.
They are scared to mention non-establishment, independent and great minds like John Christy.
Thanks Roy, very much.
Anthony
Thanks to both of you for all that you do!
So are you disputing the published work of skeptic Judith Curry showing that the UHI effect is not significant?
http://static.berkeleyearth.org/papers/UHI-GIGS-1-104.pdf
I’ll take this one step at a time:
1) It is easy to show that, on most days, urban areas are warmer than rural. I’ve done it, others have done it, you can see it on your car thermometer.
2) But HOW have rural areas warmed versus urban over, say, 50 years? You might think urban areas should warm faster. NO. Measurements have shown that rural areas warm the fastest as natural vegetation is replaced by houses, pavement, heat sources, etc.
3) As a result of (2), you can do what Curry and co-authors did and find that there is little difference in warming trend between urban and rural stations. But this does NOT mean that both locations didn’t have spurious warming. Because of the nonlinearity involved in, say, population density and temperature.
4) Their study used MODIS satellite data to classify thermometer siting, which has, at best 250 meter spatial resolution. It is no good to pick up local siting effects…outbuildings, a parking lot, a nearby air conditioner. That’s why Watt’s actual site surveys with photography are so valuable.
So, I suppose, yes, I am disputing your interpretation of that published work in the context of whether the surface temperature record has spurious warming effects.
‘find that there is little difference in warming trend between urban and rural stations’.
If rural and urban the same than what else have you got?
So the errors produced by using a satellite with lower resolution produce systematic errors in one direction? Really?
Nate – instead of searching for things to dispute, try reading for comprehension first. The answers to your questions are contained within the preceding comment.
NO, micro-siting – whether a station is near buildings, parking lots, air-conditioners etc. Urban vs rural comparisons do not account for this. Anthony Watt’s analysis does and it shows drastic differences in warming among stations with poor siting and those with good.
Fine, if Watts analysis is good then he needs to let others see the data and analysis, i.e. publish it. Otherwise it will not have much impact on climate science.
We will publish. It’s taken a lot of time. We understand that until we can be checked out you have only our word to go on. Which obviously won’t do for a bottom line in science.
But we will release all data and methods for purposes of replication (and, we would hope, an expansion of our efforts).
Absolute rotted science you are presenting!
@Ross Brisbane: Your comment neither is constructive, nor is it rebuttal. Dr. Spencer’s support of Watt’s research employing the early stages of the scientific method (systematic observation, measurement, and experiment, and the formulation, testing, and modification of hypotheses,) is the essence of science. Rather than being a simple contrarian, it would serve us all better if you would offer scientific rebuttal instead.
Disjointed western factoids:
East central California San Joaquin Valley temperatures are definitely cooler than in Fresno, 30 miles SE, usually by 5 to 10 degrees F, summer and winter.
Roughly 12 years ago, the weather service temperature measures were moved from the SW side of Fresno Airport to about 20 miles SE, near a smaller city; warmer by being more southerly, cooler by being less urban. ???
The San Joaquin Valley was originally grassland and over a 150 years gradually became ever more tilled, first to annual crops and then to ever more to permanent crops — mostly meaning almonds, pistachios and grapes now; i.e. ever more exposed soil, ever more twigs instead of grasses. All the while, ever more water was applied to those soils resulting in ever more transpiration and evaporation. We’re talking a huge area with huge changes.
Ever more, our infamous ‘inversion’ layer can be visually observed as an indistinct and uneven smoky layer at about 1500 to 2500 feet during calm weather, spring, especially summer, and fall. Whether it’s heat trapping or shading I can’t begin to guess, but the source of is likely the Bay Area or maybe even China contributes.
For this same huge geographic area and for hundreds of miles downwind, how can anybody assert with honesty and integrity any particular reason for any measured climate change as measured here?
Nate…”So are you disputing the published work of skeptic Judith Curry showing that the UHI effect is not significant?”
Enough of your trolling. Judith Curry has condemned the final version of the BEST study claiming it was altered by Muller.
Here’s an article on Dr. Curry with revelations of the idiot Michael Mann and his thug techniques in trying to eliminate skeptics.
http://www.steynonline.com/7661/the-craziness-of-the-climate-science-echo-chamber
The other idiot, Tamino, refers to her as Aunt Judy.
UHI effects are discussed and quantified by the media, i.e. The Weather Channel, on the order of up to 4 degrees Celsius. Gradeschool children are taught and can understand the REALITY that the thermal mass of concrete and asphalt – along with A/C and heating exhaust – contribute greatly to an UHI effect.
What nescient conclusion(s) are you trying to claim?
AZ Read the paper yourself, it is not me making the claim. But I think the point is not the temperature being warmer in city, but what is the TREND in temperature. Is it significantly altered?
Geez.
Of course it is. And the neat thing is it is very very difficult to find uncontaminated temp data as people tend to measure temps where they prosper – cut grass, fell trees, pave, build AC.
Data homogenization corrects for UHIs.
No, it attempts to correct, and the error bars become large.
How large are the error bars, specifically?
Larger than the “corrections”.
If you do not know, you should not be staking so much on the outcome.
So some claim. I have some doubts on a method that offers so much opportunity to tune results using an opaque machinery.
I’m waiting for wild bananas appearing at Nuuk as promised.
Not.
Anthony,
Is this work published? If not why not?
Nate…”Is this work published? If not why not?”
Where in the scientific method does it say work has to be published in a journal or peer reviewed? In this day and age, a scientists can merely publish on the Net.
Linus Pauling, a far greater scientist than most will ever be, once claimed with respect to a double-blind study, ‘why is one necessary when the outcome is obvious’?
Some scientists can see what is obvious without resorting to convoluted processes in which papers get rejected by idiots who don’t understand the science.
So are saying that sci method as practiced in the last 100 years hasnt been extremely successful? I would say it has. Peer review has been an essential part of that enterprise.
Nate get a life. Papers contain outright fabrications, lies and spins. Success, yes, but not in climate prediction.
Nate-
i’ll help you-
http://www.wmo.int/pages/prog/wcp/ccl/guide/documents/english/WMO_100_en-chap2.pdf
See here for publications.
Nope, still nothing published on UHI
Funny how you can’t find anything when you don’t look for it. The GAO report considers siting issues.
Ok, yes. I missed that one.
Correct me if im wrong: is it saying there is no effect of siting on the average temp trends? Is an effect on diurnal range?
Nate,
if you care to look for it the WMO carefully explain the unreliability of Urban temps.
Nate-
Maybe to help you on your journey of discovery-
WMO- “The nature of urban environments makes it impossible to conform to the standard guidance for site
selection and exposure of instrumentation required
for establishing a homogeneous record that can be
used to describe the larger-scale climate”
See also: https://pielkeclimatesci.files.wordpress.com/2011/07/r-367.pdf
Come on, Roy. This HAS been address nine ways to Sunday. And then some.
are you implying there is no controversy, and that each new NOAA adjustment gets us closer to the truth? Or are you saying we already know the NOAA adjustments have proven to be in error?
Your statement is ambiguous…
Given that Watts hasn’t got around to publishing or even releasing his data and all we have is studies generally supporting NOAA’s adjustments the evidence would suggest that NOAA is more likely getting closer to the truth than the opposite.
oh, you have no clue how much pushback there has been in peer review…anything skeptical or damaging to the status quo has a tough row to hoe. He has presented at the AGU, and has PhD credentialed co-authors. It’s been done is spare time because you can’t get the government to fund work that casts doubt on government results.
If you think peer review isn’t corrupted on policy-relevant science, go back and review the Climategate emails.
‘If you think peer review isnt corrupted on policy-relevant science, go back and review the Climategate emails’
Your papers get published. Judith Curry gets published (even when she finds low climate sensitivity). Other papers with low climate sensitivity have been published. So whats the problem?
As you know, or should know, the Climategate conspiracy theory has been debunked numerous times.
Why do you try to agitate the conspiracy minded nuts that visit here with information that has been debunked or is very misleading?
Nate…”Your papers get published”.
You’re not only an idiot, you’re a naive idiot.
In the Climategate emails, Coordinating Lead Author, Phil Jones, bragged that he and Kevin (presumably Trenberth) would see to it that certain papers would not reach the IPCC review process. One of those papers discussed was by Dr. John Christy of UAH.
Trenberth was involved in a peer review incident in which Trenberth’s interference forced an editor to resign. In the Climategate emails, Michael Mann is revealed to be actively campaigning for interference in the peer review process. He has actively insulted Dr. Judith Curry.
Richard Lindzen has complained of his papers being delayed and when he inquired the journal editor said it was due to his skepticism.
Ad hom attack. This ought to get gordon banned , but it likely wont.
There have 9 separate ethics inquiries of climategate. This has priven to be another manufactured controversy.
Nate, the Climategate issues have not been debunked. Judith Curry decried how bad scientists — on her side — behaved badly and how any thinking person could see those faux investigations as anything but pre-determined whitewashes. Faux investigations do not debunk issues.
Roy, your papers have been handled just like all other papers — read, studied, and analyzed. Problems have been pointed out where other scientists thought there were problems.
No reason for you to whine about it.
You did, however, try to sneak a paper past an editor in a journal. He was so disheartened by that maneuver, he resigned. That almost never happens — last time was. I think, Soon and Baliunas.
I don’t see any evidence at all that you have been treated unfairly. Just because you are criticized doesn’t make it unfair. And you should stop implying that.
And I’m not even bringing up the sign-error episode.
FAKE out of context quote mining. Bu*****t! Anyone with half a proper enquiring brain would NOT buy into this – it highlights your own intransigence and stubbornness. “FAKE NEWS / WITCH HUNT”
Roy, you are overtaken with hubris and your political ideology is blinding you. Communicate, spend time with your fellow “fraudsters” – your fellow professionals that you castigate and criticise by BACK stabbing continuously on your tiny blog.
Get out outside of your comfort zone and might I say your rejection & BITTERNESS disorder. You are so so wrong – so shockingly terribly wrong about climate science proper. May God help you.
Why don’t you go outback and drink a cup of urine?
MarkB…”the evidence would suggest that NOAA is more likely getting closer to the truth than the opposite”.
Try opening your eyes. Here is a link to NOAA’s practices which are no longer available on the NOAA site due to Obama admin’s interference.
It reveals how NOAA has slashed surface stations and synthesized the missing temperatures using a climate model.
https://web.archive.org/web/20130201082455/http://www.noaa.gov/features/02_monitoring/weather_stations.html
Here’s an in-depth site devoted to NOAA corruption. It reveals all their tampering with surface stations.
https://chiefio.wordpress.com/gistemp/
Gordon,
Youve repeatedly shown extreme resitance to common sense, logic, basic science facts, many other facts. You have lost all credibility.
Gordon,
You have lost all credibility.
Nate, by the way, Anthony Watts was published. It is not impossible for skeptics to get published . . . it just that it takes longer, the papers must achieve levels not expected of Michael Mann, etc., and the hurdles mean that many papers do not get through. Not a conspiracy theory, but rather facts that are documented, experienced, and acknowledged.
Roy, you’re being disingenuous here.
You’re using an image related to station siting issues. And that has been looked at up and down. Remove the poorly sited stations, same results.
I would suggest that, yes, the scientists involved in creating these data sets are doing their best to produce the most accurate data they possibly can. You’ve surely read the published research as each one of the new adjustments comes out. You’ve read Karl et al. You certainly must have read Hausfather et al that just came out. I know you read Mears paper last year.
And you default to materials from Lomborg with completely absurd claims unsupported by published research?
Articles like this only cause me to question your sincerity at getting to the actual truth.
NO. Remove the poorly sited stations, and you get DIFFERENT results. That’s what Watts and co-authors clearly showed. No one has done a more thorough analysis.
So, YOUR comment causes me to question YOUR sincerity at getting to the actual truth.
If you don’t like my analysis of what I’ve experienced in and out of government service for the last 25 years, maybe the HuffPo analysis of climate issues would be more to your liking.
Roy,
Rob Honeycutt is on the “Skeptical Science” website team. I find it ironic that Rob complains about being “disingenuous” when he was involved in one of the worst climate papers published, “Quantifying the consensus on anthropogenic global warming in the scientific literature”
The paper was an exercise in subterfuge and data torture. The SkS team had to combine three rating categories to come up with the phony 97% consensus. And the funny thing is, by their own definition of consensus, the true consensus per their own data was only 2.5%. So you have to take what Rob says with a grain of salt.
Rob Honeycutt says: “the scientists involved in creating these data sets are doing their best to produce the most accurate data they possibly can.”
ME— Do you mean like this from the climategate emails:
27 Sep 2009: So, if we could reduce the ocean blip by, say, 0.15 degC, then this would be significant for the global mean — but we’d still have to explain the land blip.
I’ve chosen 0.15 here deliberately. This still leaves an ocean blip, and i think one needs to have some form of ocean blip to explain the land blip (via either some common forcing, or ocean forcing land, or vice versa, or all of these). When you look at other blips, the land blips are
1.5 to 2 times (roughly) the ocean blips — higher sensitivity plus thermal inertia effects. My 0.15 adjustment leaves things consistent with this, so you can see where I am coming from. (1254108338.txt)
Ok, out of context as usual, no way of knowing what this is about
Nate, it IA NOT OUT OF CONTEXT and if you want to see the context google the email number that I included at the end.
Why do you keep trying to support Al Gore’s climate scam?
OK, for grins I looked it up, and of course, it is taken out of context.
It is part of a larger discussion of how to do analysis of the ocean data, lots of SCIENCE issues discussed and how others are doing it.
The ‘problem’ they are discussing is still a problem, that is a large and quick rise and fall of ocean temp in 1940s. This ‘blip’ is still in there so they certainly did not remove it. You can google this yourself and see that there were WWII related CHANGES in ocean measurements-the question was/is how to adjust for those. It seems most experts dont think the ‘blip’ is all real since land temps dont respond as expected.
Roy also says NOAA adjustements: ‘ leading to an ever increasing upward temperature trend. This supports the global warming narrative the current administration, and the U.N., favors’
This is clearly false. The Karl adjustment made the 40 y trends LOWER.
If anyone, Roy included, has a specific critique of how the NOAA adjustments have been done wrong, I havent seen it. The paper is published for all to see.
Look, the only evidence that people have is that they don’t like the result.
It is the same with UAH 6 adjustment where the recent trend vanished. Some may not like the result, but there is no evidence of wrong doing. Should there be an investigation?
Bad blunder by Roy. NOAA’s adjustements REDUCE the long-term warming trend.
See page 7 here:
https://www.nasa.gov/sites/default/files/atoms/files/noaa-nasa_global_analysis-2016.pdf
@DavidAppell: It depends upon where and how one draws a trend line. Starting at 1945, there’s little change between unadjusted and adjusted temps with the adjusted being occasionally, slightly warmer. With pre-1945 being adjusted significantly warmer, the overall linear trend (1880-2016) would be slightly less inclined, but a polynomial trend line (or running average/mean) would largely be unaffected. TJMO,ICBW.
“NOAA has been actively adjusting the thermometer record of global temperatures over the years by making the present warmer, and the past colder”
If you look at the actual paper, the 1880-1940 period comes out significantly WARMER after their adjustments.
So your statement is false.
http://science.sciencemag.org/content/early/2015/06/05/science.aaa5632
http://science.sciencemag.org/content/early/2015/06/05/science.aaa5632 is not accessible for free to the general public.
Go to your local library.
https://www.theguardian.com/environment/climate-consensus-97-per-cent/2016/feb/08/no-climate-conspiracy-noaa-temperature-adjustments-bring-data-closer-to-pristine
also here
I had a look at the graph comparing raw vs. adjusted global temperatures according to NOAA: The adjustments make the reported temperature less warming and mostly more steady before the late 1960s, more warming after the late 1960s, and the warming rate after the early 1980s steadier as in “pause busting”.
Elsewhere, this article seems to say that adjustments don’t contaminate things much by citing specifics that are limited to US land after the US Climate Reference Network began providing a usable amount of data in 2004.
“If you look at the actual paper, the 1880-1940 period comes out significantly WARMER after their adjustments.”
You are looking at applications of specific adjustments, not the entire adjustment record.
I have made several attempts to link to a plot of NOAA’s adjustment series at Bob Tisdale’s blog, but the comment filter won’t let it through. Go search for it. It very clearly shows adjustments favoring past cooling and recent warming.
Here is a page about the NOAA “adjustments”:
http://www.debunkingclimate.com/data_adjustments.html
The original paper contains the same graph as the Guardian article. What is shown are the Total Adjustments, which makes 1880-1940 period warmer.
The effect of only the NEW adjustments of the paper is mainly to produce a SMALL U shaped adjustment of the period after 1980. Both the 80s and the 2010s are made warmer. The resulting trend since 1970s is LOWER.
Here are the key graphs from the paper:
http://tinyurl.com/hu2bpu4
Caption reads:
Fig. 2
Global (land and ocean) surface temperature anomaly time series with new analysis, old analysis, and with and without time-dependent bias corrections.
(A) The new analysis (solid black) compared with the old analysis (red). (B) The new analysis (solid black) versus no corrections for time-dependent biases (blue).
Nate, no matter how much hand waving you do, the adjustments still are the cause of most/all warming. The actual readings show little/no warming – only after “adjustments” does warming appear.
Jim. Not sure where u get this idea.
That is clearly false. There are least 6 different groups from all over the world analyzing, ‘adjusting’, the data in different ways. The results are only slightly different. All show the clear warming trend with very similar slope, .17 C/decade.
@Nate: “1880-1940 period comes out…WARMER” is a bit of a “duh” observation given the starting year of 1880 which coincidentally is the end of what’s common’y called the Little Ice Age–roughly 1400-1870. It’s arguable that what appears to be a warming trend simply is a return to pre-LIA temperature profiles.
I dont understand your comment. The discussion was about adjustments to the record. These adjustments have made 1880-1940 warmer than the raw data.
I offer my apology. I skimmed a bit an improperly assumed your comment was stand-alone rather than in response to the NOAA adjustments.
Adjustments are a tricky practice depending upon what’s considered reference and what considered aberrant. The NOAA adjustments could be a way either to justify the current temperatures as accurate, and pre-45 were inaccurate; or, if the pre-45 values were accurate, then post-45 would be adjusted lower–such is the nature of so-called normalization by “homogenization”.
Roy, it would be great if we could see the effects of their adjustments over time; do you have the record of the changes they made? That would be significant as a starting point, before we start the argument over details.
How about a plot of the changes UAH has made over the years?
There has been way too much hype about catastrophic changes attributed to humans. This has been the guilt-trip put on the developed world to justify a UN based raid on wealth to be transferred to others (after taking a big chunk for the UN).
New leaders should acknowledge this “force/farce”, repudiate it, and get on with serious activities.
As an average everyday American I really don’t give a damn if the temp is going up or if we’re headed for another ice age. I do want the truth though. What ever it is we can handle it. This is all I as from this new administration.
And how do you personally determine what is the “truth” and what is not?
Do you have the data about adjustments NOAA made on temperature record over say last 10 years. I am not arguing for or against, I would just like to see what they have done and what effects that had on the relative warmth or present versus say 1930/1940s …
They’ve published it multiple times (see Karl et al Science 2015), and yet again at a press conference yesterday. See page 7:
https://www.nasa.gov/sites/default/files/atoms/files/noaa-nasa_global_analysis-2016.pdf
Anyone who cares to can go to the UN website and read some of their initiatives to find out their goal is to take over as the governing body of the world. However, a little more checking will show how poorly the UN is running their own programs as it stands now. Climate change is simply a means to an end – scare people enough and they’ll hand over control to anyone who SAYS they can fix it.
“Anyone who cares to can go to the UN website and read some of their initiatives to find out their goal is to take over as the governing body of the world.”
That’s a big statement. Some citations please.
spalding…” Some citations please.”.
He said, ‘Anyone who cares to go to the UN website…’.
Celeste is making the claim. Let her cite specific language. I don’t research other people’s claims
Some of you alarmists must be pretty credulous when it comes to the reason why the UN is so interested in “human caused climate change”. We in Aussie are pretty much up with its “sincerity”. Have a gander at this UN lady’s spin on climate change. Incidentally she is also into a bit of Pagan weather god worship but then that’s quite common amongst many in the alarmist sect:
Economic Systems: The alarmists keep telling us their concern about global warming is all about man’s stewardship of the environment. But we know that’s not true. A United Nations official has now confirmed this.
At a news conference last week in Brussels, Christiana Figueres, executive secretary of U.N.’s Framework Convention on Climate Change, admitted that the goal of environmental activists is not to save the world from ecological calamity but to destroy capitalism.
“This is the first time in the history of mankind that we are setting ourselves the task of intentionally, within a defined period of time, to change the economic development model that has been reigning for at least 150 years, since the Industrial Revolution,” she said.
Referring to a new international treaty environmentalists hope will be adopted at the Paris climate change conference later this year, she added: “This is probably the most difficult task we have ever given ourselves, which is to intentionally transform the economic development model for the first time in human history.”
http://www.investors.com/politics/editorials/climate-change-scare-tool-to-destroy-capitalism/
I’m aware what Christiana Figueres said. She’s a UN functionary but she’s commenting on the views of some environmentalists (and probably her own view) and not on UN’s purported desire to take over the world.
Celeste’s claim, I repeat, is that UN’s website supports their desire “to take over as the governing body of the world” – pretty heady stuff if true.
If Celeste wants to admit that she gilded the lily a little bit, then that would put my mind at ease. But if the UN wants to take over the world then I would like to know where that appears on UN’s website. Others would like to know this too, I would think.
Is it the heat that’s addling brains?
Watts research suggests no such thing that I can see from his poster. He’s not published it – four years later.
To all but accuse NOAA of fraud takes some cheek. I’d be paying more attention to the UAH data and asking serious questions about why it’s out of whack with every other data set around, as some people are doing (again!)
UAH and RSS have given virtually the same (satellite-based) answer for many years. Radiosonde data supports both UAH and RSS. So, its the thermometer data (1 out of 3 measurement systems) that is the “odd man out”. Where do you get your talking points from?
Dr Spencer, radiosonde data does not support UAH v6 TLT or RSS 3.3 TLT in the AMSU-era.
Have your new dataset really been properly validated? Like this:
http://postmyimage.com/img2/732_image.png
RSS 3.3 TLT has been proven unreliable due to drifts by its producers, so it can’t validate UAH v6.
Are you aware of any troposphere temperature product or proxy, that can be compared with UAH 6 without showing a significant breakpoint at the MSU/AMSU-transition?
Please show me one…
Olof R…”Dr Spencer, radiosonde data does not support UAH v6 TLT or RSS 3.3 TLT in the AMSU-era”.
As far as I know, UAH has never claimed that every radiosonde supports every satellite data set. Roy did not imply that. He said ‘Radiosonde data supports both UAH and RSS’.
You don’t expect every weather balloon flown at any point of the planet to correspond exactly do you?
Gordon Robertsson,
There is no radiosonde dataset supporting UAH 6 or RSS 3.3, not even the coolest ones like RAOBCORE or “unadjusted” Ratpac B.
So I just wonder, where is the support?
The AMSU-era trend in v6 TLT is so low that it actually demonstrates a hotspot in the tropics (and globally). The trend in the upper troposphere (TUT=1.4*TTP-0.4*TLS) is more than twice as high:
http://postmyimage.com/img2/441_UAH_hotspot.png
I assume you know there are several radiosonde datasets, differing mostly in in how they handle changes in sensors. We usually average all of them together for the purposes of comparison.
In the case of the one you have chosen, we believe there are two main reasons for the breakpoint you mention:
(1) comparison of 850-300 vs. true LT weighting function… lazy people compare the satellite measurements to the 850-300 mb layer…they are not the same. It’s a little apples-vs-oranges.
(2) RATPAC-A changed their adjustment procedure from a careful, human intervention process to an automated, first-difference method in 1996 – right where you see the shift in differences. This new method adds warming that is not there, or misses corrections for shifts to warmer sondes.
You can replace Ratpac A with any other radiosonde dataset but the breakpoint will not go away.
1) Did You really miss that the chart had an apples to apples comparison, subsampled UAH vs TLT weighted Ratpac (blue graph). It makes no difference..
2) The first difference method may cause some random walks at each metadata breakpoint/cut but random walks are random, they go equally in both directions. The alternative, to let the inhomogeneities be, cause much larger walks but systematically biased. The most common change in new sondes is that they are less sensitive to solar heating, which gives a cool bias if not adjusted for.
Also, Ratpac A is corroborated by other adjusted datasets, here is an average of four, which actually diverge more from UAH than Ratpac A alone:
http://postmyimage.com/img2/334_image.png
And again, UAH v6 is the coolest AMSU-era dataset in the troposphere. Which other dataset corroborates it? RSS 3.3 doesn’t count…
Olof R,
So when you can no longer defend the RATPAC-A dataset against reality at WUWT with anything but your regular handwaving, you simply go underground to pop up somewhere else, so that you can start all over with your baseless assertions, as if that other discussion you just ran away from had never even occurred. This is a recurring pattern with you, Olof.
That’s all right, though. There’s no problem bringing the other discussion in question over here. You’ll get all the information you need to realise you’re wrong.
There’s no escaping the data …
Hi Kristian..
You have still not proven anything anywhere, just spammed the discussion with poor and irrelevant walls of text and charts..
Anyway, I would be happy if UAH TLT could compare with unadjusted Ratpac B in the AMSU-era, but it can’t:
http://postmyimage.com/img2/525_UAHRatpacBvalidation.png
Take a look at Spencers upper troposphere index TUT. It has a global trend that is 0.14 C/decade larger than TLT in the AMSU-era.
An immense global hotspot, or an indication that something is wrong in the lower troposphere?
Radiosonde data show no such hotspot in the upper troposphere..
Olof R says, January 19, 2017 at 9:05 AM:
Hahaha! Yeah, sure. I’m sorry, but you’re describing yourself here, Olof, and no one else. You’re the spammer, and you know it. The only pieces of evidence you have ever provided for the alleged “correctness” of the RATPAC-A dataset are your own assertions. I, on the other hand, have always presented actual data showing how the RATPAC-A dataset is clearly flawed and in blatant disagreement with both satellite and surface series.
Yes. That’s because the UAHv6 TLT is pretty close to correct, while RATPAC isn’t. Simple as that.
RATPAC-A vs. GISTEMP LOTI gl mean (Jan’79 – Jun’01):
https://okulaer.files.wordpress.com/2016/02/32.png
RATPAC-A vs. GISTEMP LOTI gl mean (Jan’97 – Dec’15):
https://okulaer.files.wordpress.com/2016/02/30.png
The RATPAC-A trend is evidently way too low in the first part of the satellite era (1979-2016), and way too high in the second part. It is hard, if not downright impossible, to find a plausible physical explanation of such a strikingly peculiar pattern of divergence. Rather, it is clear evidence of methodological errors in the construction of a globally averaged radiosonde dataset, in the combining process of all the temporally inhomogeneous data from a bunch of individual weather balloon stations around the world into one single value. Evolving over time. The radiosonde data were never meant to be of “climate quality” in the first place. They’re weather balloons, after all. And so it all comes down to the adjustment procedures.
You should listen to Spencer when he points out the following:
“RATPAC-A changed their adjustment procedure from a careful, human intervention process to an automated, first-difference method in 1996 right where you see the shift in differences. This new method adds warming that is not there, or misses corrections for shifts to warmer sondes.”
You have nothing, Olof. You need to let this one go …
In the meantime, Spencer and Christys UAHv6.0 gl TLT is impressively and conspicuously corroborated by:
https://okulaer.wordpress.com/?p=4241&preview=true
Sorry, this is the proper link:
https://okulaer.wordpress.com/2017/01/22/4241/
Kristian, still empty words by you (and Dr Spencer), and no evidence what so ever..
You must explain how the simple and straightforward first difference method in Ratpac A can cause spurious drifts (as opposed to random noise).
The station series are simply cut at metadata events (new sondes, procedures, etc) and the trend is carried by the regional neighbours over the breakpoint.
If this procedure increase the trend systematically, it demonstrates that the old sondes had a warm bias vs new sondes. And this is exactly what we can expect, since new sondes commonly are less sensitive to spurious solar heating during daytime ascents, compared to the old ones. Read some technical papers if you dont believe it..
You have an awfully lot to prove to defend the AMSU-era lone cool outlier UAH v6.
You must demonstrate that:
-all unadjusted radiosonde data is wrong
-all adjusted radiosonde datasets are wrong
-all reanalyses of the troposphere are wrong
-all total atmospheric water wapor datasets are wrong
-that AMSU 4, 6 and 7 sensors that also measure the troposphere are wrong.
– that nondrifting AMSU-5 satellites, that dont need drift correction, are wrong (shortly, that UAH 5.6 is wrong).
-That RSS v4 and STAR v4 are wrong (since they agree with UAH 5.6).
You have a lot to prove, since there isn’t anything worth the name that corroborates UAH v6 TLT in the AMSU-era. RSS TLT is proven faulty, and doesn’t count.
And you have still not tried Dr Spencer upper troposphere index (TUT= 1.4*TTP-0.4*TLS)? I can help you, the global trends are:
MSU-era 1979-1999, 0.09 C/decade
AMSU-era 2000-2016, 0.26 C/decade
These trends seem familiar, don’t they? Actually they are quite similar to radiosonde trends for the troposphere.
TUT-weighted Ratpac A have the corresponding trends 0.08 and 0.27 C/decade
Olof R says, January 23, 2017 at 6:54 AM:
Olof, it’s a bit pointless having to respond to your endless string of nonsensical and evidence-free posts as long as you keep on refusing to read and take in what your opponents actually write, also completely ignoring the official data plotted and presented along with it.
For the umpteenth time: The RATPAC-A dataset does not agree with ANY of the satellite OR the surface datasets. Its warming rate is WAY too low in the first half of the satellite era and way too high in the second half.
UAHv6.0 agrees both with other satellite datasets, with surface datasets and with ERBS/CERES radiation fluxes at the ToA.
That’s all you need to know, Olof.
The satellite data is far more homogeneous both in space and time than the radiosonde (and the surface) data, basically all deriving from the same kind of measurement from the same kind of instrument utilizing the same kind of algorithm to translate radiances into temperatures. Moreover, the satellites also cover pretty much the entire world evenly, so their averages are ACTUAL global averages.
Are you seriously accusing the people responsible for the construction of the satellite temperature datasets of being total blockheads, not knowing (or not caring) about the various issues relating to the satellites and their instrument readings, somehow not understanding that some things do actually need to be paid attention to and corrected for, that they are completely unaware of, say, the differences and/or nonequivalence between different channels and the MSU vs. AMSU instruments?
All you do is waving your hands, Olof. You have nothing of substance.
Carl Mears of RSS thinks the surface datasets are more reliable than the satellite-based datasets:
https://www.youtube.com/watch?v=8BnkI5vqr_0
Carl Mears’ work is supported by NASA’s Earth Science initiative. There is a potential conflict of interest.
How so?
Who supports UAH’s work?
Funded by NASA to use satellites to look at Earth climate. Hmm this is a conflict how?
Where else would such funding come from? Maybe NOAA.? I guess that would also be a conflict? No way to win…
RSS is a private company, which goes under if it loses funding. UAH is not subject to the same pressure.
RSS sells its products to clients.
Bart says: “Carl Mears work is supported by NASAs Earth Science initiative. There is a potential conflict of interest.”
Usually government contractors have an incentive to make their own work look good. Carl Mears is doing the opposite — he’s pointing out that his own product (satellite temperature measurement of the lower troposphere) is less reliable than its major competitor (surface temperature measurement).
In other words, he is speaking against his own financial interest, not promoting it.
Usually government contractors have an incentive to make their own work look good to their government customer.
FIFY.
There is no data and no science that justifies remaking the world under guidance of the UN and without carbon based energy. The questions about fractional changes in temperature are beyond tedious. It is like seeing a small spot on a rug and so tearing down your entire house and building a new one.
You do not like Spenser and Watts, so move on.
Do something useful, and serious. Go help your neighbors.
That’s a response to Sou.
Sorry, Roy, I wasn’t careful there.
It’s okay John, I think Roy gets it. Miriam O’Brian (Sou) has been stalking Anthony for some time. Perhaps her Consulting business isn’t doing so well and she has a lot of free time on her hands to make stuff up and post wherever she can about things she has no idea about.
Sou makes a fool out of Watts all the time, using science and smarts. Her blog is well worth reading.
Sou…”Hes not published it four years later”.
So, if he publishes it what he is claiming become automatically true??? If you check out his site you will see photo after photo like the one Roy has supplied above.
http://surfacestations.org/
The first thing you read is that his paper has been accepted.
Not necessarily, no. But if Anthony ever did get around to publishing then, assuming at the same time he released his data and workings, we might finally get an idea of whether what he’s claimed about it makes any sense. We might even get a clearer picture of exactly what it is he’s wanting to claim – he was a tad coy about that in his AGU poster.
Thing is, when you compare the larger US data set with the pristine CRN (reference) dataset, they are almost identical. Anthony Watts seems happy enough with CRN data, so he should be happy enough with the larger data set. If not, he’s got a lot of explaining to do to say why he’d reject one and not the identical (and pristine) other. (Roy would know this if he’d ever looked into it.)
Not that any of this has anything to do with this third in a row hottest year on record globally. (Or with Roy’s apparent difficulties working out drifting glitches in his UAH data. Or with his unsubstantiated accusations against NOAA, and by extension every other group that publishes a surface data set.) People who live in glass houses need to take care with where they pitch their stones.
Actually, CRN provides very strong support for our hypothesis, as it turns out.
(Our hypothesis being that poor — unchanging — microsite exaggerates trends (sic), either a cooling trend or a warming trend.)
OK so when it comes to Roy you think it is important that his paper was published? But when it comes to others you say upthread:
‘Where in the scientific method does it say work has to be published in a journal or peer reviewed? In this day and age, a scientists can merely publish on the Net’
Which is it?
I wonder do you have any actual experience publishing scientific papers?
God bless both of you for your fine work, what you do is vital. Nobody has done more to expose the climate scam than you two.
I retired in 1999 from a career in Engineering Science and Space Hardware Development. I looked for a “problem to solve” in retirement. Anthropogenic Global Warming is “worthy”, I thought.
After only weeks of downloading data, reading authoritative reports, making my own models, etc. — I saw it was “bad science” — a fraud (for practical purposes of making money, I suppose).
But, how many folks can actually — do the math themselves? Most can only believe what they are told is “scientific consensus” — like I did before I did the math myself.
@Allen63
Reply in wrong place. See below.
Allen63 – a ‘scientific consensus’ means that most/all the the facts support a certain theory, it does not mean that scientists have some sort of consensus among themselves. There is a consensus only b/c most scientific research and papers show the planet is warming b/c of known scientific factors. Whether you believe its 67% of the papers or 90% of scientific papers that show AGW, its still a consensus b/c the larger percentage of papers show it. Its a consensus of scientific research.
Lou…”a scientific consensus means that most/all the the facts support a certain theory…”
Where does it say in the scientific method that consensus is a valid form of science?
Einstein was once confronted by a journal editor claiming several hundred scientists disagreed with him on a point. Einstein replied that it only took one to ‘prove’ him wrong.
Einstein also encountered a journal publisher who rejected one of his papers without sending it for peer review. He claimed on his own volition that the theory made no sense.
Therein lies the problems with consensus and peer review. You have scientists and reviewers lacking the insight of the scientists who put the papers forward.
I’ll go so far as to claim that the high percentage of scientists claimed to support AGW are nothing more than stupid sheeple who go along to get along.
“Einstein also encountered a journal publisher who rejected one of his papers without sending it for peer review.”
Which paper?
Mayve it, in fact, didn’t make sense.
The problem the intelligent scientifically literate person faces is there is much that science does not know about the effect on climate of a large number of important variables.
Interestingly that part of the science has advanced very little since the time of Arrhenius (about 1912) who postulated that the very small effect of increasing concentrations of atmospheric CO2 could be significant, in its effect on global temperature, only if there was a positive feedback with water vapour.
Further he did not, for example, come to any conclusion about the cloud effect simply because he did not investigate it. Which apart from a few speculative ideas from today’s climate scientists is about where the science sits today.
Trump’s greatest input to this debate would be to encourage a much fuller understanding of how Earth’s climate system works which means looking at many more variables than simply fixating on the human use of CO2 producing fossil fuels.
Here in Australia the charge is brought against our “alarmist” Bureau of Meteorology, by competent critics, that the altering (homogenisation) of temperature data, always is in the direction of post IR warming.
Allen, where can I read the work you published in journals?”
Same place as we can read your journal publications on climate.
BTW, when are you going to show actual evidence that man’s Co2 is causing serious global warming?
Karlock.
Current temperature in Alaska (C).
http://pics.tinypic.pl/i/00860/8rezsxhos2eq.png
phew! Chilly!
According to NOAA data, the 30-year trend for Alaska state-wide temperature change = +0.37 C/decade = +0.66 F/decade.
Still cold, David.
Not as cold as it was.
… or will be again as the pendulum swings.
There is no pendulum, and you can’t prove there is.
But there are manmade greenhouse gases, and a positive forcing from the ice-albedo feedback.
And, a hundred other influences besides, sometimes interfering constructively, and sometimes destructively, leading to periodic patterns, such as the one responsible of the late 20th century upswing, which has now petered out.
Show me a natural cycle that has produced the warming of the modern era. Show me how it doesn’t violate energy conservation. She me where the planet has cooled in order for this natural cycle to have shifted all this heat into the ocean and lower atmosphere.
David Appel wrote “Show me a natural cycle that has produced the warming of the modern era. ”
Sure – look at the rate of warming in central england in the late 1600/1700s.
Good point, Jim. DA seems to believe there are no natural cycles, and nothing changed the climate of the Earth before we started burning fossil fuels.
“Show me how it doesnt violate energy conservation.”
You sound like one of those naifs, like the Skydragons, who confuse energy with power, which is the time flux of energy. New packets of energy are arriving from the Sun every instant, at the rate of about 174 peta joules per second. There is also a vast amount of energy stored in the relative orbits of the Earth/Sun/Moon system which drive tides.
Thermal balance is achieved when the amount radiated back out is equal to the amount coming in, but there is no physical law against temporary imbalances, resulting in storage or excess release. Earthly climate mechanisms act on varying timelines, from the very short to the exceedingly long, with alternating cycles of storage and release.
jim says:
“Sure look at the rate of warming in central england in the late 1600/1700s.”
Central England is a very small place. What happens there isn’t what happens globally.
Bart, you write physics gobbleygook well. It’s just all meaningless speculation.
Show me the EVIDENCE that the Earth has received some kind of mysterious energy in the last century.
David, if you looked at the material posted by our distinguished host, it would answer a lot of your questions. He shows why temps go up, and he understands why temps go down, based on instrument readings and not just equations.
It takes more than a sentence or two to explain it, but Dr. Spencer has accommodated you. And it even includes a chunk of CO2 greenhouse effect, although not as much as some people.
“Bart, you write physics gobbleygook well.”
Well established physics, DA. If you think it is “gobbleygook”, then perhaps you should not really be involved in the debate.
Current temperature in France.
http://images.tinypic.pl/i/00860/i9pumes8ocjw.png
Current temperature in Spain.
http://pics.tinypic.pl/i/00860/yja2dseai3ed.png
I used to come to this site to read the occasional interesting piece on global warming. Unfortunately it has deteriorated into a purely political blog.
What about Richard Mueller and the BEST study? They got the most prestigious skeptics like Judith Curry and Robert Rhode and a bunch of money from the Koch brothers to finally do a rigorous statistical study showing (among other things) that there is spurious warming from urban heat island effects. The problem is, they showed the opposite. But good old Watts comes to the rescue with a paper showing that it does (at least in the US which happens to not be the entire world despite the attitude of many of its inhabitants). What a surprise since Watts is the world’s largest supplier of global warming mis-information.
If you don’t believe that Roy Spencer and his small group of deniers are politically motivated, then show me all the scientists that generally disagree with the scientific consensus on global warming and are NOT right wing/libertarian radicals. There is a perfect correlation between distrusting the science and buying into the idea that the science is being altered for some nefarious liberal political agenda. Unfortunately this blog is proof.
As it says at the top of the page “Roy Spencer … former NASA Scientist”
Look at my post above that lists 4 reasons why the BEST study using MODIS data doesn’t really prove anything.
I know the “establishment” scientists, been at many scientific meetings with them, count them as friends. But when I press them on their veiws, they invariably back off and say, “well, we need to get away from fossil fuels anyway”.
And, Geraldine, if you go “ad hom” again, I’ll ban you from posting comments here anymore.
Geraldine –
The BEST team are indeed to be taken seriously. I agree with that.
But I don’t buy all your nonsense about the Koch Bros and that scepticism is defined by groups of right wing/libertarian radicals. Sure we are all tribal to a degree but there is no right-wing orthodoxy which sceptics are following. On the other side, however, it is abundantly clear that the green liberal establishment has tried, very successfully on the whole, to shut down the debate. And THEY are the people with an overwhelming advantage in money and power. Although I have an open mind on these issues, I certainly resent being told what to think and say by the great and the good.
Blogs like this, and Anthony Watts’ are an invaluable contribution to the debate and should be encouraged, and challenged, but never sneered at.
I’ve read Roy Spenser, Anthony Watts and John Christy for years, especially Roy. I have found zero evidence that he is at all “politically motivated” or an idealogue in any way. This doesn’t mean that he’s shy when getting his message out or is afraid to defend himself or his colleagues.
Roy may have some religious views that you might call unorthodox, but they don’t affect his conduct of science – despite being demonized by idealogues of another persuasion.
I’m sick to death of idealogues on both sides of the climate wars, and I fear that the Trumpster will do nothing to stop it. I hope I’m proven wrong.
spalding…”Roy may have some religious views that you might call unorthodox…”
So did Isaac Newton.
spalding craft: I have found zero evidence that he (Dr Spencer) is at all politically motivated or an idealogue in any way.
Comment seems a tad surreal following a blog post advocating priorities for a yet to be named political appointee.
I’d suggest also that the Cornwall Alliance, like any public policy advocacy group, is inherently a political organization.
To be clear I’m not making a statement one way or the other as to how this might influence Dr Spencer’s scientific products.
Anthony Watts failed to graduate from college.
His blog demonstrates that every day.
That ad hominin attack demonstrates the character you are. I had better hopes for you. You had enough knowledge to be persuasive at times, but lately I see you on par with mpainter.
If you don’t see the enormous errors and overwhelming bias that get published on WUWT, you aren’t looking near hard enough.
Here’s a couple I noticed recently:
https://wattsupwiththat.com/2012/02/13/do-latest-solar-studies-confirm-upcoming-global-cooling/
and
https://wattsupwiththat.com/2014/06/28/a-cool-question-answered/
Read Sou’s blog to learn about all the very basic mistakes Watts makes.
Another:
http://davidappell.blogspot.com/2015/08/the-department-of-oops-case-number-1.html
Seriously? You think an uptrend due to El Nino will be sustained into the future? Pathetic.
Warming isn’t caused by El Ninos.
But El Nino months keep getting warmer and warmer:
http://davidappell.blogspot.com/2017/01/el-nino-years-compared.html
As do La Nina months. And ENSO-neutral months.
Warming over the interval you’re looking at certainly is.
Wow! That’s low, even from you.
As someone wrote above, Watts’ blog is the leading source of climate misinformation on the Internet.
I’d say the leader in that category by several lengths is “Skeptical Science”.
Figures — I wouldn’t expect someone like you to be able to see the difference.
I’m rubber, you’re glue…
David Apple:”Anthony Watts failed to graduate from college”
ME And YOU claimed that:
There is no crisis that will change our minds not heat waves in France, not Katrina, not the disappearance of Arctic ice up north. We want what we want, and our species is lousy at planning for the future.
http://www.guardian.co.uk/commentisfree/cifamerica/2008/dec/12/environment-climate-change-poznan?commentpage=3
Not record cold in Russia, not a dearth of major hurricanes hitting the US for 12 years (the longest interval in recorded history), not the accumulation of ice in Antarctica. Yes, we want what we want, don’t we?
Sandy — $60B damages and at least 233 deaths.
How many major hurricanes have devasted the northwestern Pacific in recent years?
How many deaths?
Trends in North Atlantic tropical storms and major hurricanes:
http://policlimate.com/tropical/north_atlantic_hurricane.png
You can always cherry pick. But, the global average has no trend.
http://models.weatherbell.com/tropical/global_major_freq.png
Gerladine…”What about Richard Mueller and the BEST study? They got the most prestigious skeptics like Judith Curry…”
Judith Curry has withdrawn her support of BEST claiming it was altered by Mueller before publishing.
What proof/evidence did she give in support of her claim?
Gordon is right. Dr. Curry was very upset at the BEST study. While the study was not entirely shoddy, the authors did not follow their pledged methodology, and because of that, the study lost many supporters.
What proof did Curry give of any of her complaints?
BEST was peer reviewed and published. (And had a Nobel Prize winner in physics on their team.)
Did Curry send a letter to the editor of the journal? Or just whine on her blog.
Blog posts aren’t science.
An astrophysicist. I think I’ll give the edge to Curry there.
A very very good astrophysicist, and a Nobel Laureate.
You can read my profile of him, which appeared in Scientific American, here:
“Dark Forces at Work,” Scientific American, May 2008, p. 100-102.
http://www.davidappell.com/articles/Perlmutter_Scientific_American.pdf
including
“Discovering a Dark Universe: A Q&A with Saul Perlmutter,” SciAm.com, May 2008
https://www.scientificamerican.com/article/discovering-a-dark-universe/
But, not a climate scientist.
They’re simply analyzing data. Something astrophysicts do all the time. Something the very smart Nobel Prize winners know lots about.
You don’t need to be a climate scientist to analyze data. Not at all.
If you’re “analyzing data”, and you don’t know what the data mean, you’re not analyzing data.
Sure, says the self-proclaimed genius who somehow has yet to produce an analysis of anything at all here regarding science or mathematics.
All talk, no action.
“And, Geraldine, if you go ad hom again, Ill ban you from posting comments here anymore.”
What is my “ad hom”? Was it when I suggested you are a Libertarian?
Or when I quoted your own website identifying yourself as a “former NASA scientist”?
Gordon Robertson calls Mann and Tamino (among others) an “idiot” above. Ban him.
Bart calls Appel a “simpleton”. Ban him.
Every post we have the same folks spewing stuff so unscientific that I don’t know how you could allow it. Ban them all!
You don’t like the BEST study because it doesn’t fit your political narrative. You prefer Watts because it does. Watts is not a scientist (even a former one) and Mueller has a Noble prize.
Go ahead and ban me. I don’t think you got the underlying message (I admit it was subtle). This site isn’t worth reading anymore. I can listen to Rush Limbaugh and get the same level of unbiased science.
“Mueller has a Noble prize.”
He may indeed have a noble prize. Maybe dozens of them. But, he does not have a Nobel.
Hey!
So far this thread is shaping up to be promising. Can we keep it that way? Roy’s last few posts have been almost unreadable because of the intervention of a couple of very tireless trolls making half-relevant comments scattergun all down the line, and equally reprehensible reactions to them by several commenters.
Can we keep it that way?
Here, Here! Let’s seriously discuss these issues, rather than listen to endless repeats by serial commenters.
I’m not sure if this has been addressed before, but according to WUWT, with regard to UAH data “it was discovered that onboard instrumentation was heating the platinum-resistance thermometers”
https://wattsupwiththat.com/2017/01/07/when-will-the-pause-in-global-temperature-return/
Is there any truth in this, and if there is does this make all satellite data questionable?
(I suspect it’s a misleading claim given the source, but I’d like to have it confirmed one way or another.)
Bellman…”it was discovered that onboard instrumentation was heating the platinum-resistance thermometers”
Old news. Any such issues were addressed circa 2005.
This is well known, and UAH *adjusts* the raw data to correct this.
Adjustments are necessary. Not just for sat data, but ESPECIALLY for surface data.
Perturbations include TOBS flip, moves, equipment conversion. Either that or one must drop perturbed stations — and that is a sort of de facto form of adjustment, in and of itself. Raw data won’t do if it is from a perturbed station.
Sad fact is, that there are not enough well sited, unperturbed stations for historical coverage. just ain’t.
And there are two more severe biases that appear to have emerged:
1.) Microsite effect on trend. I am not talking about microsite changing over time from good to bad (or vice versa). No, I’m talking about bad microsite whose badness does not get better or worse over time.
Note, we are NOT talking UHI here. (Only ~9% of USHCN is urban, anyway. We include urban data in with the rest.)
Poor microsite has a large and statistically significant effect on Tmean trend even if it gets no better or worse over time.
2.) The original CRS units themselves. That one cuts. And it rattles the chain clear back to 1850. Like the microsite issue, it is a heat sink issue. The problem is that CRS units ARE bad microsite. The box, being wood, does not greatly affect Tmin, but Tmax, Hoo-boy! We are talking through the roof.
If CRS Tmax trends are correct, then MMTS trends are wrong. And ASOS trends are wrong. And the PRTs of the CRN are wrong as well.
Over three out of four stations is poorly sited. Bottom line, USHCN (LST) trends are being highballed by a factor of perhaps 1.5 to 2.
This is NOT dishonesty on the part of NOAA, so far as I can see. It is only an error, one I could have made, myself. And homogenization (as we all know) plays absolute havoc with data that contains systematic bias. But remove the bias and homogenization will likely work as intended.
So, yes, adjustment is necessary. But I think it is being done wrong. Badly wrong.
“Old news. Any such issues were addressed circa 2005.”
“This is well known, and UAH *adjusts* the raw data to correct this.”
Thanks. Just to be clear, when Monckton claims that reason UAH 5.6 was warmer than UAH 6.0 is because of this onboard heating he’s wrong because it had already been fixed in UAH 5.6. Am I understanding it correctly?
Please tell us what the maths is you did to solve this question. Is there an equation that you plug in some figures and get an answer? If so, which figures did you use?
There is no “one equation”. There are many many things involved (for example, I made a model of the solar system to see for myself the effects of planetary orbital motions on the Sun). It takes weeks or longer to do all the various maths involved.
Having been in a field where real Scientists competed for Government Grants (in fact I got a few and later in my career I awarded a few to others), I learned first hand that all science is not totally objective if the Scientist’s funding is involved. Moreover, Scientists tend to see what they want to see — I did it myself once (I still kick myself). So, I know that everything one reads is not all true.
I’m no one special. Rather, I had a certain background that most folks don’t have (through no fault of theirs). Thing is, one needs that sort of background to “sort scientific fact from fiction” with some confidence.
At this point, I just read about AGW. I don’t do my own calculations — because others do more than adequate AGW calculations — I can’t add anything.
“I made a model of the solar system to see for myself the effects of planetary orbital motions on the Sun”
Do tell! What effects did you find?
Anthony Watts’ considerable efforts, aided by many people all over the country, has made a valuable contribution to our understanding of measurement biases. However, I would maintain that it is only a part of the story as to the biases within the land surface temperature record. Another element is that with Gistemp there seems to be an instability in the calculations, usually resulting in continual adjustments upwards of the recent warming trends. This has (wrongly in my view) been put down to deliberate manipulation of the data.
This saga kicked off with Paul Homewood looking at Paraguay temperature adjustments two years ago, noticing that about eight temperature data sets covering much of the country seemed to have been arbitrarily adjusted downwards in the late 1960s by about 1C. I found that this was both in the GHCN data (used by NASA GISS and NOAA) and in the Berkeley Earth data sets. The reason was that these unadjusted temperature records show a sharp drop in average temperatures that were not present elsewhere, giving a strong indication that there was a real, but localized, fall in average temperatures. Data homogenisation is required to remove measurement biases that are known to be present. But that is only possible on the assumption that nearby stations are exposed to almost the same climate signal and that the differences between nearby stations can be utilized to detect inhomogeneities. But if there are localized differences in trends, then these differences could be eliminated the same as a clear measurement bias due to a temperature station being moved next to an air conditioning unit or sewage farm. But if you look at the NASA GISS temperature anomaly maps (based on homogenised data), it is easy to see why homogenisation can lead to cancelling of localized trends, often by deleting years of carefully collected data. The variations in temperature trends can in general lead to three features. First is that homogenisation adjustments can be inversely related to the density of the temperature stations. Second is that, with multiple homogenisation runs, the data can become more anomalous the further back in time one goes. Third adding to the homogenised data over time throws up new anomalies in the past.
See my posts Defining “Temperature Homogenisation” and Climatic Temperature Variations.
In fact, corrections to the raw data REDUCE the long-term warming trend.
See the NOAA graph here:
http://davidappell.blogspot.com/2017/01/more-about-todays-gissnoaa-press.html
Because they make the 1800s warmer. What do adjustments do for more recent time periods?
No. Read the link.
It’s right there in the chart at the link.
We can see the adjusted vs raw down at the bottom.
What is not clear is the current difference as they are all smushed together.
MikeN: The corrections are from 1890 to about 1945, correcting data taken from ships by buckets thrown overboard into the sea to an engine intake method.
Is that correction justified?
So you are referring to one specific adjustment? I thought you meant all adjustments. Looking at your chart, the adjustment is to make the nonAGW past warmer, thus lowering the warming trend. However, this is really irrelevant to the argument that ‘adjustments create the warming’ as they are talking about more recent warming that has been attributed to CO2.
As for you adjustment with ships, you are wrong on this, according to various sources who have described the adjustment, including Zeke Hausfather. They did not warm the 1890-1945 to adjust for the ship intakes, they warmed the present numbers from the buoys to match the ships(which if adjusted would have to be cooled).
Appell is misdirecting, as usual. See Bob Tisdale’s blog for comprehensive NOAA corrections.
Bob Tisdale is a amateur thinks El Ninos cause global warming. Even though they’ve been happening for thousands of years.
I”ll stick with what the professionals say:
http://davidappell.blogspot.com/2017/01/more-about-todays-gissnoaa-press.html
You are a simpleton/amateur who thinks CO2 dominates Earth’s climate.
They don’t say what you think they say.
Atmospheric CO2: Principal Control Knob Governing Earths Temperature, Lacis et al, Science (15 October 2010) Vol. 330 no. 6002 pp. 356-359
http://pubs.giss.nasa.gov/abs/la09300d.html
2010: last gasp before the pause became clear.
You’re an easy mark.
What pause?
https://1.bp.blogspot.com/-A4Q81nbppNQ/WH-TZWBWF2I/AAAAAAAAG7U/FuJO7R5b8uE1tvuGdyCHoVsNg4HpNabQgCLcB/s1600/NOAA%2B2016.JPG
Actually, raw data is no good. The problem is not that the data is adjusted. The problem is that the data is not adjusted enough.
Your concerns appear possible -if they are only on a blog they will not have an impact
Refering to kevin marshall
“An article appeared in the Washington Post yesterday…”
The Washington Post is a rabid tabloid with a major hatred for all things Trump.
Trump adviser Bob Walker has called climate science too politicized and he is calling for more input from skeptics.
There is another problem like the temperature record tampering for green-left-establishment political purposes. At least in Australia. The greens have influence in the administration and they prevent normal traditional (40,000 years by aborigines) bushfire prevention by winter burns of excess natural fuel for the bushfires. Also the more bushfires, and the more terrible each one, the greater need for a large budget for the government bureaucrat-controlled fire department. But, by people not in touch with the conditions on the ground in the bush, the bushfires are seen as “due to climate change”. The result is ever more man-made death and destruction with the cause hidden under the misleading cloak of “climate change”. (Americans call them forest fires, I think. Ours include deadly grass fires, especially along roadsides.)
The new parking lot next to the New Orleans Airport temperature gauge inflated it’s August and September average readings at least 2.5 degrees over surrounding areas. At mid-morning the gauge was constantly reporting 10 degrees higher than your car on the adjacent interstate stopped in the sun. The local weatherman was constantly apologizing and explaining to try to keep us from thinking he was an idiot for reporting what the NWS was supplying him with. We should be doing better.
Is this station part of the GHCN?
Yeah, it’s USHCN. Been around since 1962, but no listed predecessor (like a lot of AP stations). We dropped it from our “unperturbed” set because it was relocated a mile west in 2001. (We rated that one a Class 4.)
(When we follow up what we have done, we should incorporate the partial record.)
Roy wrote:
“And we also know the result of CO2 emissions reduction will be a huge amount of pain (up to $100 Trillion loss of wealth this century) for no measurable impact on global temperatures”
No, we don’t know that. Lomborg is obviously a denier, and his record shows he cannot be trusted by unbiased people.
Roy: What is the cost of NOT addressing climate change?
Roy I can’t understand how you let Appell get away with his claim that Lomborg is a denier? He should be told to retract his false claim or be banned from your site. Lomborg has repeatedly said for years that he accepts the theory of AGW and yet these stupid fools still claim he’s a denier.
Of course he also knows that any mitigation of AGW will have no measurable impact by 2100 and just about everyone understands this is the case.
The US EIA shows that co2 emissions will increase by 34% by 2040 and Lomborg quotes the IEA’s estimate that solar and wind will only produce about 2.5% of TOTAL world energy by 2040. Also Dr Hansen (the father of CAGW)called Paris COP 21 “just BS and fra-d”. So is he a denier as well?
Your joking, right. Lomborg, like Pielke Jr, “accepts” AGW, but one way or another anything anyone says about it is wrong, according to them. They continually seek extreme positions in order to undermine the case for solving the problem.
Lomborg has made a career out of doing this.
By the way, what is the cost of NOT addressing climate change?
David,
Are you paid to spend this much time on this site?
Probably negative. #B^)
“Also Dr Hansen (the father of CAGW)called Paris COP 21 just BS and fra-d. So is he a denier as well?”
Get real. Hansen said that because he doesn’t think Paris goes nearly far enough.
You guys whine anything is attempted to address the problem as being insufficient, and then you whine if anyone proposes solutions that really WOULD solve the problem.
See how easy it is to be a denier?
Demonstrating cognitive blindness again I see Appell.
I was at a Hansen speech in San Francisco where he denigrated the Paris process. So I think I know a just a tiny teeny more about it than you do.
Lomborg believes that man-made carbon-dioxide emissions will cause the kind of global warming advocated by the IPCC. But he thinks that the way to deal with it is to accept that such warming will happen and to spend money on adapting to it because the cost of supposedly preventing it is far greater and less beneficial.
What is the cost of adapting to it?
What about the coming climate change is beneficial?
Milder winters, longer growing season.
To David Appell. To find out how Lomborg assesses the cost of adaptation, one may read what he writes on the topic.
By ‘beneficial’ I mean ‘beneficial as assessed by the effects of reduction of the warming caused by man-made carbon dioxide emissions’. Lomborg thinks that man-made carbon dioxide emissions will have significant warming effects, and that it would be beneficial to reduce those effects. But he also thinks it would be costly to do so. Here I am not referring to ‘benefits of warming’.
Climate Mitigation Engineering: possibly new approach
Hello,
I would like to know if anyone is working on using ocean plankton to mitigate Climate Change using Emiliania huxleyi? It is the single biggest source of Oxygen on Earth. Eats Carbon like there is no tomorrow, and at the rate Methane is dissociating in the Artic there may not be one for kids under 12.
Is it feasible to select and drain appropriate swamps or lakes in the Artic areas and lay pipe or cannels to bring in sea/ocean water? The latitude would of course be important. The plankton may prove to be the most cost effective way to reduce atmospheric Carbon.
To paraphrase Bill Gates, we need to consider every option.
Windsor ON CA
226-788-5548
Thanks,
Jeff
Yes, people have thought of this, but this says it’s not promising:
https://en.wikipedia.org/wiki/Emiliania_huxleyi#Climate_change
Hello? Life ends without “carbon”. Let’s just deep six that notion, shall we?
Just who do you think is proposing getting rid of all carbon?
Another Bart fail.
Jeff said “Eats Carbon like there is no tomorrow”. Sounds like a Frankenstein monster to me.
Here’s a tip: had I been replying to you, the comment would have appeared with an indent under your comment.
So who do you think is proposing getting rid of all carbon?
David Appell says:
January 18, 2017 at 6:04 PM
By the way, what is the cost of NOT addressing climate change?
——————————————————-
It’s impossible to calculate because there are too many variables. On the one hand, there could be a continuation of ‘real’ atmospheric pollution with adverse health effects, and eventually a ‘real’ shortage of fossil fuels which could cause a major economic crisis.
On the other hand, if we were really successful in quickly reducing atmospheric CO2 levels, there would be a global reduction in the quantity of agricultural crops which could exacerbate any food shortages in conjunction with a rising, global population.
A sensible policy would be to spend more money in reducing the ‘real’ pollution from fossil fuel burning, by using better emission controls, whilst also spending money more efficiently on research into alternative energy supplies, particularly solar power, electric vehicles, and battery storage.
The positive side of the AGW alarmism is that we will probably eventually develop efficient solar systems and battery storage which might prove to be more efficient than burning fossil fuels ever were, taking all external costs into consideration, such as the health consequences of atmospheric pollution.
The negative side of AGW alarmism are the inefficiencies resulting from policies based upon (possibly) false premises, and the sheer waste of money which is used to provide subsidies for the installation of alternative technology which has not been fully developed.
I always remember when Obama first made his comment that ‘the science is settled’, several years ago. At the time I was posting on a ‘pro-alarmist’ site and the wrote something along the following lines:
“That’s wonderful news that the science is settled. We can now divert some of those funds that governments are currently allocating to climate-change research centers, towards more research into alternative energy supplies. Those climate scientists who realize that their work is now complete, could be offered retraining in other disciplines relevant to alternative energy research.”
Guess what! My post was censored.
Vincent says:
“On the other hand, if we were really successful in quickly reducing atmospheric CO2 levels, there would be a global reduction in the quantity of agricultural crops”
Says what science?
Was there a shortage of crops before the industrial era, when CO2 was 280 ppmv?
Does CO2 make crops somehow better?
If so, how do you know?
That’s just dumb beyond measure. How do you think plants grow? Do you know anything at all about photosynthesis? I thought they taught that to every grammar school child.
“Was there a shortage of crops before the industrial era, when CO2 was 280 ppmv?”
Uh, yeah.
http://ourworldindata.org/wp-content/uploads/2013/10/the-number-of-famine-points-by-half-century-1300-1900-saito-20100.png
Just what is that figure supposed to mean??
It has no title.
“Points” on the y-axis? What does that mean?
What is being plotted?
More poor, unscientific claims by Bart.
Look closely. Pay attention.
I bet you don’t know yourself.
Hint: read the link
You link is to a graph.
It explains absoluting nothing about it.
I always knew David Appell had a very limited intellect. But this latest post confirms he is nothing but a common troll.
“Does CO2 make crops somehow better?
If so, how do you know?”
http://www.sjsu.edu/faculty/watkins/CO2plants.htm
I can point you to others, but I picked a resource as it is directed to your low reading comprehension.
Was there a shortage of crops before the industrial era, when CO2 was 280 ppmv?
Quite.
Does CO2 make crops somehow better?
Quite.
If so, how do you know?
Greenhouses, generally ramped up to ~1000ppm.
(Also, Donohue, et al., and other papers.)
Dont get draged into any side issuses the main focus is to side line the likes of Rayder,Myers and White and there look alikes keep on the program. Those of you with power use it
Harry
There was once a person that hijacked this site for their personal narcissistic “science”. I fear it has happened again with DA.
Roy wrote:
“And we also know the result of CO2 emissions reduction will be a huge amount of pain (up to $100 Trillion loss of wealth this century)”
Roy, do you know where I can find a copy of Lomborg’s paper explaining all this?
SURELY you’re not buying his claim based on a simple 5-minute video clip….
Right???
You don’t need a peer reviewed paper to demonstrate the beed’n obvious.
Explain how $100 T is “bleeding obvious.”
“Fixing Climate Change May Add No Costs, Report Says,”
Justin Gillis, New York Times, Sept 16 2014.
http://www.nytimes.com/2014/09/16/science/earth/fixing-climate-change-may-add-no-costs-report-says.html
‘Lomborg, like Pielke Jr, accepts AGW, but one way or another anything anyone says about it is wrong, according to them. They continually seek extreme positions in order to undermine the case for solving the problem’
The ‘extreme’ positions sought by Lomborg and Pielke Jr probably mean:
a) That any effort to reduce emissions has been an epic fail. I demonstrate this in a recent article, using the correct metric which is CO2 vs GDP (as advocated by Pielke since long ago). There is no merit in e.g. Greece reducing its emissions, nor is there merit in developed countries with very low GDP growth doing that.
https://wattsupwiththat.com/2016/12/30/do-the-math-climate-policies-cannot-change-century-end-temperature-more-than-0-5c/
As you can see the rate of emission reduction, i.e. the rate of decarbonization, *declined* after the COP meetings and ‘climate policies’ started.
The climate bureaucrats have no clothes. Their policies have been a failure, period.
b) That there isn’t much evidence that one needs to reduce emissions, given the trends in crop productivity, natural disasters and so on.
Of course, if the policies fail to reduce emissions then the second point is moot anyway. Both are also essentially independent from the debate about climate sensitivity, though looking at what the data says since 1950 or so the TCR seems to be 1.3C, lower than the 1.8C model mean.
I also calculated (not yet published) how much cooler today’s world would be if we had started decarbonization way back in 1980, assuming the decarbonization rate would have been 1% higher than it actually was. The answer: less than 0.1C.
PS: about the post, honestly, I don’t know how Spencer can make these wild claims without a shred of evidence. Surely the peer reviewers aren’t keeping Watts (or anybody else) from publishing their data/analysis on a blog.
Look at the Paris agreement people! The developing countries are not asked to reduce their emissions or slow their econ development. That is a straw man argument.
“Surely the peer reviewers arent keeping Watts (or anybody else) from publishing their data/analysis on a blog.”
He, and his partners, have:
http://surfacestations.org/
There is, in fact, a paper:
https://pielkeclimatesci.files.wordpress.com/2011/07/r-367.pdf
Bart,
As I said above, I looked at this paper. Its abstract states that there is no sig effect on mean temp trend of US , due to siting. This DISAGREES with Roys statement.
Bart, I would like and explanation for the annoying inconsistency between the published paper https://pielkeclimatesci.files.wordpress.com/2011/07/r-367.pdf
that you keep highlighting and the claim of Roys blog article or the Watts poster.
Specifically: The claim that ‘a substantial fraction of the warming in the US disappears’
This simply disagrees with the paper which states ‘ the overall mean temperature trends are nearly identical across site
classifications’
You should consult the newer study that Dr. Spencer links to here.
Another perhaps BIGGER concern about this project is that it was funded by The Heartland Institute.
https://wattsupwiththat.files.wordpress.com/2009/05/surfacestationsreport_spring09.pdf
Heartland is a political advocacy group that has long had clear agenda to deny climate change. It has of course been funded by fossil fuel industry.
To me this is equivalent to quoting a scientific study of climate change funded by Greenpeace and carried out by members. Would you all find that credible?
Ad hom. Next?
Ha!! You’re always ready to impugn scientists based on some mysterious hidden money they supposedly receive to supposely change their opinions.
None of which you can prove, of course.
Now suddenly a mention of Heartland funding is inappropriate.
What a joke.
Ad hom? No you clearly dont know what that is. I am pointing out a real problem.
DA – Tu quoque. Next?
Bart you remind me of a strategy used between me and my siblings called the ‘slap and run’.
False analogy. Next?
Dr Spencer is right to hope that the Trump administration will check the temperature record controversy. The religio-political motivation of the recent government bureaucrats has been to falsely exaggerate the temperature increase. Data-tampering is a potent temptation for them, and very hard for non-government people to counter. Jennifer Marohasy is doing a great job in Australia in checking the data, but she doesn’t have the large staff support of a government bureaucracy.
Hi Dr. Spencer,
there is a thing that I never understood about the USHCN temperature station technical prescriptions and their homogenization process to get a “global database of temperature measurements”.
On one side they impose a minimum distance from any human activity to avoid the UHI (minimum distance which is far less than 1km), and on the other side they pretend to “homogenize” on a grid far larger than that minimum distance to reconstruct unknown temperatures.
With the first statement they suppose that that minimum distance is
sufficient to avoid the thermal influence of the surroundings, while in the second statement they claim to be able to reconstruct the thermal condition of a place using the surroundings temperature farther than that minimum distance.
Isn’t that a paradox?
Have a great day.
Massimo
David Appell says:
January 18, 2017 at 10:06 PM
Vincent says:
On the other hand, if we were really successful in quickly reducing atmospheric CO2 levels, there would be a global reduction in the quantity of agricultural crops
Says what science?
Was there a shortage of crops before the industrial era, when CO2 was 280 ppmv?
Does CO2 make crops somehow better?
If so, how do you know?
————————————————
How do we know? Are you serious? We grow plants under controlled conditions and observe how they respond when the only change in conditions is a change in atmospheric CO2 levels. We can then repeat the experiments many times, changing other variables in addition to CO2 levels.
Many crops take only a few months to grow, unlike climate change which might take several decades before a trend is clear.
Those who are worried about the effects of increasing temperature and a shortage of water (for whatever reason reason, whether due to AGW or not) should be relieved to learn that increased levels of CO2 have an even greater benefit for water-stressed plants.
For water-stressed plants, a doubling of CO2 levels can result in a 62% increase in growth.
The following article provides a good summary of the situation, and explains the difference between C3 and C4 plants. About 95% of all plants on earth are of C3 type which respond more to increases in CO2 levels, but C4 plants will still increase growth by around 22% for a doubling of CO2.
http://www.sjsu.edu/faculty/watkins/CO2plants.htm
Vincent, the experiments you described have been done and the results are not at all the positive benefits what you assume.
Higher CO2 tends to inhibit the ability of plants to make protein And this explains why food quality seems to have been declining and will continue to decline as CO2 rises because of this inhibition of nitrate conversion into protein. Its going to be fairly universal that well be struggling with trying to sustain food quality and its not just protein its also micronutrients such as zinc and iron that suffer as well as protein.
– University of California at Davis Professor Arnold J. Bloom, on Yale Climate Connections 10/7/14
http://www.yaleclimateconnections.org/2014/10/crop-nutrition/2014
“We also find that the overall effect of warming on yields is negative, even after accounting for the benefits of reduced exposure to freezing temperatures.”
— “Effect of warming temperatures on US wheat yields,” Jesse Tack et al, PNAS 4/20/15
http://www.pnas.org/content/early/2015/05/06/1415181112
“Negative impacts of global warming on agriculture, health & environment far outweigh any supposed positives.” Smith et al. PNAS (2009), http://www.pnas.org/content/106/11/4133.full.pdf
THere are many more papers of this sort.
“Theory of Infrared Heating (Reprinted with permission of Fostoria Industries.)
Infrared radiation is electromagnetic radiation which is generated in a hot source (quartz lamp, quartz tube, or metal rod) by vibration and rotation of molecules. The resulting energy is controlled and directed specifically to and on people or objects. This energy is not absorbed by air, and does not create heat until it is absorbed by an opaque object.
The sun is the basic energy source. Energy is projected 93,000,000 miles through space to heat the earth by the infrared process. This infrared energy travels at the speed of light, and converts to heat upon contact with a person, a building, the floor, the ground or any other opaque object. There is, however, no ultraviolet component (suntanning rays) in Electric infrared.
Electric infrared energy travels in straight lines from the heat source. This energy is directed into specific patterns by optically designed reflectors, Infrared, like light, travels outward from the heat source, and diffuses as a function of the square of the distance. Intensity, therefore, would decrease in a proportional manner. So, at 20 from the heat source, intensity of the energy concentration is the intensity developed at 10 distance.
For comfort heating, there must be reasonably even accumulated values of heat throughout the comfort zone. Proper mounting heights of the individual heaters, fixture spacing, reflector beam patterns, and heat source wattage must be specified to generate the proper heating levels at the task area. The amount of heat delivered is also adjusted by input controllers or by thermostats which respond to surrounding temperature levels and provide ON-OFF or PROPORTIONAL inputs.
Advantages of Infrared Heating (Reprinted with permission of Fostoria Industries.)
1 ) HEATS PEOPLE WITHOUT HEATING AIR Infrared travels through space and is absorbed by people and objects in its path. Infrared is not absorbed by the air. With convection heating the air itself is warmed and circulated … however, warm air always rises to the highest point of a building. With Infrared heating, the warmth is directed and concentrated at the floor and people level where it is really needed.
2) ZONE CONTROL FLEXIBILITY Infrared heating is not dependent upon air movement like convection heat. Infrared energy is absorbed solely at the area it is directed. Therefore it is possible to divide any area into separate smaller zones and maintain a different comfort level in each zone. For example, Zone A, with a high concentration of people, could be maintained at a 70 degree comfort level while at the same time Zone B. a storage area, could be kept at 55 degrees or even turned off completely.”
https://www.infraredheaters.com/basic.html
CO2 is not a source of heat.
http://www.ospo.noaa.gov/data/atmosphere/radbud/gs19_prd.gif
http://www.ospo.noaa.gov/Products/atmosphere/rad_budget.html#ABS
ren: No one claims CO2 is a source of heat. You are chasing a ghost.
Hi Ren,
here in Italy we say something like this: “not everything glares, is necessarily gold”.
Few years ago, I spent a lovely night with my girlfriend in a bar on the shore of lake Maggiore few kilometers from my hometown.
She wanted to stay outside in front of the lake despite it was winter and cold because there were those “mighty” infrared heating lamps. What the IR lamp produces missed to wrote Is that your skin get hot because of those IR rays, but it also dissipate the heat to the surrounding environment (air comprising).
The result is a very unpleasant sensation of very hot skin in the directions of the IR lamps and very cold skin on the other directions.
About the advantage of heating the things in a room instead of the air inside, it is untrue. That because early or later the air inside a closed room reaches the temperature of the things inside, with the disadvantage that in a closed room the “air heater” become mostly the room walls, the heating performance is well know to be far less than a floor heating system, because the walls usually work as heatsinks to the outside better than the floor.
About the different temperature zones, let me have some doubts for the very same reason that air little by little works as a temperature mixer. It remembers me my sedan car with the two zones climate system, what it changes is just the speed of the fan on the two sides of the car, the two controlled temperatures are just a chimera.
Have a great day.
Massimo
http://www.ospo.noaa.gov/data/atmosphere/radbud/as19_prd.gif
http://www.ospo.noaa.gov/data/atmosphere/radbud/swar19_prd.gif
The source of heat in the atmosphere is water vapor, which is lighter than air.
http://www.ospo.noaa.gov/data/soundings/atovs/profiles/RODF_RT_31_noaa19_D1_t1.png
The surplus solar energy is stored in the oceans.
http://www.cpc.ncep.noaa.gov/products/analysis_monitoring/enso_update/heat-last-year.gif
What “surplus energy?”
Total solar irradiance has been decreasing since the ’60s.
Many feared dead after avalanche hits hotel, children inside Rigopiano.
http://www.ansa.it/english/news/2017/01/19/many-dead-after-avalanche-hits-hotel-3_b9b137ae-670e-46d2-936a-4562f82b0bda.html
http://www.ansa.it/sito/notizie/cronaca/2017/01/19/i-mezzi-di-soccorso-bloccati-dalla-neve_82bc23fb-f8d1-4917-825b-b07e2f9ddbd6.html
Snow Depth in California.
https://www.nohrsc.noaa.gov/snow_model/images/full/Western_Coastal/nsm_depth/201701/nsm_depth_2017011905_Western_Coastal.jpg
http://images.intellicast.com/WxImages/48hrSnowForecast/dra.jpg
It’s sad that Roy repeats unfounded conspiracy theories.
Hello Ceist,
A conspiracy? When you have power no need to conspire ….
“Everything begins in mysticism and ends in politics, every party lives by its mysticism and dies of its policy”
Charles Pguy.
Cordially,
“NOAA has been actively adjusting the thermometer record of global temperatures over the years by making the present warmer, and the past colder, leading to an ever increasing upward temperature trend.”
Roy this is just not true.
Globally (land and ocean) the past has been warmed and the present has barely changed.
http://berkeleyearth.org/wp-content/uploads/2015/11/zekeFigure3.png
IF by that you mean it was done to a non scientific agenda and not necessarily because of changes in instruments and reading practises – then you disappoint me greatly.
I did not for a minute think you were a conspiracy theorist.
“Watts research has suggested that, after removing the contaminated stations, a substantial fraction of the reported warming in the U.S. simply disappears.”
And R Muller of Berkeley’ a former sceptic did a study ( backed by Watts who promised to abide by its findings – he didn’t) – this funded by the Koch’s – and found that ……”The Urban Heat Island effect is real. Berkeleys analysis focused on the question of whether this effect biases the global land average. Our UHI paper analyzing this indicates that the urban heat island effect on our global estimate of land temperatures is indistinguishable from zero.”
http://berkeleyearth.org/faq/
What is missing is NOAAs controversial role in promoting the U.N. plan to use global climate change as a way for the U.N. to oversee the redistribution of the worlds wealth and deindustrialize the West. (Note thats not my claimits their claim)
“De-industrializ[ing] the West” is entirely your claim.
I searched the draft report for mentions of “business,” “industry,” “industrial,” “corporate,” etc, and there are no remarks that corroborate your interpretation.
The “redistribution of the world’s wealth” is largely voluntary – like annual aid packages to developing countries. Some on the panel looked for binding regulations on anthro GHG emissions and didn’t achieve that because others on the [UN] panel prevented that happening.
So, not “the UN”, and not world de-industrialization.
Can we not descend to counter-propaganda? Just the facts, please.
“Can we not descend to counter-propaganda? …”.
LOL, whose “we”, whose blog is this anyway?
Ok.
Can you not descend to counter-propaganda? Just the facts, please.
Triops australiensis tell the truth about the “climate change” in Australia.
Prehistoric-looking shield shrimp emerge after heavy rains in Australia
BY EARTH TOUCH JANUARY 17 2017
Visit the deserts of Central Australia this week, and you’ll be transported to the Triassic. Unusually heavy rains have left the region’s red sands crawling with shield shrimp, the descendants of a family that dates back some 250 million years.
http://www.earthtouchnews.com/natural-world/natural-world/prehistoric-looking-shield-shrimp-emerge-after-heavy-rains-in-australia
Introduction
Beringia, a vast region stretching from the Lena River in Siberia to the Mackenzie River in the Yukon Territory [1, 2], is thought to have played a pivotal role in the initial dispersal of human populations from Asia to North America. The exact timing of the initial dispersal remains uncertain, however. Recent genetic and palaeogenetic analyses [310], as well as dental morphological evidence [11], confirm that human populations migrating into North America originated in Siberia. They also suggest that dispersing groups reached Beringia during the LGM (dated to ca. 18,00024,000 cal BP) where they were genetically isolated for up to 8,000 years before moving south of the ice-sheets into North America [311]. Unfortunately, archaeological support for the standstill hypothesis is scarce [12]. Recent archaeological discoveries prove that humans were able to adapt to high-latitude, Arctic environments by at least 45,000 cal BP [13]. The Yana River sites, in Siberia, demonstrate that modern human populations had reached Western Beringia by 32,000 cal BP [14, 15], i.e., well before the LGM. Human activity is not recorded again in Western Beringia until the post-LGM period, however, with occupations of two open-air sites, Berelekh and Ushki, dated to ca. 1413,000 cal BP [1618]. In Eastern Beringia, the oldest currently accepted human occupations occur in the Tanana valley (interior Alaska) at Swan Point, Broken Mammoth and Mead [1921], and at the Little John site, located 2 km east of the international border in the Yukon Territory [22]; these sites are no older than ca. 14,000 cal BP, however [1922]. The only potential candidate for an earlier, LGM occupation of Beringia is the controversial Bluefish Caves site.
http://journals.plos.org/plosone/article?id=10.1371/journal.pone.0169486
Experience has drawn a great lesson in humility.
The two pillars are observation and theory,inseparable from one another.
Observation gives constraints, theory forms a tool,but by no means a truth.
Only the scientific debate can decide,however, this question, which should not be the object of science alone,has recently taken a quasi-religious turn.
In the present state of science, it is impossible to divide the two points of view.
Except for some “well-thinking people” who like the followers of the papacy of old, want to judge the matter to a mystical eye.
Forgive my English, I am French.
Cordially,
“Bulk carriers Sinegorsk and Johann Mahmastal made a successful midwinter cargo crossing from Arkhangelsk to Russia’s northernmost port of Pevek, Chukotka, escorted by icebreakers Kapitan Dranitsyn and Admiral Makarov.
It was the first such crossing since Soviet times, and the ships delivered supplies for the supplies for the world’s first floating heat and power plant to be assembled in Chukotka after a journey lasting from 14 December to 7 January.
The ease of the sailing is seen as a sign that climate warming in the Arctic can open up shopping lanes even in midwinter. But the climate remains unpredictable as the four vessels have discovered on their return route.
They are currently trapped by sudden thick ice around Chukotka’s northernmost cape Shelagsky, some 24 nautical miles from Pevek, in some of Russia’s most exposed waters.”
https://wattsupwiththat.com/2017/01/19/russian-icebreakers-stuck-in-the-arctic-global-warming/
http://ocean.dmi.dk/anim/plots/ice.arc.1.png
“As thousands of demonstrators prepared to converge on downtown Los Angeles Friday to protest the inauguration of Donald Trump, the second in a trio of anticipated storms was already soaking much of the region.
“Any protests going on in Southern California will most likely be wet,” said National Weather Service forecaster Ryan Kittell. “People need to definitely take precautions, wear some rain jackets, bring umbrellas … it’s definitely going to be a wet day.”
The storm could deposit up to 2 inches of rain in Los Angeles by the end of the day.”
“The third and final storm was expected to arrive early Sunday morning and hit peak intensity in the afternoon. The storm could dump between 2 and 3 inches of rain in coastal valley areas, while some foothill areas could get 4 to 6 inches of rain, Kittell said.”
http://www.latimes.com/local/lanow/la-me-ln-rain-protests-20170120-story.html
http://www.accuweather.com/en/us/los-angeles-ca/90012/weather-radar/347625
In the end of January next attack arctic air south US.
http://files.tinypic.pl/i/00861/mgap9ruk7bhj.png
David Appell says:
January 19, 2017 at 8:32 PM
“Vincent, the experiments you described have been done and the results are not at all the positive benefits what you assume.
Higher CO2 tends to inhibit the ability of plants to make protein And this explains why food quality seems to have been declining and will continue to decline as CO2 rises because of this inhibition of nitrate conversion into protein. Its going to be fairly universal that well be struggling with trying to sustain food quality and its not just protein its also micronutrients such as zinc and iron that suffer as well as protein.”
———————————————————
David,
We’ve been through this before, but I’ll reiterate the following points which I believe are the basis for sound reasoning on this subject.
(1) Protein defiency is not a problem in developed countries. In fact, the opposite appears to be the case. People tend to eat more protein than is recommended, as well as more food in general, which causes a high percentage of obesity with consequent health effects.
http://www.pcrm.org/health/diets/vsk/vegetarian-starter-kit-protein
(2) Increasing plant growth by increasing the abundance of just one essential factor, whether CO2 levels or nitrogen fertilizer, will likely result in a lower proportion of minerals and micronutrients in the crop. That’s perfectly understandable. Does any farmer think that the amount of zinc, magnesium, iron, copper and other minerals in agricultural soils is unlimited and that one can continue reaping a harvest year after year without replenishing the minerals that are removed from the soil?
If a particular crop is found upon analysis to lack certain micronutrients, then for God’s sake add the appropriate minerals to the soil. There are many factors of soil health that need to be addressed in order to get the maximum crop yield in combination with maximum nutrition.
(3) Whilst it might be perfectly true that major crops such as rice and wheat have a lower proportion of protein content as a result of increased CO2 levels, the protein levels at best, in these crops, are very low and such foods are not eaten as a recommended source of protein.
If anyone wishes to get their protein requirements from plants instead of meat and fish, then the sorts of foods that are recommended are legumes such peas, beans and lentils.
You’ll be pleased to know, David, that legumes DO NOT suffer from reduced protein content with elevated CO2 levels. However they do suffer from a lack of macromineral and micromineral content if such minerals are lacking in the soil.
https://www.ncbi.nlm.nih.gov/pmc/articles/PMC2773101/
(4) There is an argument to be made that the undernourished people in certain undeveloped countries are the one’s who would suffer healthwise from elevated levels of CO2, but it’s a deeply flawed argument. REDUCING THE LEVELS OF CO2 WOULD NOT INCREASE THE TOTAL QUANTITY OF PROTEIN AND MINERALS AVAILABLE TO A SUBSISTENCE FARMER.
Reducing the levels of CO2 REDUCES the total quantity of protein and minerals, but not as much as it reduces the total quantity of carbohydrates, or the total biomass.
Imagine a situation where a subsistence farmer struggles to grow a sufficient quantity of food to feed his family. He grows just enough food to free his family from hunger, but the food is lacking in micronutrient content, and his wife has developed a goiter due to a lack of iodine in the soil.
Which do you think would be the best solution, David? Reduce the total quantity of food grown, by spending huge sums of money reducing atmospheric CO2 levels, or spend a small fraction of that money to add minerals to the soil so that the food is not deficient in macro and micronutrients?
If CO2 levels continue to build up, temperature will keep rising and precipitation patterns will keep changing.
How well do plants and farmers like that kind of thing?
Again, what’s the cost of not addressing climate change?
David,
As I’ve mentioned before, and provided evidence in the following paper, increased levels of CO2 provide the greatest increase in plant growth during dry conditions; up to a 62% increase in growth for water-stressed plants as a result of a doubling of CO2 levels.
http://www.sjsu.edu/faculty/watkins/CO2plants.htm
If it is the case that increased CO2 levels will eventually cause drier and hotter conditions, on average, globally, then we already know for certain that the increased growth resulting from that increase in CO2 will at least partially offset the disadvantages of the hotter and drier conditions.
We also know that any natural, non-anthropogenic climate change that results in hotter and drier conditions, WITHOUT A CORRESPONDING INCREASE IN CO2 LEVELS, will likely result in drastic food shortages.
There are many problems that mankind faces. Let’s tackle the known and certain problems first. After fixing those, we could then perhaps address the uncertain problem of rising CO2 levels if the evidence were to become clearer and more certain in the future that it is indeed a problem.
Climate change is, and will continue to be, the dominant problem of the 21st century. Ever more so as the century progresses.
There is no reason whatsoever the world can only work on one problem at a time, and letting CO2 continue unabated will only cause more problems, and make the other problems harder to solve.
We have to get to zero aGHG emissions as quickly as possible. In some ways (like sea level rise, melting Arctic) it is already too late to avoid big problems.
“Climate change is, and will continue to be, the dominant problem of the 21st century.”
Since you believe it, there is no way to dispute your believing.
Thus, Amen.
“We have to get to zero aGHG”
Stop breathe David, be the first.
Have a great day.
Massimo
P.S.
Of course my “stop breathe” was a joke, don’t do it if you really want have great days next!
😉
To Vincent. The believers in damaging global warming due to man-made carbon dioxide emissions believe that the warming will be due largely to globally increased atmospheric water vapour content. Globally that would mean hotter wetter conditions. The believers, however, have a nuanced belief on that. They believe that the currently dry localities will become hotter and dryer, while believing that the currently moist localities will become hotter and wetter.
There is no cost. Since it’s a non-problem it cannot have a cost.
What is the cost of Not going to church on Sunday for Christians? What is the cost of not doing the Cherokee Rain dance? What is the cost of not praying 5 times a day for Muslims? What is the cost of not sending a man to the moon ever again?
You really should find a new site to spend your trolling time.
This site is out of control due to intransigent trolls Appell, Nate and others that behave the same. The rest of you simply need to learn to stop taking the bait. The only thing they’re serious about is disrupting any comment with which they disagree. Simply ignore them.
Hi Roy.
I just stumbled across your site after doing a google search on volcanic vs. man-made CO2 emission levels.
Wow! What a find!
You’ve been added to my daily surf!
Keep up the great work!
Note that the work for which Perlmutter won the Nobel Prize, cosmic expansion, is being questioned.
http://www.nature.com/articles/srep35596
Interestingly, both the Nobel prize and BEST work are like reading patterns into tea leaves.
I do not understand why you are referencing Watt’s work on UHI, when it has been withdrawn.
Eisenhower Warned Us About Climate Scientists
https://co2islife.wordpress.com/2017/02/09/climate-science-on-trial-eisenhower-warned-us-about-climate-scientists/