Archive for October, 2018

Florida Major Hurricane Strikes: Still No Trend

Thursday, October 11th, 2018

Note: The first plot had Michael’s wind speed plotted incorrectly, which has been fixed.

I’ve updated a plot of Florida major hurricane strikes since 1900 with Hurricane Michael, and the result is that there is still no trend in either intensity or frequency of strikes over the last 118 years:

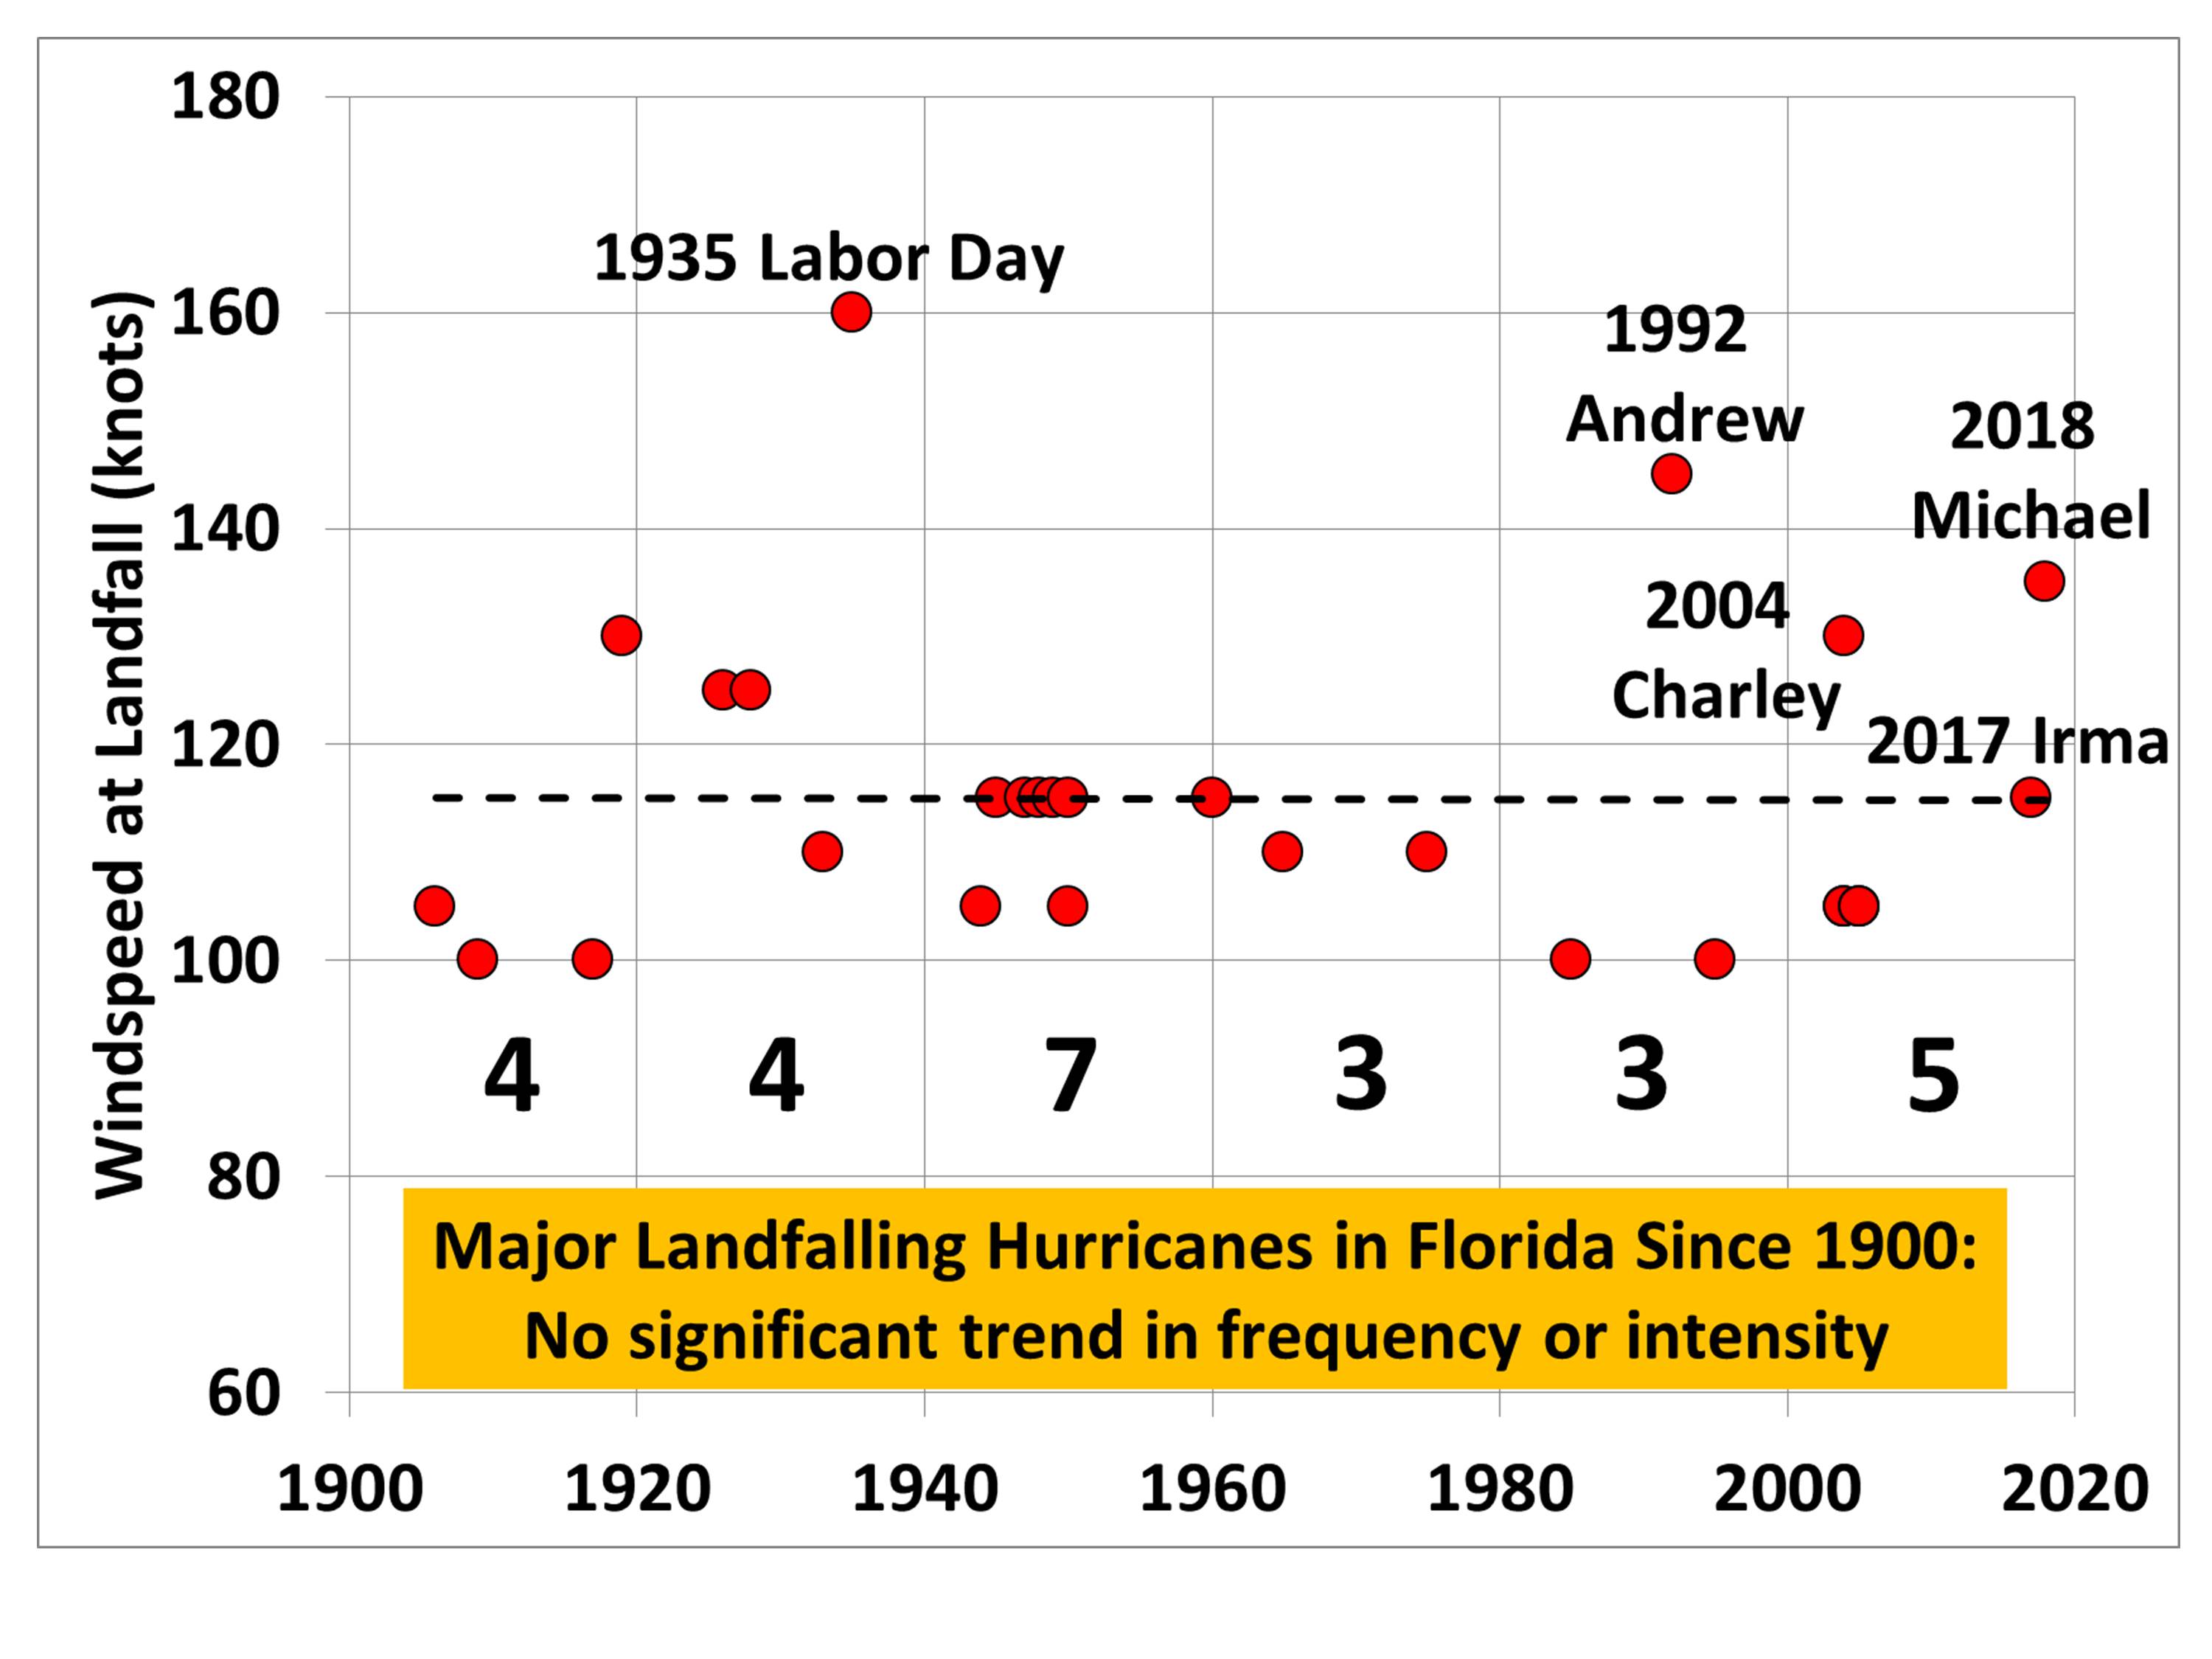
This is based upon National Hurricane Center data. The trend line in intensity is flat, and the trend line in number of storms (not shown) is insignificantly downward.

Nevertheless, the usual fearmongers are claiming Hurricane Michael is somehow tied to climate change.

After all, the Gulf of Mexico is unusually warm, right?

Yes, but if you look at the history of Jul-Aug-Sept average sea surface temperature (SST) anomalies over the eastern Gulf (available here, 25N-30N, 80W-90W), you will see that since 1860, this summer is only the 9th warmest in the eastern Gulf of Mexico.

Even more astounding is that out of the top 10 warmest Gulf years since 1860, 7 occurred before 1970, which is before we experienced any significant warming.

So, all the “experts” can do is make vague claims about how major hurricanes like Michael are what we can expect more of in a warming world, but the data show that – so far at least – the data do not support the theory.

Major hurricanes are part of nature. As evidence of this, I will also remind people of the study of lake bottom sediments in Western Lake in the Florida panhandle, not far from where Michael made landfall, that showed the last 1,000 years have been relatively quiet for Category 4 to 5 hurricanes, but the period from 1,000 to 3,400 years ago was a “hyperactive” period for intense landfalls at that location.

Hurricane strikes in the U.S. are notoriously variable, as evidenced by the recent (and unprecedented) 11+ year “drought” in major hurricane landfalls, which was finally broken in 2017.

Where were the claims that the hurricane drought was due to global warming?

Crickets.

Attributing the latest hurricane in any way to global warming is the ultimate in cherry-picking the data. In fact, they don’t even show the data.

Which brings us back to those vague claims by the experts.

UPDATE:

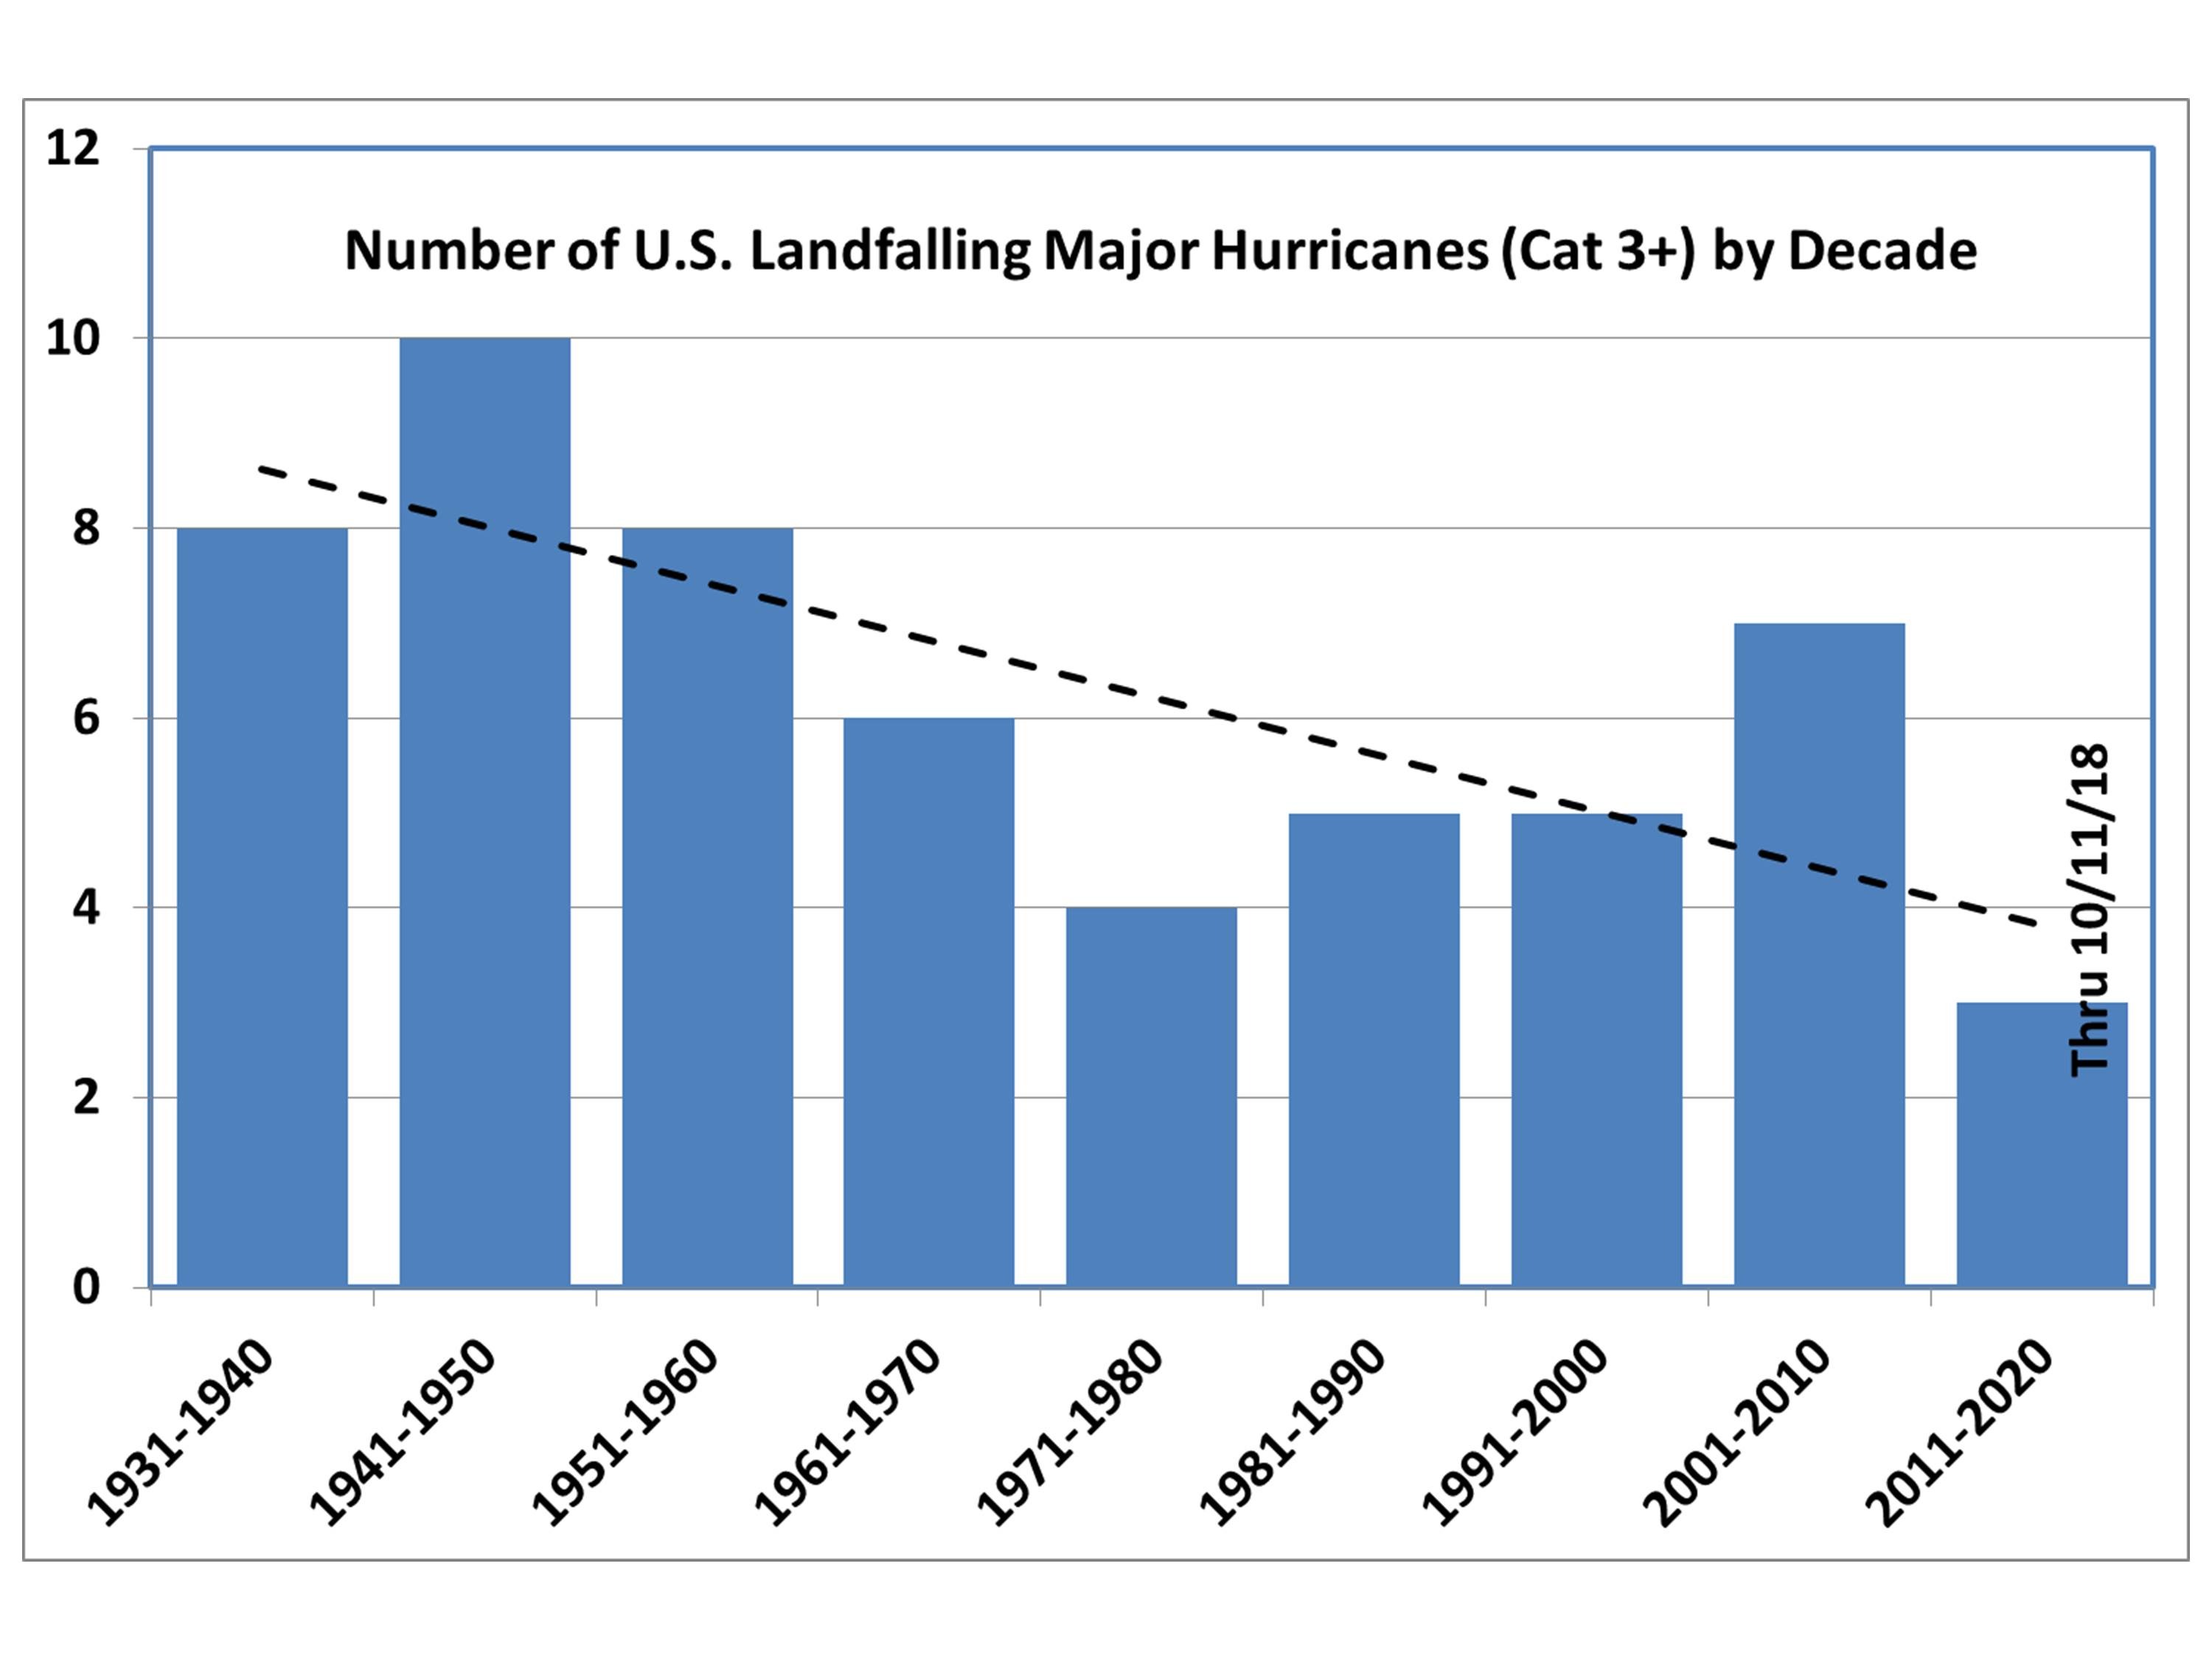
I also included Michael in the count of ALL U.S. landfalling major hurricanes, again from NHC data. The marked downward trend since the 1930s, 40s, and 50s is quite evident:

Where is the news story about THAT?

More crickets.

New Record Low Tornado Count as of October 3

Thursday, October 4th, 2018

NOAA’s Storm Prediction Center keeps a daily count of cumulative number of tornadoes in the U.S. each year, and recent years have had an unusually low number of tornadoes.

As of October 3, the cumulative total for 2018 is 759; the previous lowest number of tornadoes for this date was 761. The SPC has records extending back 65 years.

This lack of tornadic storms in recent years should also correlate with lesser severe thunderstorm activity in general in the U.S., since the conditions which produce large hail and damaging winds are generally the same as are required for tornadoes (strong instability, plentiful moisture, and wind shear).

UAH Global Temperature Update for September, 2018: +0.14 deg. C

Tuesday, October 2nd, 2018

Globally, the coolest September in the last 10 years.

The Version 6.0 global average lower tropospheric temperature (LT) anomaly for September, 2018 was +0.14 deg. C, down a little from +0.19 deg. C in August:

Global area-averaged lower tropospheric temperature anomalies (departures from 30-year calendar monthly means, 1981-2010). The 13-month centered average is meant to give an indication of the lower frequency variations in the data; the choice of 13 months is somewhat arbitrary… an odd number of months allows centered plotting on months with no time lag between the two plotted time series. The inclusion of two of the same calendar months on the ends of the 13 month averaging period causes no issues with interpretation because the seasonal temperature cycle has been removed, and so has the distinction between calendar months.

This was the coolest September in the last 10 years in the global average.

Some regional LT departures from the 30-year (1981-2010) average for the last 21 months are:

YEAR MO GLOBE NHEM. SHEM. TROPIC USA48 ARCTIC AUST
2017 01 +0.33 +0.32 +0.34 +0.10 +0.28 +0.95 +1.22
2017 02 +0.39 +0.58 +0.20 +0.08 +2.16 +1.33 +0.21
2017 03 +0.23 +0.37 +0.09 +0.06 +1.21 +1.24 +0.98
2017 04 +0.28 +0.29 +0.26 +0.22 +0.90 +0.23 +0.40
2017 05 +0.45 +0.40 +0.49 +0.41 +0.11 +0.21 +0.06
2017 06 +0.22 +0.33 +0.10 +0.39 +0.51 +0.10 +0.34
2017 07 +0.29 +0.31 +0.28 +0.51 +0.61 -0.27 +1.03
2017 08 +0.41 +0.40 +0.42 +0.46 -0.54 +0.49 +0.78
2017 09 +0.54 +0.51 +0.57 +0.54 +0.29 +1.06 +0.60
2017 10 +0.63 +0.67 +0.59 +0.47 +1.21 +0.83 +0.86
2017 11 +0.36 +0.34 +0.38 +0.27 +1.35 +0.68 -0.12
2017 12 +0.42 +0.50 +0.33 +0.26 +0.45 +1.37 +0.36
2018 01 +0.26 +0.46 +0.06 -0.11 +0.59 +1.36 +0.42
2018 02 +0.20 +0.25 +0.16 +0.03 +0.92 +1.19 +0.18
2018 03 +0.25 +0.40 +0.10 +0.07 -0.32 -0.33 +0.59
2018 04 +0.21 +0.31 +0.11 -0.12 0.00 +1.02 +0.69
2018 05 +0.18 +0.41 -0.05 +0.03 +1.93 +0.18 -0.40
2018 06 +0.21 +0.38 +0.04 +0.12 +1.19 +0.83 -0.55
2018 07 +0.32 +0.42 +0.21 +0.29 +0.51 +0.29 +1.37
2018 08 +0.19 +0.21 +0.17 +0.12 +0.06 +0.09 +0.25
2018 09 +0.14 +0.15 +0.14 +0.24 +0.88 +0.21 +0.18

The linear temperature trend of the global average lower tropospheric temperature anomalies from January 1979 through September 2018 remains at +0.13 C/decade.

The UAH LT global anomaly image for September, 2018 should be available in the next few days here.

The new Version 6 files should also be updated at that time, and are located here:

Lower Troposphere: http://vortex.nsstc.uah.edu/data/msu/v6.0/tlt/uahncdc_lt_6.0.txt
Mid-Troposphere: http://vortex.nsstc.uah.edu/data/msu/v6.0/tmt/uahncdc_mt_6.0.txt
Tropopause: http://vortex.nsstc.uah.edu/data/msu/v6.0/ttp/uahncdc_tp_6.0.txt
Lower Stratosphere: http://vortex.nsstc.uah.edu/data/msu/v6.0/tls/uahncdc_ls_6.0.txt