My previous post explaining a simple experiment to demonstrate that a cool object can make a warm object warmer still led me to give the experiment a try.
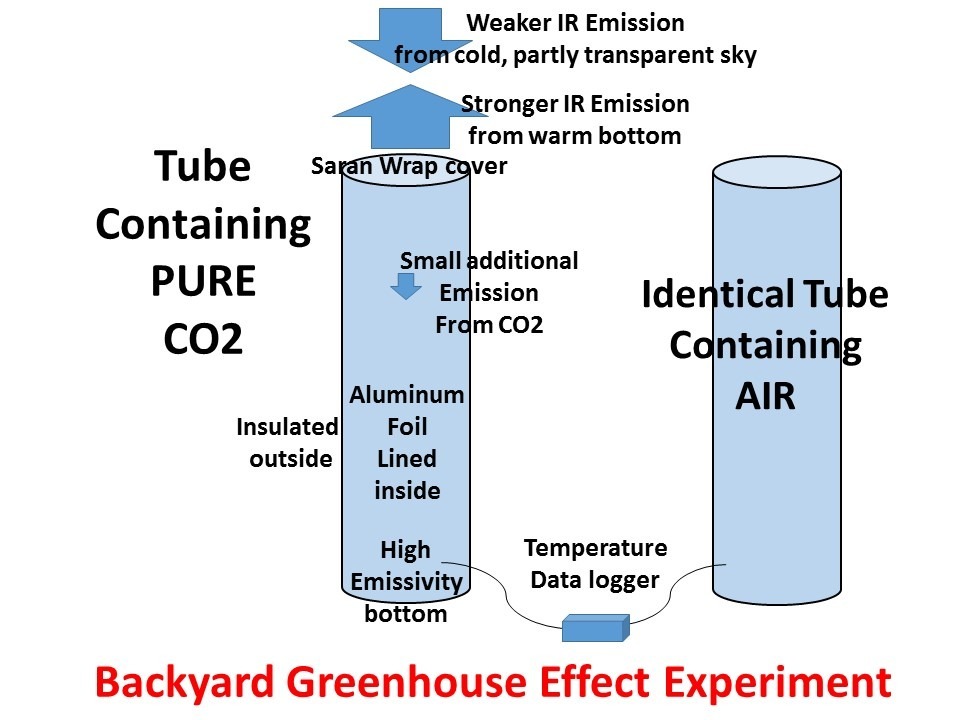
The purpose is to demonstrate that, energetically, the atmosphere’s greenhouse effect can make the surface of the Earth warmer than if the greenhouse effect didn’t exist even though the atmosphere is colder than the Earth’s surface. There is no violation of the 2nd Law of Thermodynamics, which states that the net flow of heat must be from higher to lower temperature, which does not preclude cooler object from emitting IR radiation in the direction of warmer objects.
If the atmosphere didn’t exist, the Earth’s surface would lose IR radiation directly to the cold depths of outer space, which is essentially at absolute zero temperature, and emits no energy back to the Earth; but instead the atmosphere, in effect, blocks some of that radiation, and emits some of its own IR radiation back towards the surface.
The net effect is that the surface and lower atmosphere cannot cool as rapidly to deep space, raising its average temperature.
The experiment shown below does not prove that greenhouse gases in the atmosphere perform such a function, only that it is not a violation of the 2nd Law of Thermodynamics for a cooler object emitting infrared radiation to keep a warm object warmer that it would otherwise be if the cooler object was not present.
The reason I am posting this is not to convince the rabid disbelievers, who are probably beyond hope. It is to reduce their influence on others. I’ve discussed all kinds of evidence here, the most convincing is just using a handheld infrared thermometer pointed upward at a “cold” clear sky, then measuring a warmer temperature when point it obliquely at the sky. That shows a cold object (the sky) can warm a surface (the thermopile in the handheld thermometer), even though the sky is colder.
Experimental Setup
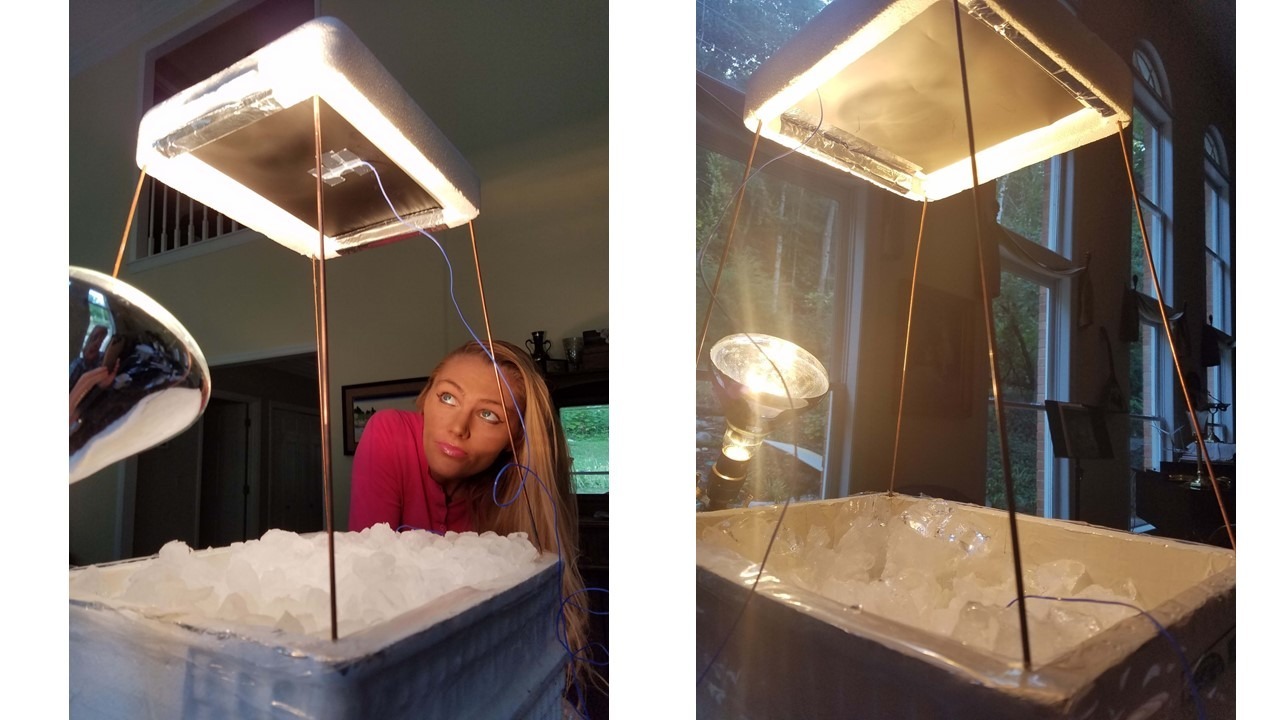
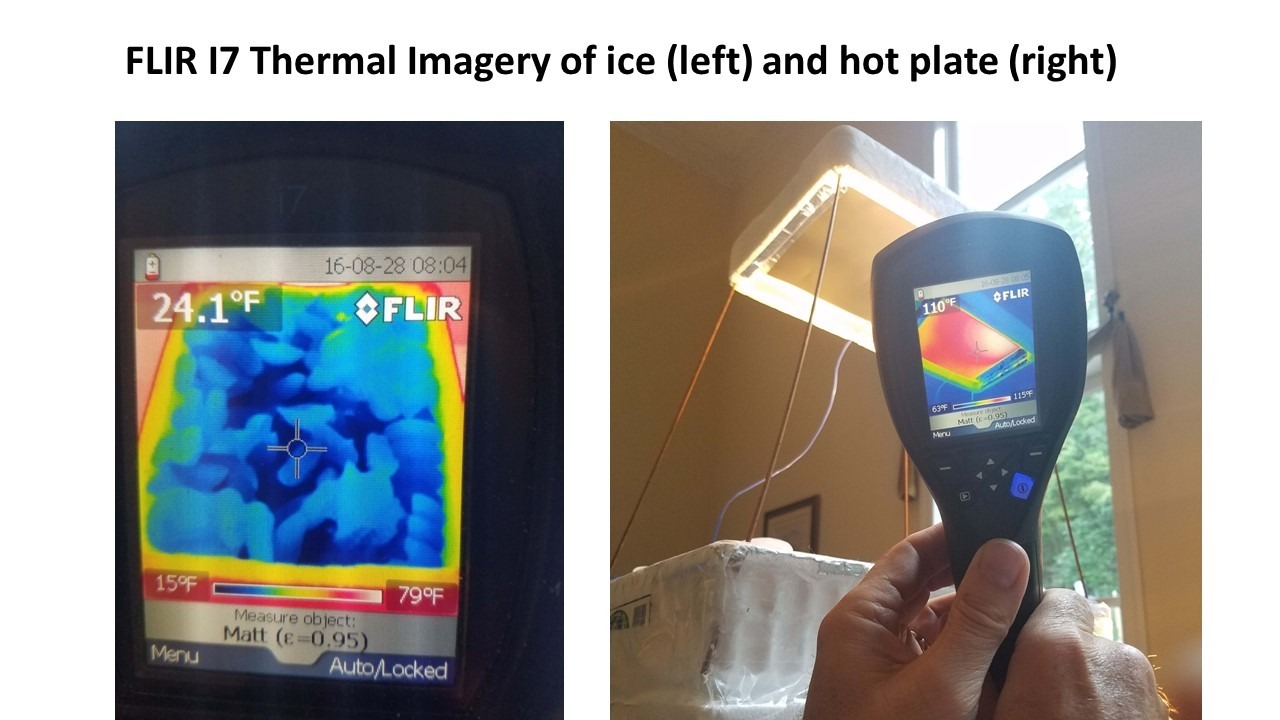
The following setup (assisted by one of my daughters) includes a metal plate, painted flat black, and heated with a 250 W flood light. The heated plate has exposed to it a Styrofoam cooler containing ice. The hot plate is kept above the ice to minimize any air convection effects on the results.

Fig. 1. Experimental setup to demonstrate a cooler object can make a heated object even warmer still.
Since a part of the heat budget of the heated plate is its loss of infrared energy to the cold ice, it should be possible to measure an increase in the temperature of the hot plate if the view of the ice is blocked with a second sheet (painted with very high IR emissivity paint, Krylon white #1502) at room temperature.
I tried two setups: the one on the left in Fig. 1 has the temperature probe scotch taped to the hot plate, but it did not stay firmly in contact with the plate, and also the steel plate I used exhibited large temperature gradients. On the right side of Fig 1, a better setup had the temperature probe firmly attached to the back with aluminum tape, and the metal sheet is aluminum flashing, painted flat black. The results presented below are for the arrangement on the right.
Flir thermal imager measurements of the setup late in the experiment are shown in Fig. 2, where we see the ice is generally below 32 deg. C F (it came from the deep freeze), and the heated plate (in the second phase of the experiment, results below) has a temperature around 110 deg F.
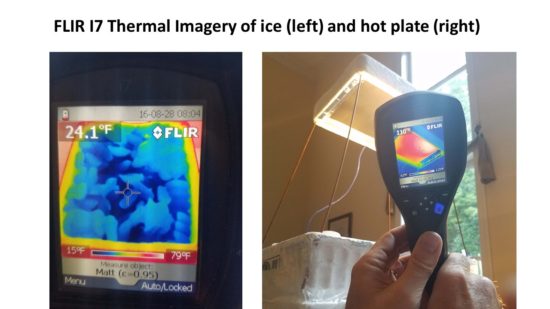
Fig. 2. Flir thermal imagery of ice and hot plate during the second portion of the experiment.
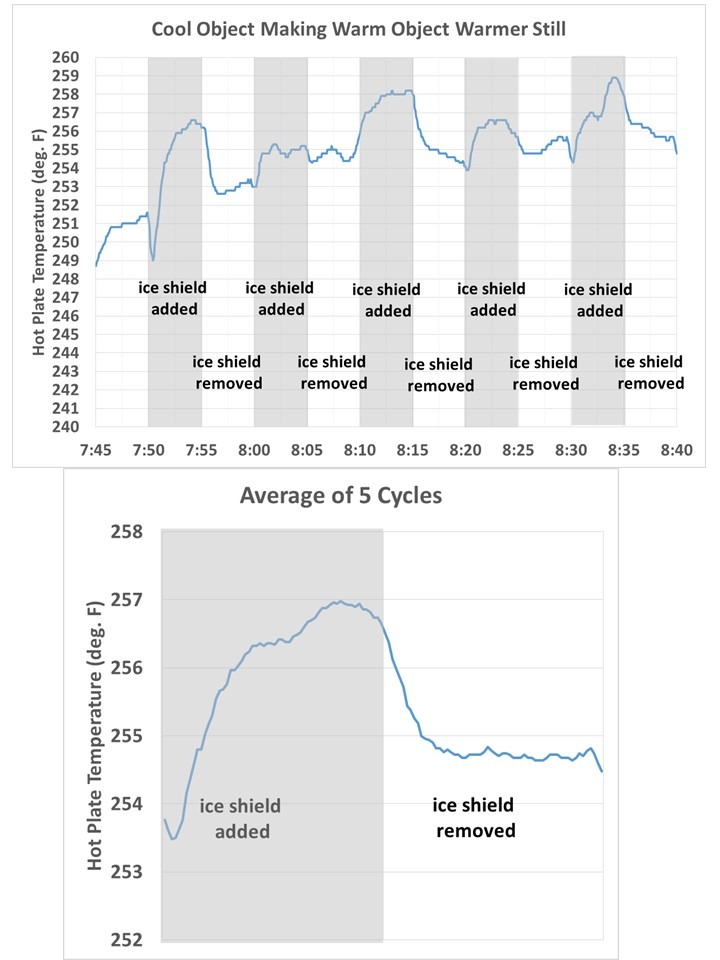
I recorded temperatures every 5 secs with the plate alternately exposed to a view of the ice for 5 minutes, then with the ice covered for 5 minutes. This cycling was repeated five times. The results are shown in Fig. 3. What we see is just what I would expect, that the temperature of the hot plate increases with time when its view of the ice is blocked by the room-temperature sheet.
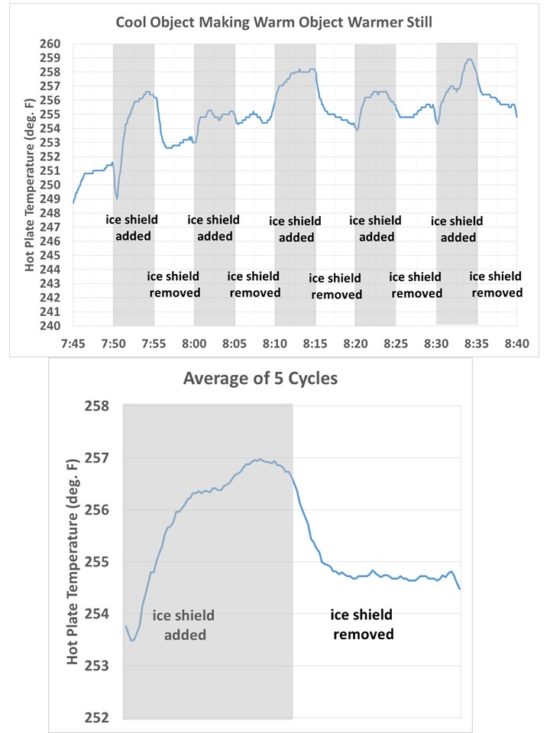
Fig. 3. Time series of temperature of the hot plate as it was alternately exposed to ice, then a room-temperature high-emissivity sheet, every 5 minutes.
Also shown in Fig. 3 are the results averaged over all five cycles, which smooths out some of the noise. The hot plate was so hot that just a small breeze of air from moving the room temperature sheet around the apparatus was found to cool the hot plate by a couple of degrees. The gradual warming trend was due to the ice slowly warming up over the ~1 hr period of the experiment.
Experiments like this often have sources of error when one tries to isolate a certain process. One concern would be whether the room-temperature sheet was slightly reflective to infrared radiation, which would cause the observed temperature effect by reflecting some of the hot-plate emitted IR radiation back on itself. I tested the sheet, which has very high infrared emissivity paint applied, by measuring its IR temperature with the Flir imager outside, both at right angles to the surface, and then at a ~45 deg. angle so the cold sky (today running in the mid-20s deg. F in the Flir measurements) could reflect off the sheet. There was no noticeable difference to a small fraction of a degree, so the paint appears to have an IR emissivity close to 1.0 and is indeed non-reflective in the infrared.
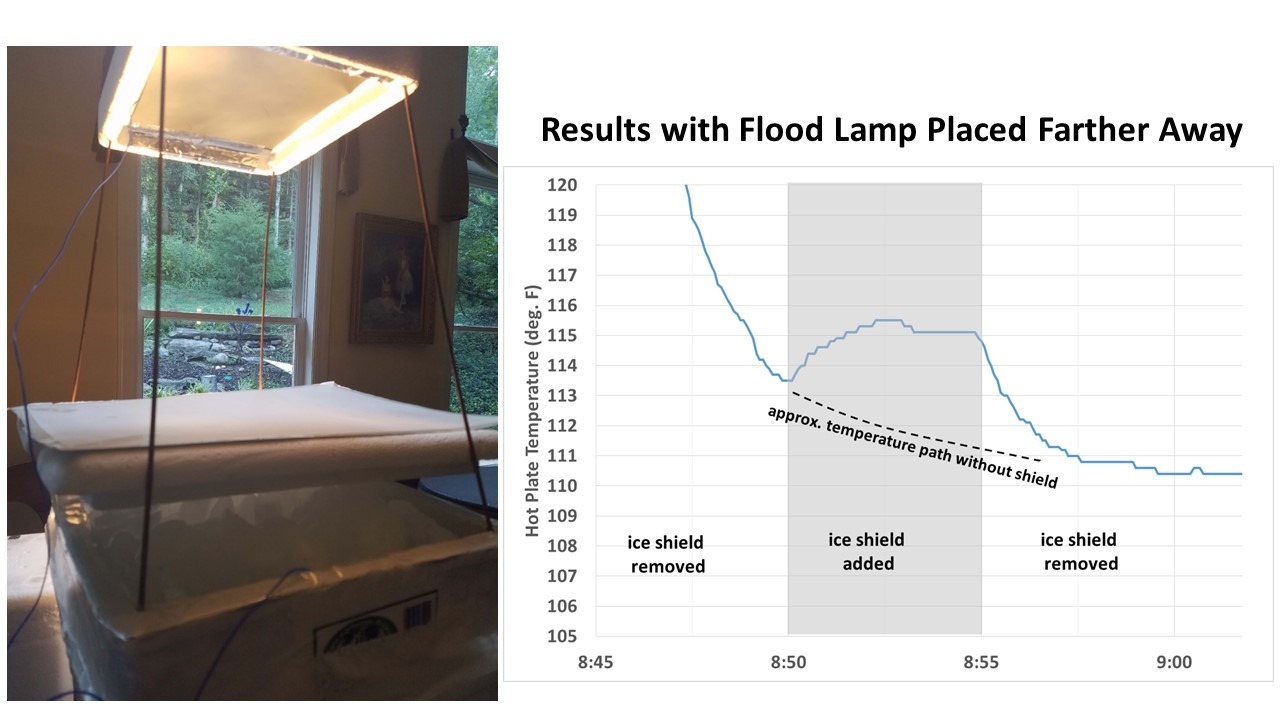
Another concern was the close proximity of the flood lamp to the ice and room temperature shield. If the shield was slightly more reflective to visible light than the ice, it could cause a little more heating of the hot plate. So I moved the lamp down and away from the setup so that there was little noticeable illumination of ice or shield (see the left side of Fig. 4). The hot plate cooled considerably since the lamp wasn’t nearly as close, but the effect of adding the shield was very clear with just one application, with temporary warming of the hot plate until the shield was again removed:

Fig. 4. Second setup where the flood light was place farther away from the plate it was heating, and the results of one cycle with the hot plate shielded from emitting IR toward the ice, then exposed to the ice.
It should be noted that heating a surface with incandescent bulbs will be mainly through infrared radiation, since their emission spectrum is more in the IR than at visible wavelengths. Halogen bulbs, which I did not use, have a somewhat closer spectrum to the solar spectrum.
Conclusion
There is no violation of the 2nd Law of Thermodynamics in the experiment; a cool object can make a warm object even warmer still through infrared radiative effects. The phenomenon can only happen, though, if the cool object replaces something that is even colder, and thereby reduces the rate at which the warm object loses infrared energy to its surroundings. In this experiment, the room temperature plate takes the place of the ice which still emits at around 300 Watts per sq. meter; in the climate system, the atmosphere takes the place of deep space, which emits energy at close to 0 Watts per sq. meter.
The heated plate is placed above the ice so that there is essentially no intermingling of ice-chilled air (which will flow downward) with hot plate-heated air, which will flow upward. Ideally, the experiment would be carried out in a vacuum chamber, so that conduction effects by air would not be present.
There are changes that would make the experiment work better:
1) Dry ice in the place of water ice, to provide a colder target for the hot plate to lose IR energy to;
2) use an open chest freezer (running) covered with a single layer of plastic wrap, so the temperature of the ice won’t increase with time;
3) cover the hot plate holder with plastic wrap, which is about 90% transparent to IR, but will reduce the variations in heat losses due to air currents.
4) if the ice can cover a greater portion of the hemisphere that the plate is losing IR energy too, the effect will be magnified. An open chest freezer would accomplish this, too.
NOTE TO COMMENTERS: I intend to delete any comments which include personal insults.
NOTE TO READERS OF COMMENTS: Some commenters here throw around technical terms and make grand assertions and detailed arguments which I consider fallacious. I do not have time to counter them all every time they arise, although I have addressed virtually all of them in other posts over the years.

 Home/Blog