
 Home/Blog
The last couple years have seen exceptional erosion along portions of the south shore of Lake Superior, especially where the ground is very sandy. The following photo was recently taken west of Whitefish Point in the eastern Upper Peninsula of Michigan, of a cabin built in the 1950s:
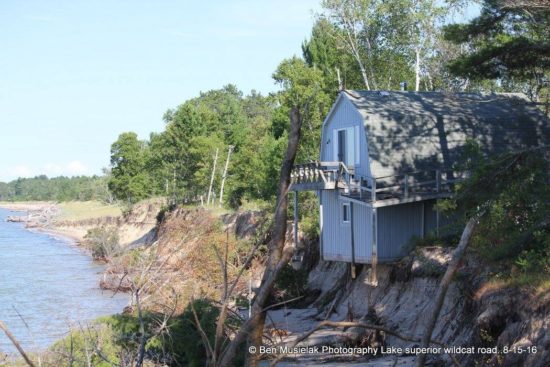
Erosion on the south shore of Lake Superior (Ben Musielak, Ben Musielak Photography, Paradise, MI).
While water levels have been on a slow, irregular decline for decades, there was a sudden rebound during 2013-2014 to near-record high levels:
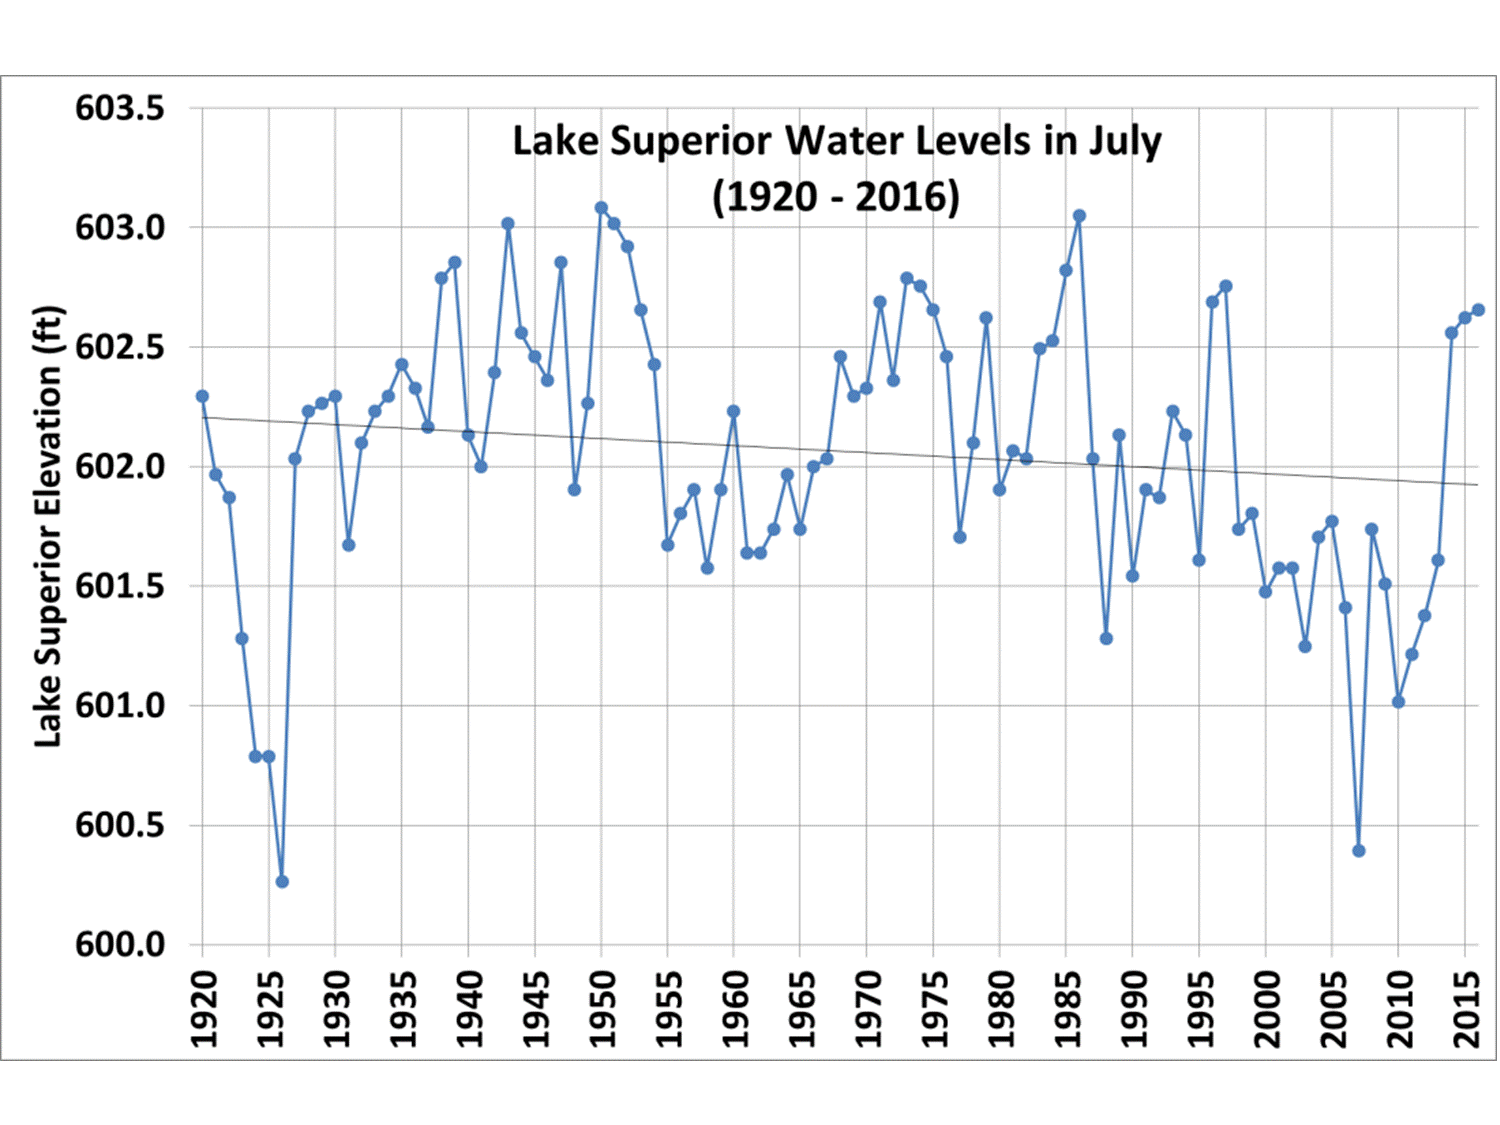
What caused this rapid rise? In fact, what controls the water level of Lake Superior on a year-to-year basis?
The hydrology depends upon many factors, both natural and human. Precipitation over the lake and the drainage basin feeding the lake, evaporation, and outflow through the rapids on the St. Marys River at Sault Ste Marie are the primary natural processes.
But locks built in the Sault in the 1800s also altered the natural lake levels, as well as contruction of a canal which feeds a hydroelectric power plant. Subsequent dredging of the shipping channels has also altered the flow. (Here’s an amazing high-resolution 1905 photo during a celebration of the locks, it still looks the same today…except for fences to keep idiots from falling in, and an observation deck).
Gates at the head of the power canal are raised and lowered to provide some human control over lake levels, and are raised to allow more water to flow out when lake levels are high. Many factors are weighed in deciding to adjust the flow out of Lake Superior, including the water level in the rest of the Great Lakes downstream, as well as Canadian concerns. The governing body for these decisions is the International Joint Commission (IJC).
For example, there has been much debate over water levels on Lake Erie, which have also been running high. If you let more water out of (much larger) Lake Superior, then the coastal interests along Lake Erie (which I suspect are much larger in number and politically more powerful) are going to be very concerned. The total population living along the lower lakes is about 15-20 times that living along Lake Superior, so you can see why interests along Superior aren’t the only ones deciding how much extra water will be allowed to flow out of the lake.
How Much Control Do We Have Over Lake Superior Levels?
Given that the Sault locks are there to stay, just how much control could we have over the water level in Lake Superior, if we wanted to?
The answer, it turns out, is not very much.
The river discharge out of Lake Superior through the St. Marys River has been running around 100,000 cu. ft./sec in the last couple of years. If you assume that we could change that rate at will by, say, 10%, and divide that into the number of square ft. covered by Lake Superior (~884,000,000,000), you will find that such a change in river discharge would only change the lake water level by 4 inches in one year. The above graph shows that much larger changes occur on the lake than this. Obviously, natural influences on water level are much larger than human influences.
I used to live on the lower St. Marys River, and can attest that when the lake level is high, so is the level of the lower river. I specifically remember the summer of 1973 (see above graph) when water on some days went up on our lawn and came close to our front door. Then, years after I moved away, low lake levels led to the shoreline going out about 100 ft. further from the house than normal.
The reason I mention this is that, when lake levels are high, there is an increase in river discharge out of the lake. That is the direction of causation: high lake levels => increased outflow. It is not: decreased outflow => high lake levels.
In other words, human manipulation of water flow out of Lake Superior is not the cause of high water levels…although we have some small amount of control to mitigate changes in lake levels, after they have occurred.
The Primary Control Knob: Precipitation
While I’m not a lake hydrology expert, I suspect that the balance between precipitation and evaporation is the governing factor in Lake Superior water level.
If we look at the average yearly precipitation departures from normal from the National Centers for Environmental Information website for the Upper Peninsula and northeast Minnesota averaged together, we find that the Lake Superior water level rises and falls depending upon excesses and deficits in precipitation:
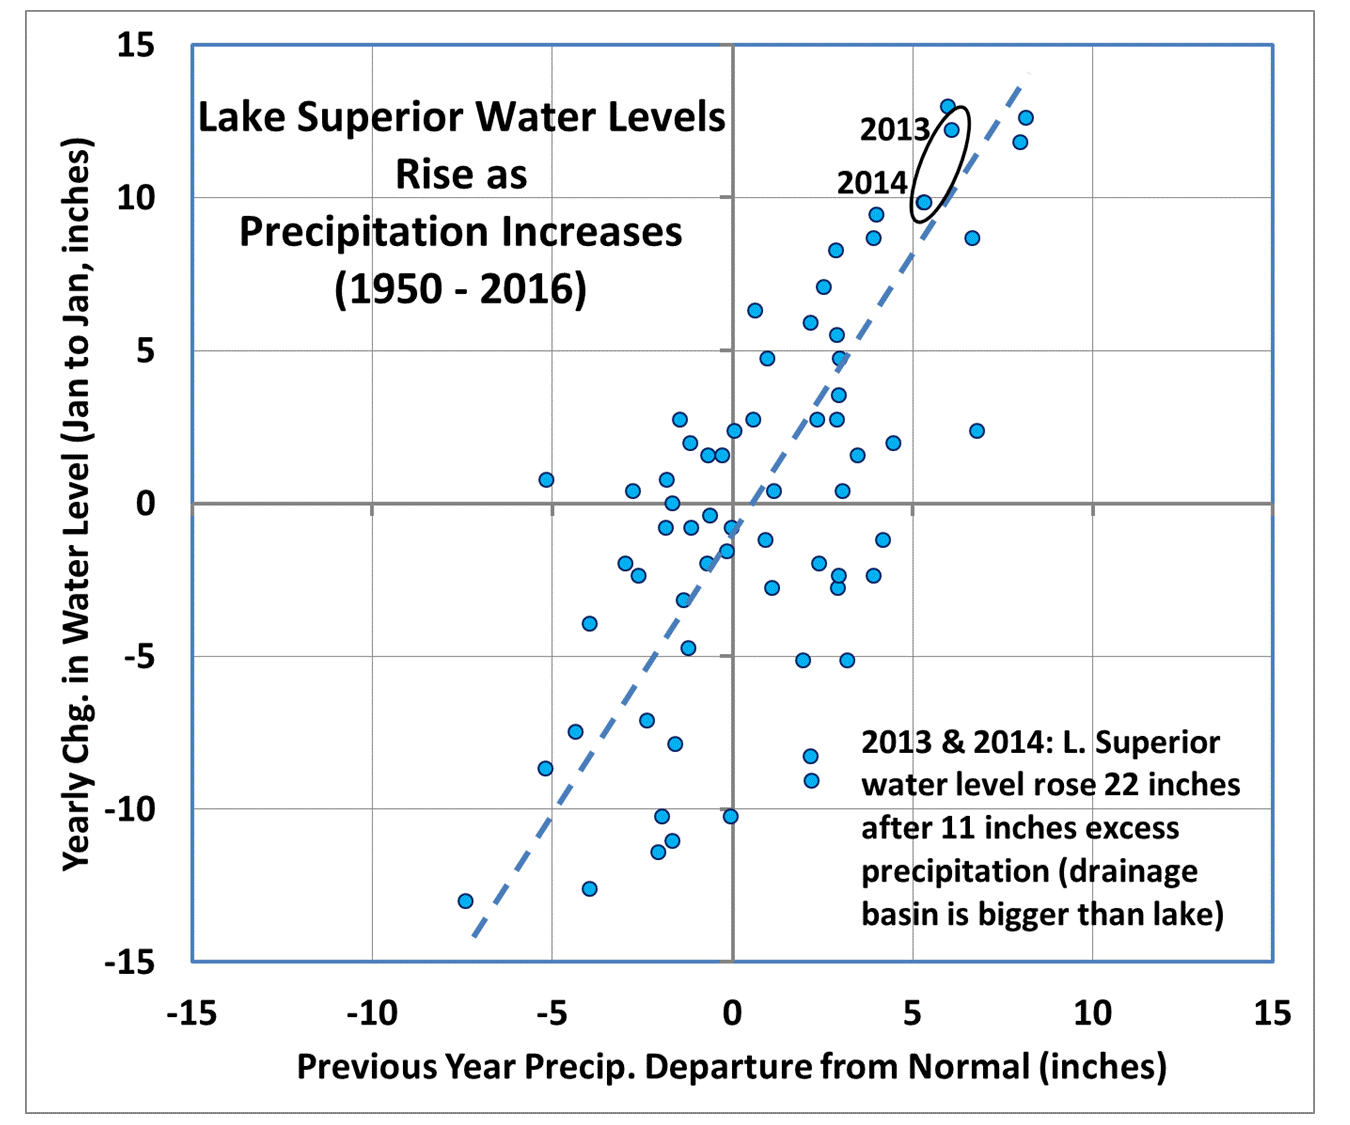
In fact, during the most recent rapid rise in water levels, a 2-year excess in precipitation of 11 inches led to a 22 inch rise in lake levels! This is pretty spectacular.
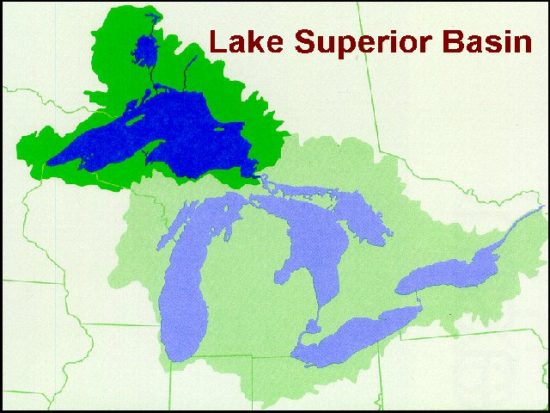
Why would the lake rise more than the precipitation? Because the drainage basin for Lake Superior is 1.55 times larger than the lake itself, and so some of the excess water that falls on the surrounding land flows into the lake, potentially more than doubling the lake level rise due to a precipitation increase:
How well this quantitatively explains things, I don’t know. I’m ignoring changes in evaporation, which would have to be estimated through some modeling assumptions.
The bottom line is that Mother Nature is largely in control of water levels on Lake Superior. Humans can help mitigate it somewhat by adjusting flow through the St. Marys River, and I believe that is already done, but I suspect that coastal interests along the lake simply have to live with the changes, which we have very little control over.
I have sent a few questions to the experts at the Great Lakes Environmental Research Lab (GLERL), and will update this post if I find out any additional information.


