Archive for May, 2018

Sea Level Rise: Human Portion is Small

Friday, May 25th, 2018

There is a continuing debate over sea level rise, especially how much will occur in the future. The most annoying part of the news media reporting on the issue is that they imply sea level rise is all the fault of humans.

This is why the acceleration of sea level rise is what is usually debated, because sea level has been rising naturally, for at least 100 years before humans could be blamed. So, the two questions really are (1) Has sea level rise accelerated?, and (2) how much of the acceleration is due to humans?

Yesterday’s spat between Gavin Schmidt and Willis Eschenbach dealt with the question of whether sea level rise has accelerated or not. Gavin says it has. Willis says not, or at least not by a statistically significant amount.

I’m going to look at the data in a very simple and straightforward manner. I’ll use what I believe are the same data they did (Church & White, from CSIRO, updated through 2013 here), and plot a trend line for the data before 1950 (before humans could reasonably be blamed), and one for the data after 1950:

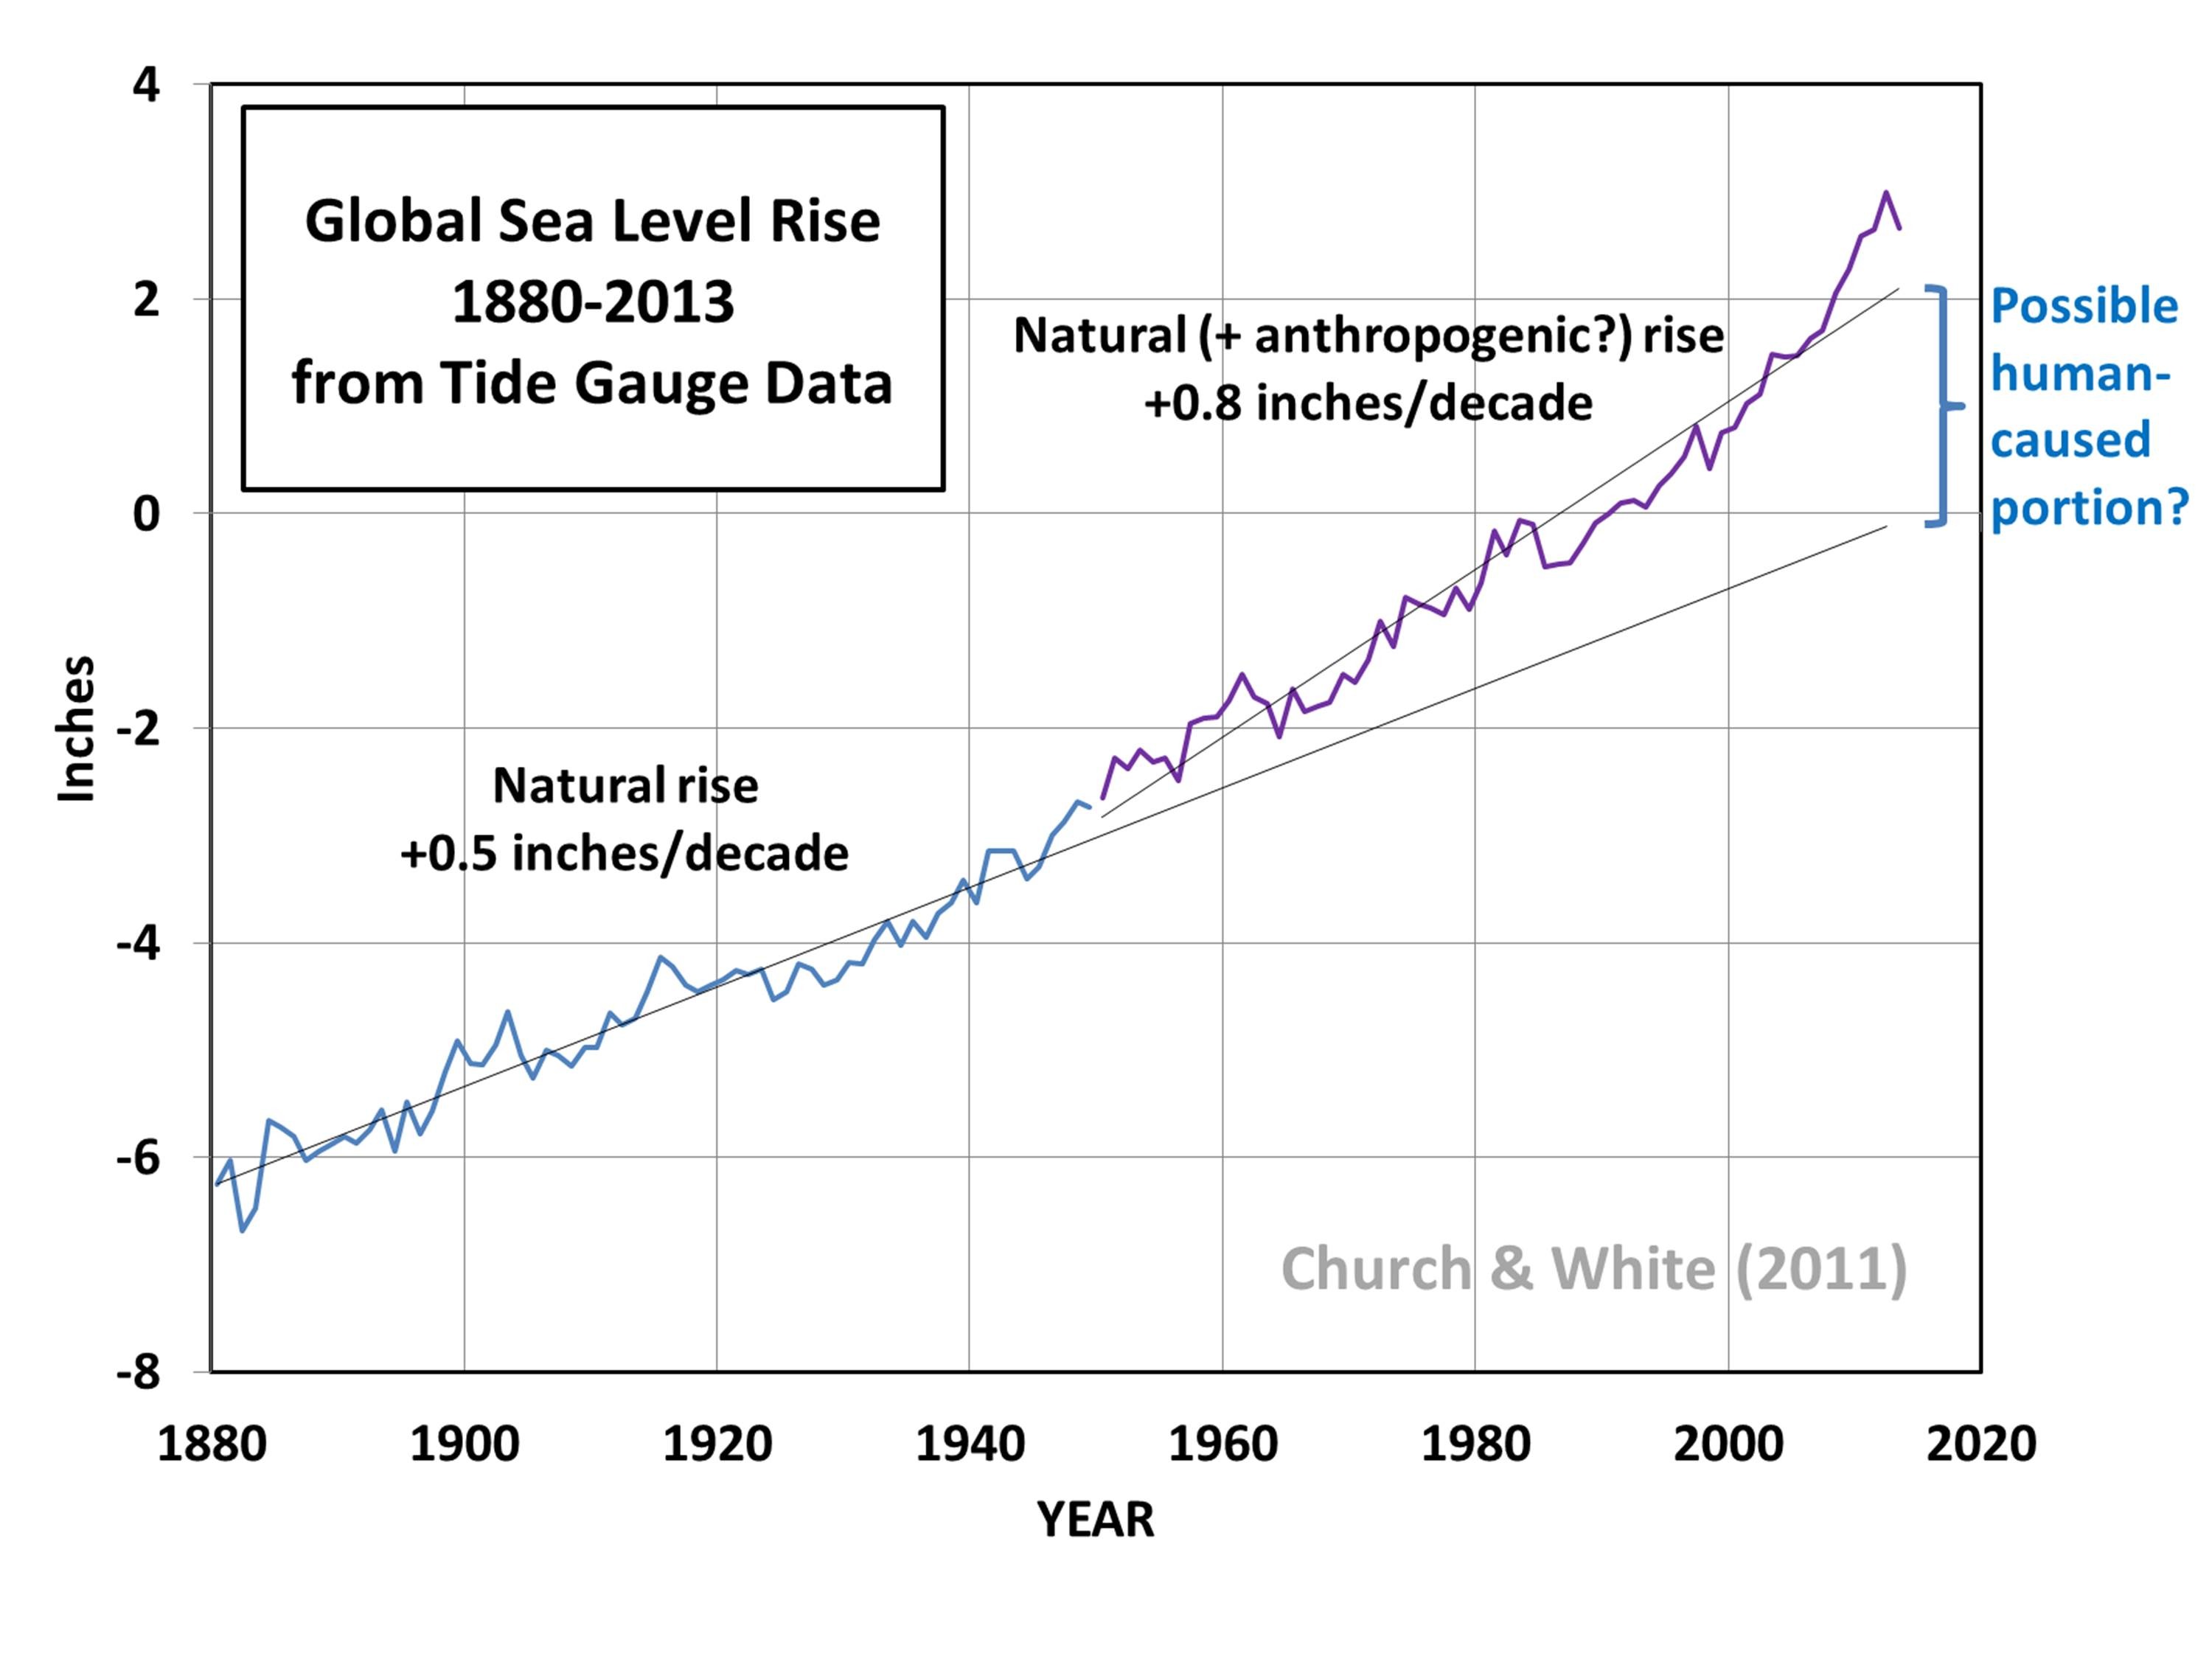
If we assume that the trend prior to 1950 was natural (we really did not emit much CO2 into the atmosphere before then), and that the following increase in the trend since 1950 was 100% due to humans, we get a human influence of only about 0.3 inches per decade, or 1 inch every 30 years.

Even though it looks like there is some evidence of even stronger acceleration more recently, sea level has varied naturally on multi-decadal time scales, and it is dangerous to extrapolate any short term trends far into the future. Climate models aren’t of much help in determining the human contribution because we have no idea how much of recent warming and glacial melt was natural versus human-caused. Models still can’t explain why glaciers started melting in the mid-1800s, just like they can’t explain why it warmed up so much from the mid-1800s to the mid-1900s.

The bottom line is that, even if (1) we assume the Church & White tide gauge data are correct, and (2) 100% of the recent acceleration is due to humans, it leads to only 0.3 inches per decade that is our fault, a total of 2 inches since 1950.

As Judith Curry mentioned in her continuing series of posts on sea level rise, we should heed the words of the famous oceanographer, Carl Wunsch, who said,


“At best, the determination and attribution of global-mean sea-level change lies at the very edge of knowledge and technology. Both systematic and random errors are of concern, the former particularly, because of the changes in technology and sampling methods over the many decades, the latter from the very great spatial and temporal variability. It remains possible that the database is insufficient to compute mean sea-level trends with the accuracy necessary to discuss the impact of global warming, as disappointing as this conclusion may be.”

NASA satellite reveals extensive Hawaii SO2 cloud

Tuesday, May 22nd, 2018

The eruption of Kilauea volcano on the Big Island of Hawaii has been unleashing a huge cloud of sulfur dioxide (SO2), which has been showing up in NASA’s Suomi satellite imagery every day. Yesterday, May 21, the cloud is shown here in false color, based upon measurements from the OMPS sensor on that satellite.

NASA Suomi satellite false-color imagery of the sulfur dioxide cloud flowing downwind from the eruption of Kilauea volcano on the Big Island.

Carried by the northeasterly trade winds, the SO2 cloud can be discerned in true-color imagery extending about 1,300 miles downstream. The eruption site is indicated by the red dot, where the satellite picks up a hot anomaly in its infrared channels.

In Defense of the Term “Greenouse Effect”

Wednesday, May 9th, 2018

Over the years I have gone along with the crowd and derided the term “greenhouse effect” as a poor analogy between the atmosphere’s ability to keep the Earth’s surfce warmer than it would be without IR-absorbing (and thus IR-emitting) gases, versus a greenhouse in which plants are grown.

But the more I think about it, the more I realize that “greenhouse effect” is a pretty accurate term.

The main objection has been that the warmth within a real greenhouse is primarily due to the roof’s ability to keep warm air from escaping, thus inhibiting convective heat loss. While that is true, it is also true of the atmospheric greenhouse effect.

Remember,

1) the roof of the greenhouse is also an IR absorber and emitter, like water vapor and CO2 do in the free atmosphere, and

2) the atmospheric greenhouse effect is only fully realized in the absence of convective heat loss.

Let’s start with that second point. As originally calculated by Manabe and Strickler (1964, see slide #10 here), the greenhouse effect does not explain the average surface temperature being 288 K (observed) rather than 255K (the effective radiating temperature of the Earth absent an atmosphere). Instead it is actually much more powerful than that, and would raise the temperature to an estimated 343 K (close to 160 deg. F.) It is convective heat loss generated by an unstable lapse rate caused by the greenhouse effect that reduces the temperature to the observed value.

This is the actual “greenhouse effect” on Earth’s average surface temperature: not the oft-quoted 33 deg. C, but more like 88 deg. C of warming. (We can quibble about the calculations of surface temperature with and without greenhouse gases because they make unrealistic assumptions about clouds and water vapor.)

The point is, the atmospheric greenouse effect is radiative only, and does not include the cooling effects of convective heat transport away from the Earth’s surface.

Kind of like in a real greenhouse.

So, this actually is what happens in a real greenhouse:

1) sunlight warms the interior

2) infrared radiation absorbed and emitted by the roof reduces radiative energy loss by the air and surfaces within the greenhouse

3) convective heat loss is minimized (although it is generated on the outside surface of the roof, thus keeping the interior cooler than if there was no convective heat loss at all)

So, all things considered, I think we need to embrace the “greenhouse effect” concept. Plants like it so much, we artificially enhance Nature’s greenhouse effect (which existed before greenhouses were invented) for their benefit.

Next, let’s pump some extra CO2 in there to help the plants even more.

UAH Global Temperature Update for April, 2018: +0.21 deg. C.

Tuesday, May 1st, 2018

The Version 6.0 global average lower tropospheric temperature (LT) anomaly for April, 2018 was +0.21 deg. C, down a little from the March value of +0.24 deg. C:

Global area-averaged lower tropospheric temperature anomalies (departures from 30-year calendar monthly means, 1981-2010). The 13-month centered average is meant to give an indication of the lower frequency variations in the data; the choice of 13 months is somewhat arbitrary… an odd number of months allows centered plotting on months with no time lag between the two plotted time series. The inclusion of two of the same calendar months on the ends of the 13 month averaging period causes no issues with interpretation because the seasonal temperature cycle has been removed, and so has the distinction between calendar months.

Some regional LT departures from the 30-year (1981-2010) average for the last 16 months are:

YEAR MO GLOBE NHEM. SHEM. TROPIC USA48 ARCTIC AUST
2017 01 +0.33 +0.31 +0.34 +0.10 +0.27 +0.95 +1.22
2017 02 +0.38 +0.57 +0.19 +0.08 +2.15 +1.33 +0.21
2017 03 +0.23 +0.36 +0.09 +0.06 +1.21 +1.24 +0.98
2017 04 +0.27 +0.28 +0.26 +0.21 +0.89 +0.22 +0.40
2017 05 +0.44 +0.39 +0.49 +0.41 +0.10 +0.21 +0.06
2017 06 +0.21 +0.33 +0.10 +0.39 +0.50 +0.10 +0.34
2017 07 +0.29 +0.30 +0.27 +0.51 +0.60 -0.27 +1.03
2017 08 +0.41 +0.40 +0.42 +0.46 -0.55 +0.49 +0.77
2017 09 +0.54 +0.51 +0.57 +0.54 +0.29 +1.06 +0.60
2017 10 +0.63 +0.66 +0.59 +0.47 +1.20 +0.83 +0.86
2017 11 +0.36 +0.33 +0.38 +0.26 +1.35 +0.68 -0.12
2017 12 +0.41 +0.50 +0.33 +0.26 +0.44 +1.36 +0.36
2018 01 +0.26 +0.46 +0.06 -0.12 +0.58 +1.36 +0.42
2018 02 +0.20 +0.24 +0.16 +0.03 +0.91 +1.19 +0.18
2018 03 +0.24 +0.39 +0.10 +0.06 -0.33 -0.33 +0.59
2018 04 +0.21 +0.31 +0.10 -0.13 -0.01 +1.02 +0.68

The linear temperature trend of the global average lower tropospheric temperature anomalies from January 1979 through April 2018 remains at +0.13 C/decade.

The UAH LT global anomaly image for April, 2018 should be available in the next few days here.

The new Version 6 files should also be updated in the coming days, and are located here:

Lower Troposphere: http://vortex.nsstc.uah.edu/data/msu/v6.0/tlt/uahncdc_lt_6.0.txt
Mid-Troposphere: http://vortex.nsstc.uah.edu/data/msu/v6.0/tmt/uahncdc_mt_6.0.txt
Tropopause: http://vortex.nsstc.uah.edu/data/msu/v6.0/ttp/uahncdc_tp_6.0.txt
Lower Stratosphere: http://vortex.nsstc.uah.edu/data/msu/v6.0/tls/uahncdc_ls_6.0.txt