Archive for August, 2011

The Al Gore Show: 24 Hours of Denying Reality

Monday, August 29th, 2011

Maybe the best way to summarize the main message of this post is this:

There have been no weather events observed to date – including Hurricane Irene — which can be reasonably claimed to be outside the realm of natural climate variability.

Now, you can believe – as Al Gore claims – that the present warm period we are experiencing has caused more hurricanes, more tornadoes, too much rain, too little rain, too much snow, too little snow, etc., but those are matters of faith, not of observable scientific reality.

Until a month or so ago, we were near record lows in global tropical cyclone activity, after a precipitous 6-year drop following the most recent 2005 peak in activity (click for full size version):

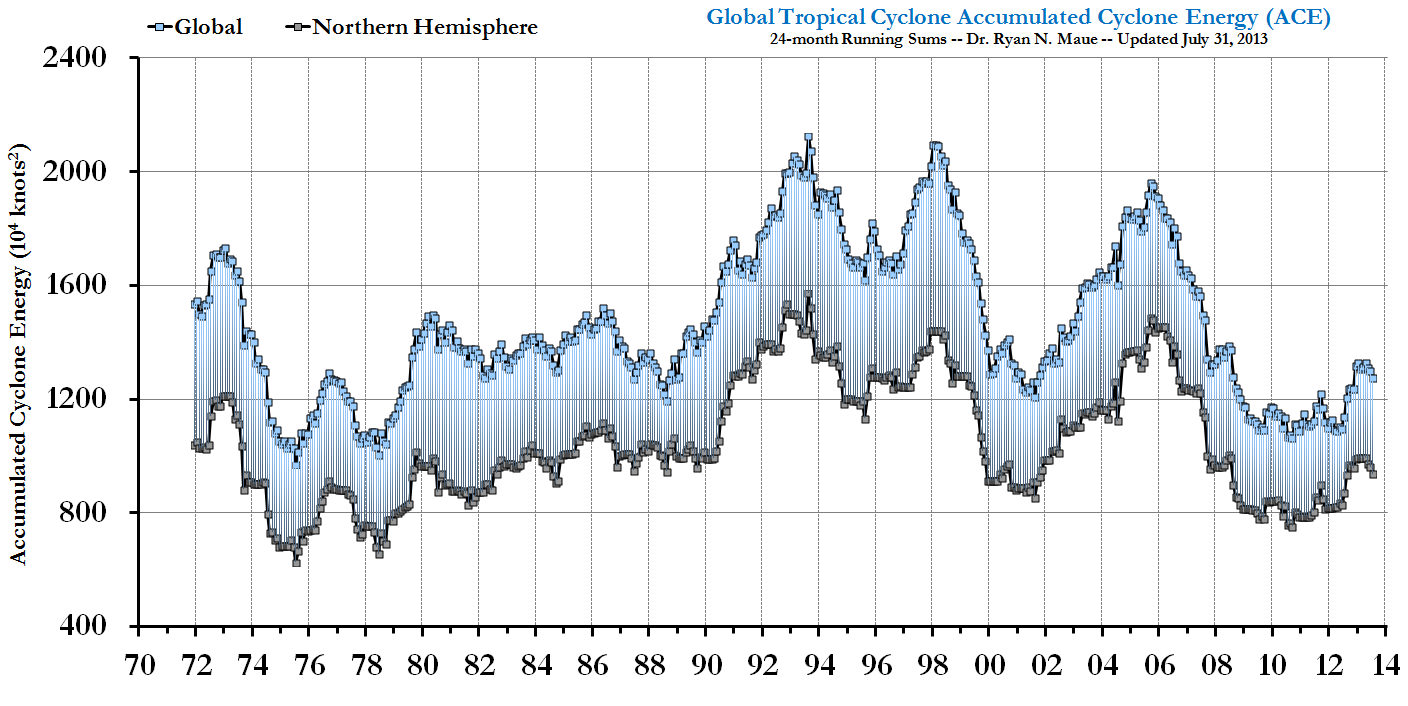
From what I can tell at Ryan Maue’s website, it sounds like global activity is now back up and running about normal.

Also, we have not had a Cat 3 or stronger hurricane make landfall in the U.S. in almost 6 years now, which is the longest ‘drought’ for U.S. landfalling major hurricanes on record.

There is even published evidence that the 1970s and 1980s might have experienced the lowest levels of hurricane activity in 270 years (Nyberg et al. 2007 Nature 447: 698-702), and that the 20th Century (a period of warming) experienced less hurricane activity than in previous centuries (Chenoweth and Divine 2008 Geochemistry, Geophysics, Geosystems).

Claims that warming “should” or “will” cause more hurricanes are based upon theory, that’s all. What I have listed are based upon historical events, which suggest (if anything) periods of warmth might also be periods of fewer hurricanes, not more.

24 Hours of Denying Reality

On September 14, Al Gore will host a “global” event called 24 Hours of Reality, which is part of his Climate Reality Project. As the website states:

“24 Hours of Reality will focus the world’s attention on the full truth, scope, scale and impact of the climate crisis. To remove the doubt. Reveal the deniers. And catalyze urgency around an issue that affects every one of us.”

From what I have been hearing, Mr. Gore will be emphasizing record weather events as proof of anthropogenic global warming. What most people don’t realize is that you can have a 100 year weather record event every year, if they are in different places.

Besides, as a meteorologist I must question the whole idea of 100-year event. Since even the longest weather station datasets only go back about 100 years, it is questionable whether we can even say what constitutes a 100-year event.

I especially dislike Gore’s and others’ use of the pejorative “denier”. Even some climate scientists who should know better have started using the term.

What exactly does Mr. Gore think we “deny”? Do we deny climate? No, we were studying climate since before he could spell the word.

Do we deny global warming? No, we believe it has indeed warmed in the last few hundred years, just like it did before the Medieval Warm Period around 1000 AD:

So what do we deny, if anything? Well, what *I* deny is that we can say with any level of certainty how much of our recent warmth is due to humanity’s greenhouse gas emissions versus natural climate variability.

No one pays me to say this. It’s the most obvious scientific conclusion based upon the evidence. When the IPCC talks about the high “probability” that warming in the last 50 years is mostly manmade, they are talking about their level of faith. Statistical probabilities do not apply to one-of-a-kind, theoretically-expected events.

I could have done better in my career if I played along with the IPCC global warming talking points, which would have led to more funded contracts and more publications.

It is much easier to get published if you include phrases like, “…this suggests anthropogenic global warming could be worse than previously thought” in your study.

In contrast, Mr. Gore has made hundreds of millions of dollars by preaching his message of a “climate crisis”.

I would say that it is Mr. Gore who is the “climate denier”, since he denies the role of nature in climate variability. He instead chooses to use theory as his “reality”.

What I worry about is what will happen if we get another Hurricane Andrew (1992) which hit Miami as a Cat 5, or Camille in 1969, also a Cat 5. The reporters will probably have heart attacks.

O’Reilly, O’Bama, and the O’Conomy

Monday, August 22nd, 2011

..or, It’s Not About Money…It’s Our Standard of Living

I just endured a rather inane discussion on the O’Reilly Factor with actor/pundit Wayne Rogers and economist/comedian/actor/pundit Ben Stein, over whether President Obama helps or hurts the economy.

The debate quickly turned, as it often does, to whether it would help the economy to tax the rich more.

What annoys me the most about such debates is that they equate “money” with our standard of living.

They are not the same thing.

If you think it’s about money, then let’s just have the government print a million dollars for every man, woman, and child, and we can all sit at home and order stuff over the internet.

Oh…except the stuff we want isn’t being made anymore, because all of the workers are at home ordering stuff over the internet.

The only way for us to raise our standard of living is for people to provide as many goods and services as possible to each other which are needed and wanted. (Money is just a convenient means of exchange of goods and services which almost never have equal value…otherwise, we could just barter).

And keeping our standard of living requires rewarding (1) innovation, and (2) efficiency. It almost always involves mass production…which means business — usually of the “Big” variety — which in turn requires lots of people having jobs.

Anything that government does which stands in the way of business being allowed to do what it does best hurts productivity, which in turn reduces our standard of living.

As long as people insist on arguing over where the ‘money’ will come from, rather than what needs to be done to raise our standard of living (or even just maintain it), we will continue to be misled by politicians who might be well intentioned, but are clueless about what is required for prosperity to exist.

You can learn more about such basic economic concepts — which have been known for centuries, but every generation seems to have trouble internalizing — in my book Fundanomics.

Deep Ocean Temperature Change Spaghetti: 15 Climate Models Versus Observations

Sunday, August 14th, 2011

The following comparison between the 20th Century runs from most (15) of the IPCC AR4 climate models, and Levitus observations of ocean warming during 1955-1999, further bolsters the case for a relatively low climate sensitivity: estimated here to be about 1.3 deg. C for a future doubling of atmospheric CO2. This is quite a bit lower than the IPCC’s best estimate of 3 deg. C warming.

But the behavior of the models’ temperatures in the deep ocean was not at all what I expected. They say “too many cooks spoil the broth”. Well, it looks like 15 climate modeling groups make spaghetti out of ocean temperature trends.

Deep Ocean Spaghetti

The deep-ocean temperature trends in the 15 models which had complete ocean data archived for the period 1955-1999 are surprising, because I expected to see warming at all depths. Instead, the models exhibit wildly different behaviors, with deep-ocean cooling just as likely as warming depending upon the model and ocean layer in question (click for the full-size version):


Three of the models actually produced average cooling of the full depth of the oceans while the surface warmed, which seems physically implausible to say the least. More on that in a minute.

The most common difference between the models and the observations down to 700 m (the deepest level for which we have Levitus observations to compare to) is that the models tend to warm the ocean too much. Of those models that don’t, almost all produce unexpected cooling below the mixed layer (approximately the top 100 m of the ocean).

From what I understand, the differences between the various models’ temperature trends are due to some combination of at least 3 processes:

1) CLIMATE SENSITIVITY: More sensitive models should store more heat in the ocean over time; this is the relationship we want to exploit to estimate the sensitivity of the real climate system from the rates of observed warming compared to the rates of warming in the climate models.

2) CHANGES IN VERTICAL MIXING OVER TIME: The deep ocean is filled with cold, dense water formed at high latitudes, while the upper layers are warmed by the sun. Vertical mixing acts to reduce that temperature difference. Thus, if there is strengthening of ocean mixing over time, there would be deep warming and upper ocean cooling, as the vertical temperature differential is reduced. On the other hand, weakening mixing over time would do the opposite, with deep ocean cooling and upper ocean warming. These two effects, which can be seen in a number of the models, should cancel out over the full depth of the ocean.

3) SPURIOUS TEMPERATURE TRENDS IN THE DEEP OCEAN This is a problem that the models apparently have not fully addressed. Because it takes about ~1,000 years for the ocean circulation to overturn, it takes a very long run of a climate model before the model’s deep ocean settles into a stable temperature, say to 0.1 deg. C or less. While some knowledgeable expert reading this might want to correct me, it appears to me that some of these models have spurious temperature trends, unrelated to the CO2 (and other) forcings imposed on the models during 1955-1999. This is likely due to insufficient “spin-up” time for the model to reach a stable deep-ocean temperature. Until this problem is fixed, I don’t see how models can address the extent to which the extra heat from “global warming” is (or isn’t) being mixed into the deep ocean. Maybe the latest versions of the climate models, which will be archived in the coming months, do a better job.

Of course, we would like to exploit process (1) to get an estimate of how sensitive the real climate system is, using the Levitus observations (green curve in the above plot). Unfortunately, the 2nd and 3rd processes causing temperature trends unrelated to upper ocean warming seem to be a real problem in most of these models.

Choosing the Best Subset of Models
Obviously, using models that produce a global net cooling of the oceans during a period of surface warming (1955-1999) cannot be expected to provide a useful comparison to observations. Maybe someone can correct me, but it appears those models do not even conserve energy.

For quantitative comparison to the Levitus observations, I decided to accept only those models whose monthly mixed layer temperature variations during 1955-1999 had at least a 0.7 correlation with the Levitus observations in the 0-50 m layer over the same period. In other words, I omitted the models that behaved least like the observations.

The remaining 4 models’ trends are shown in the next plot, along with their average (click for large version):

Note that the 4-model average (black curve) shows warming down to about 2,500 meters depth. Now that we have excluded the models that are the most unrealistic, we can make a more meaningful quantitative comparison between the Levitus observations (which I have extrapolated to zero warming at 3,000 m depth) and the models.

Estimating Climate Sensitivity from the Levitus Observations
As reported by Forster & Taylor (2006 J. Climate), the average surface warming produced by 2100 in these 4 models (based upon the SRES A1B emissions scenario) is 3.9 deg. C. If we scale that by the smaller amount of warming seen in the observations, you get the following plot for estimated warming by 2100 based upon averaging of the trends to various depths (click for large version):

While the Levitus observations in the mixed layer are consistent with the model predictions of about 3 deg. C of warming by 2100, the much weaker warming in the entire 0-700 m layer suggests a much lower rate of future warming: about 1.3 deg. C or so.

If I loosen the requirements on the number of models accepted, and include 9 (rather than 4) out of 15, the predicted rate of warming increases a little, to 1.5 deg. C.

Discussion
Since this result uses the IPCC models themselves to “calibrate” the Levitus observations, it cannot be faulted for using a model that is “too simple”. To the extent the average IPCC model mimics nature, the models themselves suggest the relatively weak ocean warming observed during 1955-1999 indicates relatively low climate sensitivity.

Previous investigators (as well as the IPCC AR4 report) have claimed that warming of the oceans is “consistent with” anthropogenic forcing of the climate system. But they did not say exactly how consistent, in a quantitative sense.

The IPCC AR4 report admits that the climate models tend to warm the deep ocean too much, but the report puts error bars on both the models and observations which overlap each other, so then it can be claimed the overlap is evidence of “agreement” between models and observations.

The trouble with the ‘overlapping error bars’ argument – which seems to be a favorite statistical ploy of the IPCC – is that it cuts both ways: the other ends of the error bars, where there is no overlap, will suggest even larger disagreement between models and observations than if no error bars were used in the first place!

Nothing is gained with the statistical obfuscation of using overlapping error bars…except to demonstrate that the models and observations do not necessarily disagree.

That is very different from saying they do agree.

THE BOTTOM LINE
It would be difficult to overstate the importance of the results, if they hold up to scrutiny: The observed rate of warming of the ocean has been too weak to be consistent with a sensitive climate system. This is demonstrated with the IPCC models themselves.

The resulting climate sensitivity (around 1.3 deg. C) just happens to be about the same sensitivity I have been getting using the simple forcing-feedback-diffusion model to match the Levitus observations of ocean warming during 1955-2010 directly.

Finally, it should be mentioned the above analysis assumes that there has been no significant natural source of warming during 1955-1999. If there has, then the diagnosed climate sensitivity would be even lower still.

I would be surprised if none of the climate modelers have performed a basic analysis similar to the one above. But since the results would be so damaging to the IPCC’s claims of much greater climate sensitivity (greater future warming) I would expect those results would never see the light of day.

Is Gore’s Missing Heat Really Hiding in the Deep Ocean?

Sunday, August 7th, 2011

NOTE: For those who are offended by my bringing up Al Gore in this post (but are apparently not offended by Gore falsely accusing scientists like me of being ‘global warming deniers’), I suggest you just focus on the evidence I present. You are invited to offer an alternative explanation for the evidence, but I will not allow you to divert attention from it through irrelevant “copy and paste” factoids you have gathered from other scientific publications. If you persist, I will be forced to adopt the RealClimate tactic of deleting comments, which so far I have been able to avoid on this blog. We’ll just call it “fighting fire with fire”.

As I and others have pointed out, the 20th Century runs of the IPCC climate models have, in general, created more virtual warming in the last 50 years than the real climate system has warmed.

That statement is somewhat arguable, though, since the modelers can run a number of realizations, each with its own “natural” year-to-year internal climate variability, and get different temperature trends for any given 50-year period.

Furthermore, uncertainty over how fast heat is being mixed into the deep ocean also complicates matters. If extra surface heating from more CO2 is being mixed deeper and faster than the modelers have assumed, then climate models warming the surface too fast in the past 50 years does not necessarily mean we will not see their forecasts come true eventually.

As Kevin Trenberth has recently alluded to, it only delays the day of reckoning.

Are More Expensive Models Better?
I have tried in recent posts to estimate climate sensitivity by using a simple forcing-feedback-diffusion model, and tuning it to match observations (which is exactly what the Big Boys do), but it appears that our critics will always question the validity of a simple model, even though it contains the same fundamental physics the IPCC models must also abide by.

So, let’s skip the simple model entirely, and just compare the IPCC climate models to the observations.

IPCC Models versus Ocean Observations, 1955-2000
Since so many people are now pointing to ocean heat content increases, rather than surface warming, as a better index of how sensitive our climate system is, let’s see how observed ocean warming compares to the warming simulated by two very different IPCC climate models.

We have begun analyzing the deep ocean temperature output from the 20th Century runs of the IPCC AR4 climate models. The first we chose were one of the most sensitive models (IPSL-CM4) and one of the least sensitive models (NCAR PCM1).

There is a simple way to use these models to get some idea of what the observed ocean warming tells us about climate sensitivity.

We can simply compare each of the models’ rate of ocean warming during 1955-2000 to their known climate sensitivity, and then see what the warming rate in the Levitus ocean temperature observations suggests for a climate sensitivity in the real climate system.

The following plot shows the temperature trends, as a function of ocean depth, between 1955 (when the ocean observations start) and 2000 (when the climate model experiments end) for those 2 models as well as in the Levitus observations (click for larger version):

Clearly, the most sensitive model (IPSL-CM4) warms the ocean the most, the least sensitive model (NCAR PCM1) warms the ocean much less, and the Levitus observations appear to exhibit the least warming. (NOTE: I have linearly extrapolated the Levitus observations from the deepest reported level, 700 m, to an assumed zero trend at 2,000 m depth.)

If we compute the average warming trends for the 0-700 m layer for the 2 models, and compare them to the known sensitivity of those models, we get the 2 blue dots in the following plot (we will be adding as many models to this as possible later; click for larger version):

If we then use the model relationship between 1955-2000 warming and climate sensitivity (the solid line), we see that the warming trend in the Levitus observations fall on that at a climate sensitivity of 1.3 deg. C.

If you are wondering what the results are if we go deeper, from 700 meters to 2,000 meters deep (keeping in mind we have assumed that the observed warming goes to zero at 2,000 m depth), the answer is that it is nearly the same: 1.4 deg. C, rather than 1.3 deg. C.

This is similar to the kinds of numbers I have been getting recently using a simple forcing-feedback-diffusion model and matching the Levitus observations directly with it. This level of warming is below the 1.5 deg. lower limit that the IPCC has set for total warming in response to 2XCO2.

Obviously, we need to add more of the IPCC models to this comparison, which we will be doing in the coming weeks, to see if there is indeed a strong relationship between model warming and model sensitivity, which there should be if the different models used similar climate forcings.

But the results should not depart too much from what is shown above because the line must go through (0,0) on the graph (zero climate sensitivity means zero warming), and the upper end of the line will be fixed by the 3 most sensitive IPCC climate models, of which IPSL-CM4 is one.

Could Climate Sensitivity be even Lower?
The above analysis assumes there have been no natural forcings of warming. But to the extent that recent warming was partly due to some natural process, this would mean climate sensitivity is even less.

Discussion
Once again we see evidence that the IPCC models are too sensitive, which means they are predicting too much warming for our future, which means Mr. Gore needs to chill out a bit.

Also, the list of modelers’ potential excuses for their models warming more than observed is rapidly dwindling. For example,

1) If the above results are any indication, it is unlikely the heat is hiding in the deep ocean.

2) Blaming Chinese coal-fired power plants for a lack of warming is just taking the modelers anthropocentrism to an even higher plane. There seems to be no good evidence to support such a claim anyway.

3) Another trick the IPCC uses is to put error bars on both the observations and the on the model results until they overlap. It is then claimed that models and observations “agree” to within the margin of error. But what they don’t realize with this last bit of statistical obfuscation is they are also admitting that there is a HUGE disagreement between models and observations when one goes to the other end of those error bars.

“Overlapping error bars” is the last resort for getting two numbers to appear to agree better than they really do.

It’s time for climate modelers to face up to the explanation they have been avoiding at all cost: the climate system is simply not nearly as sensitive as they claim it is.

If they ever have to admit the climate system is insensitive, it is the end of the IPCC and the policy changes that institution was originally formed to advance.

A Step in the Right Direction: Backing off of Anthropocentrism in Climate Research

Friday, August 5th, 2011

Yesterday’s press release from the UK Met Office introduces 2 new papers in Geophysical Research Letters which explain the recent lack of ocean warming, approximately since 2003. Most of the pause in warming is attributed to natural ENSO (El Nino-Southern Oscillation, that is, El Nino and La Nina) activity.

First of all let me say I agree with them. It is a step forward for the “skeptics” side of the global warming debate that the climate modelers finally admit that nature can have a role in global warming and cooling episodes… although they seem to be limiting that role to approximate 10-year time scales.

This at least a step in the right direction, since previously climate modelers would not admit to ENSO causing much more than year-to-year variability. Our own ocean modeling research, in progress, is suggesting that about 30% of the ocean warming trend since the 1950s is due to a shift to more frequent El Nino activity in the second half of that period, while the lack of ocean warming in the last 8 years appears to be from a shift back to La Nina activity.

So, the new GRL papers are one more step toward what some of us have been saying all along: Mother Nature is perfectly capable of causing her own climate change. The big question is: HOW MUCH of the ocean warming in the last 50 years has been due nature?

SOME UNANSWERED QUESTIONS
While I am supportive of these 2 papers from the standpoint of acknowledging the roll of El Nino and La Nina in global temperature change, these are just the first 3 issues that come to mind.

1) Both studies discuss the fact that even in the climate models, one does not necessarily expect warming in every decade in response to increasing CO2.
QUESTION: Since this is something that should have been known for about the last 20 years of climate modeling activities, why did they wait till warming stopped to mention it?

2) As you can see in Fig. 1 from the Katsman and Oldenborgh paper, they ignored the first 20 years of ocean heat content data, for the obvious reason that the observations showed no warming, while all of their model simulations indicated considerable warming. The reason they gave was a lack of good data before 1969.
QUESTION: What if the ocean observations DID show warming during those first 20 years? Would those years have been included in the analysis then, since they agreed with the model? Isn’t this rather obvious cherry picking?

3) In the same article, we see the following statement regarding the specific cause of a lack of ocean warming since 2003: “During 2002–2007, a series of El Niño events occurred, which probably yielded a larger than average upper ocean heat loss…” Excuse me? I believe they have this backwards…
QUESTION: If El Nino leads to a net LOSS of upper ocean heat, then why during this same period does a positive MEI index (indicating El Nino) precede WARMING of the 0-700 m ocean layer, as shown in the following plot (click for large version)?

This is how we were able to match the Levitus ocean heat content variations… by including a heat storage term where El Nino leads to heat gain, and La Nina leads to heat loss:

And, since there has been more frequent El Nino activity since the 1980’s, this is consistent with some of the warming being natural. Then, since 2000, this has begun to switch to more La Nina’s, resulting in the most recent slowdown in ocean warming.

What I fear is that because of this mistake in interpretation (the authors were merely postulating why recent warming stopped based upon the statistical behavior of climate models), that others will now point to that publication and claim it showed El Nino causes net cooling of the ocean, not warming. Sheesh.

Oh well, at least these papers represent at least a partial retreat from the IPCC’s anthropocentric view of the climate system.

UAH Global Temperature Update July, 2011: +0.37 deg. C

Monday, August 1st, 2011

How ironic..a “global warming denier” reporting on warmer temperatures 😉

The global average lower tropospheric temperature anomaly for July, 2011 increased to +0.37 deg. C (click on the image for a LARGE version):

Even though the Northern Hemisphere temperature anomaly cooled slightly in July, as did the tropics, warming in the Southern Hemisphere more than made up for it:

YR MON GLOBAL NH SH TROPICS
2011 1 -0.010 -0.055 +0.036 -0.372
2011 2 -0.020 -0.042 +0.002 -0.348
2011 3 -0.101 -0.073 -0.128 -0.342
2011 4 +0.117 +0.195 +0.039 -0.229
2011 5 +0.133 +0.145 +0.121 -0.043
2011 6 +0.315 +0.379 +0.250 +0.233
2011 7 +0.372 +0.340 +0.404 +0.198

For those who want to infer great meaning from large month-to-month temperature changes, I remind them that much of this activity is due to natural variations in the rate at which the ocean loses heat to the atmosphere. Evidence for this is seen at the end of the sea surface temperature record through last month, which has a down-tick during the recent up-tick in atmospheric temperatures:

Global Sea Surface Temperature through July:
Here are the SST anomalies from AMSR-E on the NASA Aqua satellite (note the different base period, since Aqua has been flying only since 2002…click for a larger version):