Archive for July, 2024

An unusually warm year or two cannot be blamed on climate change

Wednesday, July 17th, 2024
NOAA Climate Data Assimilation System (CDAS) July 2024 surface air temperature departures from 30-year normals, as of July 17, 2024 (graphic courtesy of Weatherbell.com).

That title might trigger some people, so let me explain. Yes, in a warming world due to increasing CO2 there will be a statistical increase in “unusually warm” years. But assuming the warming is entirely due to steadily increasing CO2 causing a slight (currently ~1%) energy imbalance in the climate system, then the warming that results is about ~0.02 deg. C per year.

Anything different from that small 0.02 deg. C per year warming is due to natural climate variability.

This can be easily demonstrated with a simple 1D energy balance model. Anything different is due to natural weather and climate variability.

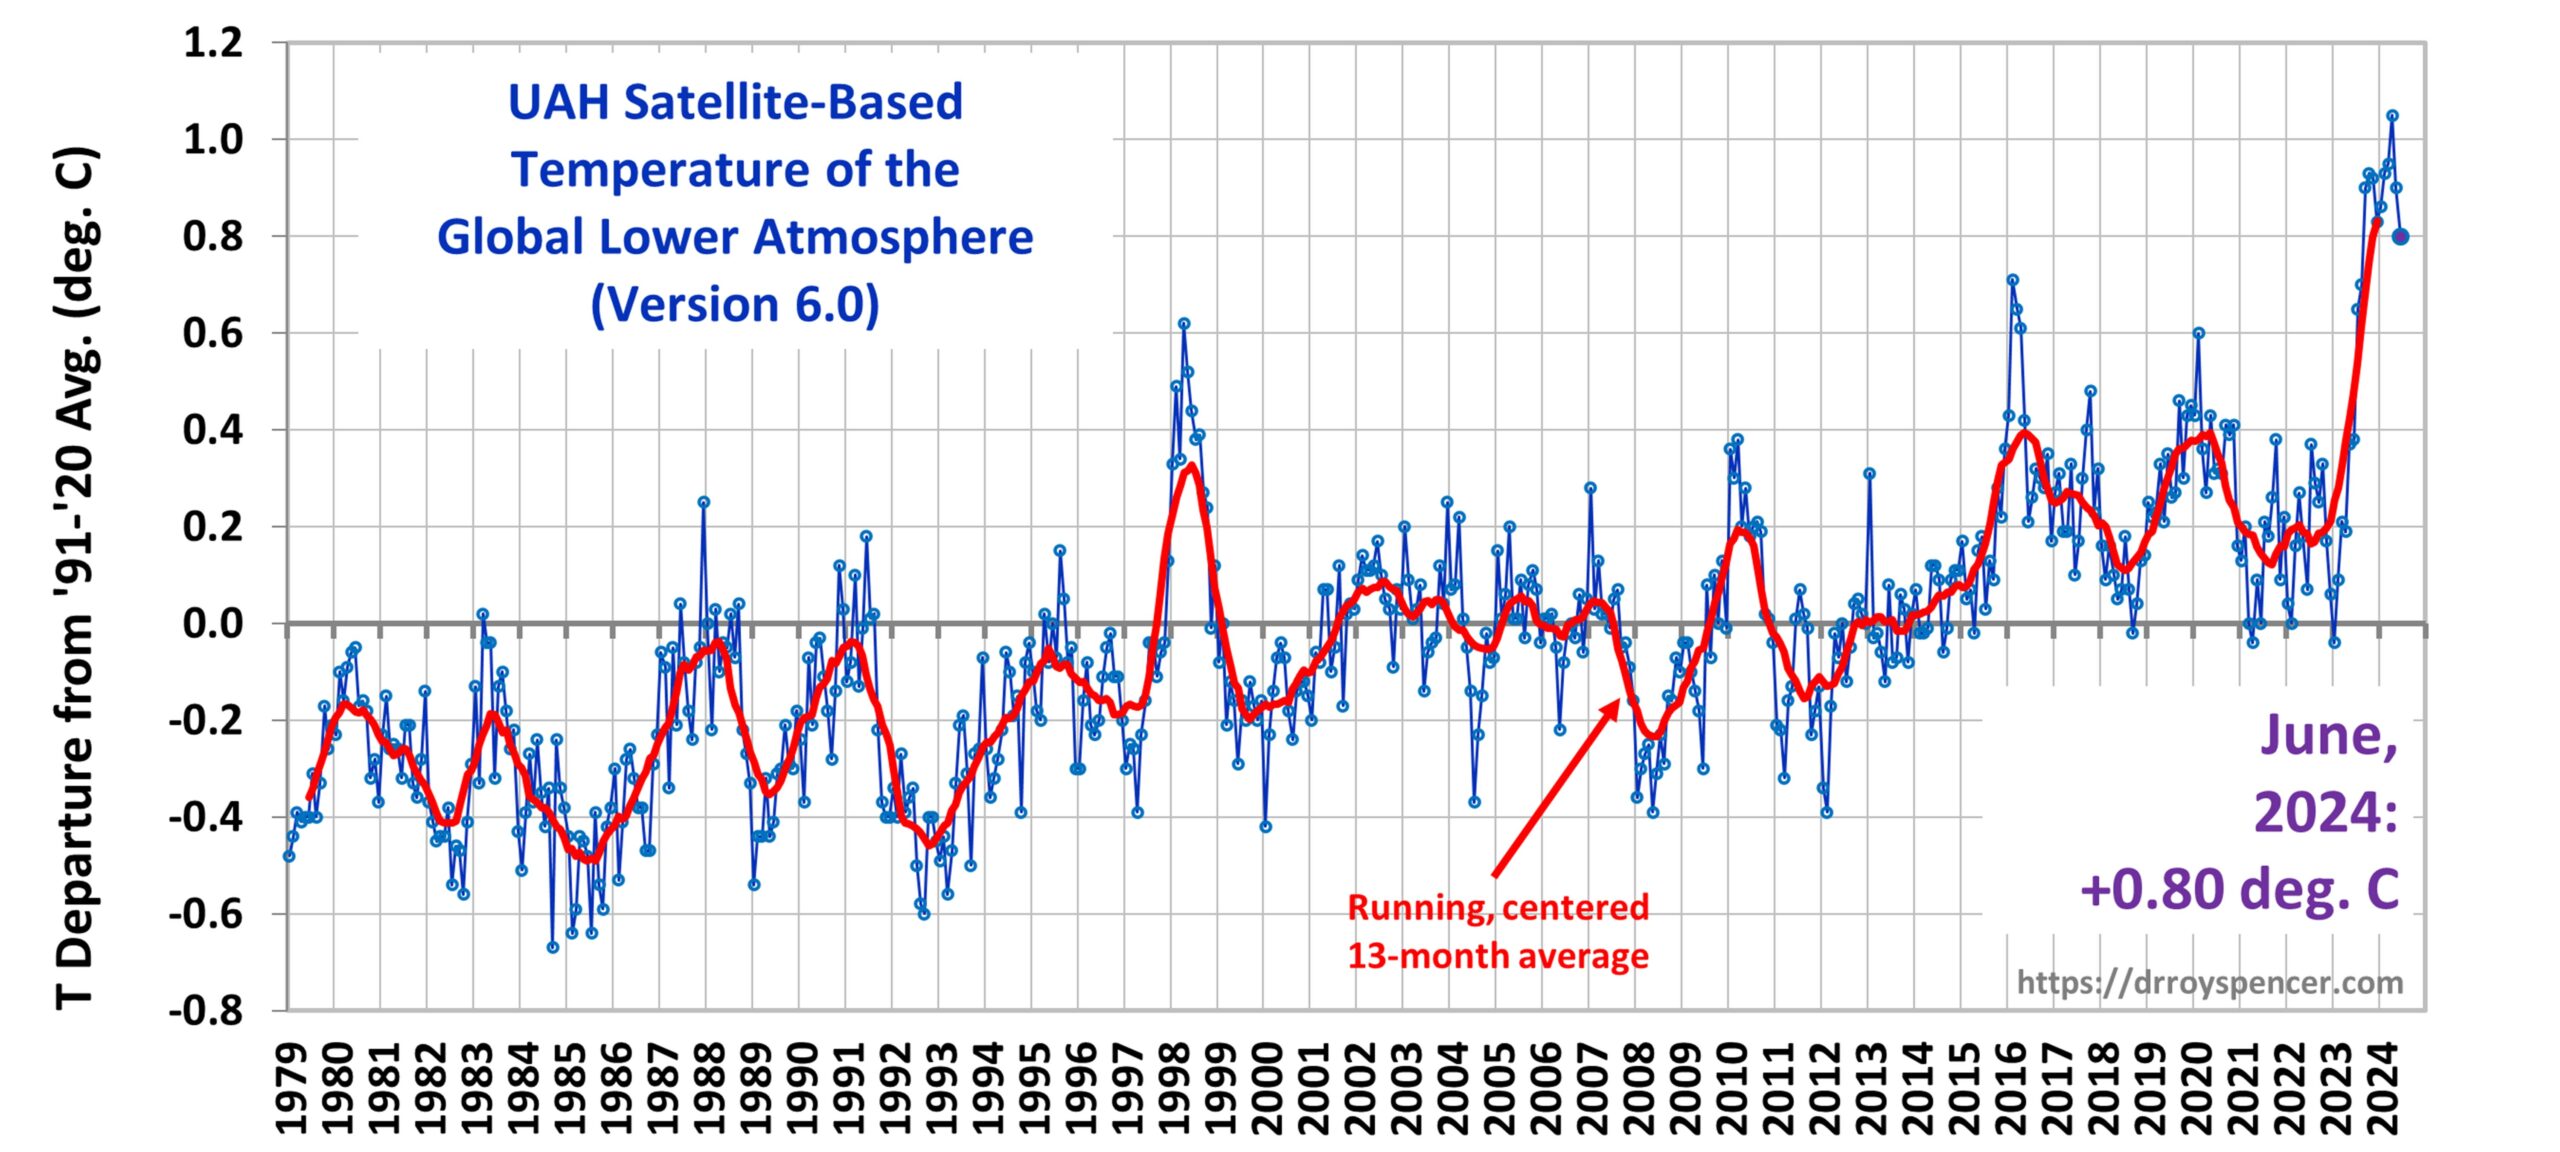
If we take our UAH global lower tropospheric temperature product as an example, 2023 was a whopping +0.51 deg. C above the 1991-2020 average. Using our trend of +0.14 deg. C per decade as a warming rate baseline, then 2023 should have been +0.25 deg. C above the baseline, but instead it was twice as warm as that. So, about half that warmth was natural (AGAIN… assuming the background warming trend is 100% due to humans).

So, when we get a really warm year (like 2023, and probably 2024) then something other than CO2 is mostly to blame. All of the media and environmentalist hype is just noise. Really warm years will be offset by cooler years (which no one reports on because it’s not newsworthy) so that the long term temperature trends remains ~0.02 deg C per year of warming (+0.014 deg C per year in our satellite data).

Again, this assumes CO2 is 100% to blame for the long-term warming trend, and the 0.02 value assumes a climate sensitivity on the low end of IPCC projections, which is consistent with observations-based diagnoses of climate sensitivity; change it to 0.03 if you want, my point still stands.

It’s really that simple.

UAH Global Temperature Update for June, 2024: +0.80 deg. C

Tuesday, July 2nd, 2024

The Version 6 global average lower tropospheric temperature (LT) anomaly for June, 2024 was +0.80 deg. C departure from the 1991-2020 mean, down from the May, 2024 anomaly of +0.90 deg. C.

The linear warming trend since January, 1979 remains at +0.15 C/decade (+0.13 C/decade over the global-averaged oceans, and +0.20 C/decade over global-averaged land).

The following table lists various regional LT departures from the 30-year (1991-2020) average for the last 18 months (record highs are in red):

YEARMOGLOBENHEM.SHEM.TROPICUSA48ARCTICAUST
2023Jan-0.04+0.05-0.13-0.38+0.12-0.12-0.50
2023Feb+0.09+0.17+0.00-0.10+0.68-0.24-0.11
2023Mar+0.20+0.24+0.17-0.13-1.43+0.17+0.40
2023Apr+0.18+0.11+0.26-0.03-0.37+0.53+0.21
2023May+0.37+0.30+0.44+0.40+0.57+0.66-0.09
2023June+0.38+0.47+0.29+0.55-0.35+0.45+0.07
2023July+0.64+0.73+0.56+0.88+0.53+0.91+1.44
2023Aug+0.70+0.88+0.51+0.86+0.94+1.54+1.25
2023Sep+0.90+0.94+0.86+0.93+0.40+1.13+1.17
2023Oct+0.93+1.02+0.83+1.00+0.99+0.92+0.63
2023Nov+0.91+1.01+0.82+1.03+0.65+1.16+0.42
2023Dec+0.83+0.93+0.73+1.08+1.26+0.26+0.85
2024Jan+0.86+1.06+0.66+1.27-0.05+0.40+1.18
2024Feb+0.93+1.03+0.83+1.24+1.36+0.88+1.07
2024Mar+0.95+1.02+0.88+1.35+0.23+1.10+1.29
2024Apr+1.05+1.25+0.85+1.26+1.02+0.98+0.48
2024May+0.90+0.98+0.83+1.31+0.38+0.38+0.45
2024June+0.80+0.96+0.64+0.93+1.65+0.79+0.87

The full UAH Global Temperature Report, along with the LT global gridpoint anomaly image for June, 2024, and a more detailed analysis by John Christy, should be available within the next several days here.

The monthly anomalies for various regions for the four deep layers we monitor from satellites will be available in the next several days:

Lower Troposphere:

http://vortex.nsstc.uah.edu/data/msu/v6.0/tlt/uahncdc_lt_6.0.txt

Mid-Troposphere:

http://vortex.nsstc.uah.edu/data/msu/v6.0/tmt/uahncdc_mt_6.0.txt

Tropopause:

http://vortex.nsstc.uah.edu/data/msu/v6.0/ttp/uahncdc_tp_6.0.txt

Lower Stratosphere:

http://vortex.nsstc.uah.edu/data/msu/v6.0/tls/uahncdc_ls_6.0.txt