Archive for October, 2015

Color Satellite Shows Texas Floodwaters Entering the Gulf

Wednesday, October 28th, 2015

Most of the rain that fell on southeast Texas (up to 20 inches) will end up flowing into the Gulf of Mexico, a process which has already started.

Here is yesterday’s color MODIS image of the turbid water along the coast, compared to twelve days before. Some of the water is sediment-laden (tan color), while in other areas the water is relatively sediment-free (darker than normal). Click for full-size.

NASA MODIS imagery of Texas floodwaters entering the Gulf of Mexico.

NASA MODIS imagery of Texas floodwaters entering the Gulf of Mexico.

Patricia’s Tight Blue Eye

Friday, October 23rd, 2015

As Hyper-Hurricane Patricia approaches the western coast of Mexico with 190 mph sustained winds, satellite imagery shows what is usually only seen in typically-stronger West Pacific typhoons — a very constricted eye (in the center of the imagery), roughly akin to an extremely large tornado (but different physics, I know):

MODIS color imagery of Hurricane Patricia with 190 mph maximum sustained surface winds.

MODIS color imagery of Hurricane Patricia with 190 mph maximum sustained surface winds.

Eastern Pacific hurricanes are typically not flown into with “hurricane hunter” aircraft, so it’s questionable whether this one really is a “record setter”…they flew into this one because it looked like it would be unusually strong. The intensity of these systems is usually estimated based upon appearance in satellite visible and infrared imagery, which is prone to error.

This one is the strongest “hurricane” (Atlantic or East Pacific nomenclature) they have happened to fly into. It’s doubtful that a stronger one hasn’t occurred in, say, the last 50 years which wasn’t flown into with aircraft.

Gimme Three Steps Toward the Renewable Energy Door

Tuesday, October 13th, 2015

jesus-turbines-small
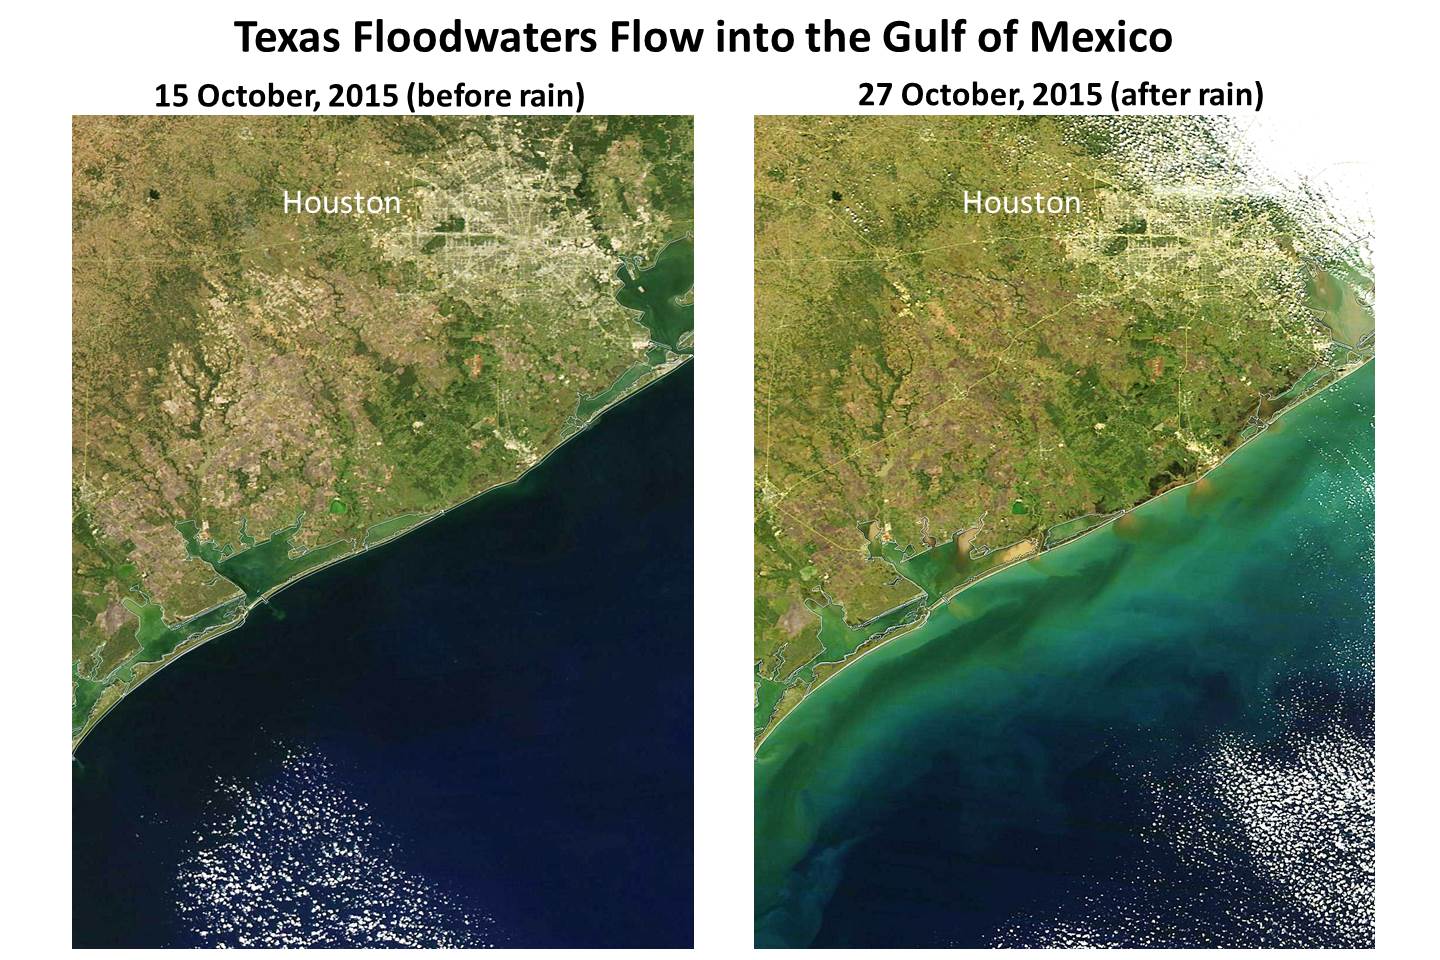
A TV meteorologist named Greg Fishel (WRAL, Raleigh, NC) posted an article yesterday on their WRAL Weathercenter Blog entitled Choose science, stewardship in understanding climate change. In the blog post Mr. Fishel claims — I hope I am not putting words in his mouth — to have finally accepted human-caused climate change, and therefore encourages other conservative Christians like himself to put aside partisanship for the good of humanity and the Earth.

I actually agree with most of the science he presents, but I want to address why he is misguided in his conclusions.

Mr. Fishel got (at most) 1 in 3 correct

In order to actually do something about human-caused climate change, primarily caused by our carbon dioxide emissions from fossil fuel use, you must answer “yes” to the three following questions:

1. Do humans significantly contribute to climate change?

2. Does that human contribution have a demonstrably negative impact?

3. Can we do anything to significantly avert it with new energy technologies without causing human suffering?

Unfortunately, while Mr. Fishel spent most of his time on #1, he sort of skipped #2 and #3…or at least hasn’t spent much time researching them.

So, let’s take these three steps, one at a time.

1. Do humans significantly contribute to climate change?

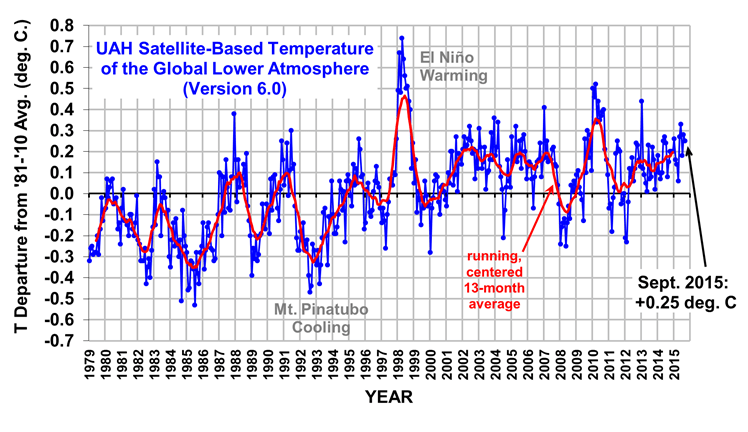
I actually mostly agree with him on #1. I believe humans have caused maybe 50% of the recent warming of the oceans and the atmosphere, say since the 1950s since we have a published paper analyzing that time period. But Mr. Fishel seems to believe it was all caused by humans, since he says that “it can’t be the Sun”. Well, there are actually quite a few other possibilities, since even without humans the climate system changes all by itself. For example, a small change in ocean circulation can cause a small change in cloudiness. The recent multi-decadal period of stronger El Ninos by itself can explain about half of recent warming. Yes, the stratosphere has cooled, partly due to increasing CO2. But “weather” makes attribution of a human effect on tropospheric temperatures — where people live — much more difficult.

2. Does that human contribution have a demonstrably negative impact?
Here’s where Mr. Fishel has little to say. It has not been demonstrated that any kind of severe weather has increased because of our addition of 1 CO2 molecule to each 10,000 molecules of atmosphere over the last century. He ignores the benefits of mild warming (which likely isn’t even all our fault, and which has been demonstrably below computer model projections), as well as the benefits of more CO2 on the biosphere and agriculture (based upon satellite measurements of global greening and literally hundreds of agricultural experiments).

3. Can we do anything to significantly avert it with new energy technologies without causing human suffering?
This is where Greg Fishel appears to be the most misguided. Here’s a quote from his article:

“And on top of all of this, we hear the argument that it is economic suicide for the U.S. to act alone, and that we need the cooperation of China and India. Did you know both of those countries are leaving us in the dust when it comes to pursuing new technologies relating to energy production? Those countries see the economic opportunity and are going after it while we sit around and have politically partisan arguments.”

This simply could not be further from the truth.

In the lead-up to the Paris climate conference in December, China and India are basically thumbing their nose at the world on carbon dioxide emissions. They will continue to burn fossil fuels at an increasing rate.

There is no “magic bullet” green energy technology which can replace fossil fuels, period. Plus, wind and solar power are so expensive (and did I mention intermittent?) that to rely on them in any but isolated, special cases will hurt economies and make poverty worse, not better.

This is why green energy programs, where they have been tried, are now being abandoned as too expensive and provide too little return in energy production.

As I’ve said before, I really don’t care where our energy comes from…as long as it is inexpensive and abundant, because that’s what humanity requires. And I don’t care if the CEOs of every coal and petroleum company ends up disagreeing with me, and decide to join the ranks of the alarmists.

Since Greg Fishel invoked “Christ’s teachings”, let me do the same.

How can we provide for widows and orphans if we can’t even provide for ourselves?

Until new energy technologies are eventually developed — (the U.S. does not sit on our hands in alternative energy research) — the most moral thing we can do for humanity is to use fossil fuels.

(A good place to start for Christians who want to learn more about our options from a biblical world view is the Cornwall Alliance.)

South Carolina Flooding is NOT a 1 in 1,000 Year Event

Tuesday, October 6th, 2015

There is no question that the flooding in South Carolina is exceptional, even historic.

But a once on 1,000 year event? Sorry, but there is no way to determine that…there are simply not enough rainfall statistics over a long enough period of time to establish such a claim.

But we do have information on previous floods over the last 100 years or so. So, let’s look at how the current event compares.

The greatest multi-day rainfall reported on the CoCoRaHS cooperative rainfall monitoring website was 27 inches in Columbia, SC. The Congaree River crested at 31 ft. there on Sunday:

Congaree River gage height at Columbia, SC.

Congaree River gage height at Columbia, SC.

Here’s a photo taken about the time the river crested:

Photo of Congaree River, Columbia, SC, Oct. 4, 2015, taken about the time of cresting.

Photo of Congaree River, Columbia, SC, Oct. 4, 2015, taken about the time of cresting.

Now, for comparison, take a look at a bridge over the Congaree River during the record flood of 1908, when the river crested at 40 ft…about 9 ft. higher than the current flood event:

Congaree River bridge in Columbia, SC, during the 1908 record flood event.

Congaree River bridge in Columbia, SC, during the 1908 record flood event.

Not to discount the misery and likely billions of dollars of damage caused by the current event, but when someone claims that a weather disaster is 1 in a 1,000 year event, they need to back it up.

Unfortunately, there seems to be an trend toward classifying events as “1 in 1,000 years”, when there is no way of knowing such things. This is especially true for floods, where paving of urban and suburban areas causes increasing runoff, making river flooding worse for the same amount of rainfall. This is a big reason why flood events have gotten worse in the last 100 years…it has nothing to do with “climate change”.

For some areas the current flood is no doubt a 1 in 100 year event, or even worse. But remember, it is perfectly normal to have a 1 in 100 year event every year…as long as they occur in different locations.

That’s how weather records work.

Historic Flooding in South Carolina Expected

Saturday, October 3rd, 2015

UPDATE: (8:50 a.m. EDT Sunday, Oct. 4). As predicted, heavy rain has spread over much of SC during the night, and there are widespread reports of over 10 inches of total storm rainfall, with one of 24 inches (Mt. Pleasant, near Charleston). Columbia has received 8-10 inches, and heavy rain continues there. Unbelievably, the midnight GFS model run predicts an additional 12 inches of rain over much of central and southeast SC by mid-day Monday. I suspect we are looking at a catastrophic flooding situation in some areas.

The Pacolet River, South Carolina, flood of 1903.

The Pacolet River, South Carolina, flood of 1903.

As much as two feet of rain is expected in South Carolina this weekend, which could produce the worst flooding in the state since records began. Governor Nikki Haley has already declared a state of emergency for the state. For comparison, the worst SC floods on record occurred in 1903, 1908, 1940, 1945, and 1990.

Flooding has already begun in Charleston, where 5-7 inches of rain has accumulated as of this morning and some water rescues are being made. North Myrtle Beach has received 9.30 inches so far.

Here is the latest GFS model predicted rain totals by Monday morning (graphic courtesy of Weatherbell.com):

Total predicted rainfall by Monday morning, Oct. 5, from the GFS model.

Total predicted rainfall by Monday morning, Oct. 5, from the GFS model.

Purple areas in the above image indicate over 12 inches of predicted rainfall.

So far, most of the rain has been restricted to the eastern half of the state where several inches have fallen, but the heavy rain will spread over the rest of the state today.

Local flood information for the Midlands of South Carolina from WLTX can be found here.

Current South Carolina radar

UAH V6.0 Global Temperature Update for Sept. 2015: +0.25 deg C

Friday, October 2nd, 2015

NOTE: This is the sixth monthly update with our new Version 6.0 dataset. Differences versus the old Version 5.6 dataset are discussed here.

The Version 6.0 global average lower tropospheric temperature (LT) anomaly for September, 2015 is +0.25 deg. C, down slightly from the August, 2015 value of +0.28 deg. C (click for full size version):

UAH_LT_1979_thru_September_2015_v6

The global, hemispheric, and tropical LT anomalies from the 30-year (1981-2010) average for the last 9 months are:

YR MO GLOBE NH SH TROPICS
2015 1 +0.28 +0.40 +0.16 +0.13
2015 2 +0.18 +0.30 +0.05 -0.06
2015 3 +0.17 +0.26 +0.07 +0.05
2015 4 +0.09 +0.18 -0.01 +0.10
2015 5 +0.29 +0.36 +0.21 +0.28
2015 6 +0.33 +0.41 +0.25 +0.46
2015 7 +0.18 +0.33 +0.03 +0.48
2015 8 +0.28 +0.25 +0.30 +0.52
2015 9 +0.25 +0.14 +0.17 +0.55

The tropics continue to slowly warm with El Nino conditions there.

The global image for September, 2015 should be available in the next several days here.

The new Version 6 files (use the ones labeled “beta3”) should be updated soon, and are located here:

Lower Troposphere: http://vortex.nsstc.uah.edu/data/msu/v6.0beta/tlt
Mid-Troposphere: http://vortex.nsstc.uah.edu/data/msu/v6.0beta/tmt
Tropopause: http://vortex.nsstc.uah.edu/data/msu/v6.0beta/ttp
Lower Stratosphere: http://vortex.nsstc.uah.edu/data/msu/v6.0beta/tls

Hurricane Joaquin: False Alarm for the U.S. East Coast?

Thursday, October 1st, 2015

The GFS model runs from last night and this morning have shifted the track of Hurricane Joaquin significantly eastward, reducing the possibility of a direct hit on the U.S.

The National Hurricane Center has conservatively adjusted it’s official forecast track a little to the east, but their storm discussion drops an important hint:

“It is also possible that Joaquin will remain far from the U.S. east coast.”

Here’s the latest official forecast track:

Joaquin-145823W5_NL_sm

Yet, the very latest GFS model run just in has shifted the storm even farther east, so I suspect we will see the official forecast follow suit this afternoon. Here’s the latest GFS forecast position for 2 p.m. Monday afternoon (graphic courtesy of Weatherbell.com):

GFS model forecast sea level pressure and near-surface winds for 2 p.m. Monday, October 5, 2015.

GFS model forecast sea level pressure and near-surface winds for 2 p.m. Monday, October 5, 2015.

If that forecast is anywhere close to correct, even Nova Scotia will be spared.

Nevertheless, heavy rains are forecast to continue for the mid-Atlantic states, with excessively large amounts possible in portions of the Carolinas. The latest model run indicates as much as 12-18 inches in South Carolina (!)

None of this is a done deal, however. The longer Joaquin lingers in the Bahamas, the farther east it will likely track as the approaching trough from the west picks it up. But if it decides to head north a little early, it could still hit as far south as the Carolinas. So, the forecast remains unusually risky at this point, and the NHC (and the NWS in general) must always err on the side of caution.

What I find a little ironic is that if this storm were to hit the East Coast, we would have to suffer through endless claims of “climate change!”. Yet if it stays at sea, no one complains.

It’s the same storm, folks, no matter what track it takes.