UAH V6.0 Global Temperature Update for Sept. 2015: +0.25 deg C

October 2nd, 2015 by Roy W. Spencer, Ph. D.

NOTE: This is the sixth monthly update with our new Version 6.0 dataset. Differences versus the old Version 5.6 dataset are discussed here.

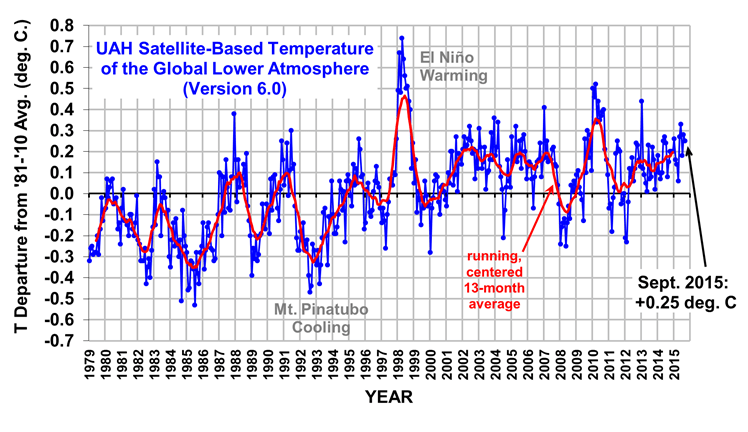
The Version 6.0 global average lower tropospheric temperature (LT) anomaly for September, 2015 is +0.25 deg. C, down slightly from the August, 2015 value of +0.28 deg. C (click for full size version):

UAH_LT_1979_thru_September_2015_v6

The global, hemispheric, and tropical LT anomalies from the 30-year (1981-2010) average for the last 9 months are:

YR MO GLOBE NH SH TROPICS
2015 1 +0.28 +0.40 +0.16 +0.13
2015 2 +0.18 +0.30 +0.05 -0.06
2015 3 +0.17 +0.26 +0.07 +0.05
2015 4 +0.09 +0.18 -0.01 +0.10
2015 5 +0.29 +0.36 +0.21 +0.28
2015 6 +0.33 +0.41 +0.25 +0.46
2015 7 +0.18 +0.33 +0.03 +0.48
2015 8 +0.28 +0.25 +0.30 +0.52
2015 9 +0.25 +0.14 +0.17 +0.55

The tropics continue to slowly warm with El Nino conditions there.

The global image for September, 2015 should be available in the next several days here.

The new Version 6 files (use the ones labeled “beta3”) should be updated soon, and are located here:

Lower Troposphere: http://vortex.nsstc.uah.edu/data/msu/v6.0beta/tlt
Mid-Troposphere: http://vortex.nsstc.uah.edu/data/msu/v6.0beta/tmt
Tropopause: http://vortex.nsstc.uah.edu/data/msu/v6.0beta/ttp
Lower Stratosphere: http://vortex.nsstc.uah.edu/data/msu/v6.0beta/tls


85 Responses to “UAH V6.0 Global Temperature Update for Sept. 2015: +0.25 deg C”

Toggle Trackbacks

  1. mpainter says:

    Could be that El Nino will wait until after December to show itself, with an impish grin on its mug.

    • Alan Poirier says:

      Hehe. I was thinking the same thing. Previous El Nino quickly became apparent in both UAH and RSS series. This year it’s apparently different. That’s what happens when NOAA and GISS fudge the data. Eventually it catches up with you. Many an embezzler has been caught the same way.

      • dave says:

        “…El Nino will wait…”

        The mainstream media outlets long ago prepared the following headline:

        “Climate scientists say horror El Nino caused by global warming”

        It may be that the actual next headline on the subject will read:

        “Climate scientists say horror La Nina caused by global warming.”

        • dave says:

          “…El Nino…”

          Actually, some of the media and PR wonks just couldn’t hold it in.

          Thus:

          “Strongest warning yet for horror summer El Nino”
          New Zealand Herald, two days ago.

          “Super El Nino and climate change cause crop failure…”
          Oxfam, two days ago.

          I will change my prediction. The headline in six months’time must be:

          “Climate scientists say current knife-edge neutral conditions caused by global warming.”

      • VIn says:

        How do you know which dataset is fudged?

        It will be very interesting watching the updated UAH calibration diverge from the rest.

      • Nate says:

        Alan,

        Lots of different sources of El Nino data, from US, Japan, Australia, etc. all showing the same thing: a strong El Nino.

        Are you saying all of these agencies are corrupt? Really?

        • bit chilly says:

          nope either just plain wrong or misguided.they can claim anything they like of course,and display charts to support it.the real barometer of el nino, el nada or la nina is catches of fish in the regions where the greatest effects were historically noted.

          some say watch the pea in the climate debate, in this case watch the fish.

          • mpainter says:

            “The real barometer”, exactly, as that is the index of upwelling. The term “El Nino” originated with the fishermen of Peru. Many who study ENSO do not know that nor do they understand that the ENSO cycle is all about variation in the rate of upwelling in the eastern equatorial Pacific. I can’t help the feeling that these ENSO meters are devised by persons who are basically ignorant of these facts.

          • Nate says:

            Ok so the fact that a wide swath of the equatorial pacific, both above and below the surface, is 3 C warmer than usual, as shown by satellites as well as buoys, ship measurements, etc., whose data are publicly available for perusal-these are all wrong and misguided? For you there is no point in looking all this sophisticated data? Fish catches, OK. Have you looked at those?

            You just need look back to 1997 to see that the UAH data did not ‘see’ significant effects of the strongest modern El Nino until about December of that year. Probably because it is measuring air temperature well above the surface and after the latent heat released has been transported around the globe, to cause all of the predictable weather patterns in the US and elsewhere.

            So I suggest waiting til December/January before looking for conspiracies..

          • bit chilly says:

            nate, i agree we will need to wait and see. the reason i err on the side of this el nino being of lower magnitude than those of 98 and 2010 is that i believed the first season of anchovy fishing would have been cancelled this year after the second season was cancelled last year. this would have been a good indicator that the waters in the affected area had at least remained at the same temperature, if not warmed.

            the first season went well this year considering last year . we will find out within a week whether the second season will be opened for fishing or not.

            i am not a conspiracy theorist. the problem is poor measurement of the oceans, nothing more and nothing less. noaa were giving temperatures on their global sea surface anomaly map, that were 5 to 7 c higher than the reality, for the north sea off the east coast of scotland for much of the year.

            now you may believe that is the only region they got wrong and i was just lucky to live in the area and be able to check. i am not so sure. as an aside,the north sea summer surface temperatures peaked roughly 6 c below those of last summer.

        • mpainter says:

          All those sources can’t miss, say you Nate? What if all those sources thought in the same way? In fact, the slowing of the upwelling could reverse itself anytime. Like you say, there is no El Nino until there is.

          • dave says:

            The essential point is that ALL three areas* of the globe are shown by UAH as “cooler” (i.e. anomalies are less positive) than in April 1998.

            Thus:

            April 1998 Tropics + 1.18
            No. Ext. + 0.69
            So. Ext. + 0.34

            Aug. 2015 Tropics + 0.52
            No. Ext. + 0.11
            So. Ext. + 0.19

            Although there is still time for the El Nino to strengthen and increase the brightness temperature of the Tropics, it does not seem credible that this possible effect could “spill over” to the No. Ext. and the So. Ext. in the next few months.

            * Tropics 20S to 20 N; No. Ext. 20 N to 90N; So. Ext. 20S to 90S.

        • Alan Poirier says:

          Nothing of the kind. But the observation still stands. The 98 el nino was clearly visible in satellites as early as May of 97. Ditto the 2010. This looks like a weak El Nino at best and hardly the monster some have claimed. The 98 EN peaked in July of that year. The 10 EN peaked in July as well. Anomaly values were considerably higher in both cases. So the question remains: why are we not seeing land/sea increases reflected in the satellite temps?

          • Dave G says:

            Maybe it’s being circulated differently.

            The arctic has been pretty cold this fall. The Northern Hemisphere, or the rest of it, overall is cooling.

            Conditions are different.

          • bit chilly says:

            dave g, last year there was certainly something different. the north sea around the uk was as warm during winter as i have ever seen .incredibly warm .it had an effect on the inshore cod , they were spawning from very early in winter,and the fish were in very poor condition from december onwards, typically this would not happen until march.

            i was expecting sea surface temperatures to increase to summer levels rapidly as they were starting from around 3 c higher than normal in spring. they hardly moved as evidenced by the green shore crab moult that has continued unabated from the second week in may. in a typical year they would cease moulting for around 1 month when the near shore water temperature in the inter tidal zone climbed above 15 to 16 c or thereabouts . this year that never happened.

    • Ovi says:

      (14 +17)/2 = 15.5. Should the 14 be 34? Is there a typo somewhere?

      • Nate says:

        You need to be comparing 2015 to 1997, not 1998. 1997 was the development year of the super El Nino. All the measurements of sst in the equatorial pacific showed high values by spring/summer of 1997, just as they have this year, but the UAH global temperature did not respond significantly until December 1997. As Roy has noted several times, there is always a delay of several months for the global troposphere to respond.

        BTW the temp of the tropics has already bumped up in UAH this year.

        • bit chilly says:

          i have been watching the reporting of this el nino for over a year now nate. i would have said that 2014 should have been to this el nino what 97 was to the 98 el nino. as you say, we shall see come spring 2016.

          • Nate says:

            Bit Chilly,

            Just one example, iN Australia El Nino causes drought-hence they care very much about El Nino monitoring and predictions being accurate.

            Here is their assessment as of 9/29/15

            From Australias Bureau of MEterology (BOM) http://www.bom.gov.au/climate/enso/index.shtml

            The tropical Pacific ocean and atmosphere are reinforcing each other, maintaining a strong El Niño that is likely to persist into early 2016. Tropical Pacific sea surface temperatures are more than 2 °C above average, exceeding El Niño thresholds by well over 1 °C, and at levels not seen since the 1997–98 event. In the atmosphere, tropical cloudiness has shifted east, trade winds have been consistently weaker than normal, and the Southern Oscillation Index (SOI) is strongly negative.
            Most international climate models surveyed by the Bureau of Meteorology indicate El Niño is likely to peak towards the end of 2015. Typically, El Niño is strongest during the late austral spring or early summer, and weakens during late summer to autumn.

          • bit chilly says:

            given the bom cannot even give an explanation as to how they measure surface temperatures i will take anything they say in relation to ocean temperatures with a pinch of salt.

  2. Christian says:

    y, see also 1997/1998, the very most increase began arround Dezember 97 to Ja 98 and peaks in april 98.

    That is what we also should see, the rest of the year 2015, there should no more temperature increase just only noise from month to month. I think in 2016 the peak ins UAH should be arround 1K in respect to 1981-2010.

    • Ftop_t says:

      Another description for global temperatures might be “stubbornly stable”

      Yet the drum beat to destroy Western civilization goes on unabated.

  3. geran says:

    “Globe”, NH, and SH all dropped! Only tropics increased, but only by 0.03º???

    This is serious folks. We been putting a lot of CO2 out there. We got a super El Niño working for us. Yet, not one ocean is boiling.

    Please everyone, drive an extra 50 miles next week. Winter is coming on and we need a lot more of that “GHE warming”! We can do better! Go team!

    Thank you.

  4. Thanks, Dr. Spencer.

    I have updated your graph in my meteorology and climate pages.
    I was a little surprised by the .03°C decrease.

  5. David Appell says:

    Is there going to be a published paper that explains the changes in version 6?

  6. Chris Morris says:

    I see Mr Apple has not learned to read yet. Look at the Mote under the header.

  7. Chris Morris says:

    Yet again my fingers were too fast. I meant Note instead of Mote

  8. Phillip Bratby says:

    I thought it was the poles that were supposed to warm due to my use of fossil fuels.

  9. Gunnar says:

    How can global value be 0.25 if NH is 0.14 and SH is 0.17 ?
    Compare values for previous months. Weight for tropical changes ?

  10. Håkan says:

    Roy, it looks like there is an error in the numbers for September 2015. If NH=0.14 and SH=0.17 then GLOBE should be 0.155 (and not 0.25), shouldn’t it?

    Please, comment.

    (Basically the same question as Gunnar has above, so you can answer either of us.)

    • geran says:

      Good catch gents! (I missed that myself.)

      A little “peer review” to help Dr. Roy.

      Good job!

    • DaveC says:

      Guys, isn’t answer that the data includes Northern Hemisphere, Southern
      Hemisphere and Tropics? The global number is based on all three. You seem to be disregarding the tropics.

      • Håkan says:

        DaveC, you may be right. But if so, then a hemisphere is not a hemisphere. The normal meaning of Hemisphere = half a globe. But you suggest that, in this case, a Hemisphere = half a globe minus some tropics.

        The older data indicates that GLOBE is mean of NH and SH.

        I still urge dr Roy to comment on this.

      • MikeB says:

        Dave, if you look at the figures for previous months you can easily see that the GLOBE is a simple average of NH and SH; TROPICS don’t come into it.

        This looks like a mistake.

  11. GLOBE +.25 N.H +.14 SH +.17

    Based on the above globe should be +.155c???

    Until my low average value solar parameters are approached this is when we will know just how much influence the sun has upon the climate.

    Right now the solar parameters I think are needed to impact the climate (cooling effect)are still running well above my low average values.

    I think it is just a matter of time before my low average value solar parameters will be reached and at that time the test will come.

    I expect the climate will cool once these low average value solar parameters are approached much less exceeded.

    • Aaron S says:

      Dont forget there are lags in the system. It can take 100s of years for oceans to equilibrate to forcings like solar activity. For example had we stayed in the solar max at a constant solar input i think there would have seen much more warming. Fortunately, the sun shifted down a gear.

    • Ivan says:

      that’s exactly what I was thinking and searching the comments to see if anyone coudl explain this to me: how NH value of +0.14 and SH value of +0.17 could give the average of +0.25????

  12. When the time is appropriate I would like to post my lengthy climatic summary as to why /how the climate may change over this web-site Dr. Spencer.

    I would let you know. I expect it is still months away given the present solar activity.

    Thanks

    • dave says:

      “I expect it is still months away.”

      Solar cycle 24 is a long time a-dyin’.

      • rah says:

        Yep cycle 24 is going down slowly but it is most certainly on the down slope.

        I believe that cycle 24 has been the only cycle ever recorded with a double peak that had a second peak higher than the first.

        Makes one kinda wonder just how significant that really is? What does it mean for the forecast for cycle 25? If anything. Guess we’ll just have to wait and find out.

        • dave says:

          The SMOOTHED version of Cycle 23 had a second peak higher than its first. So, “the only cycle…” does not seem particularly important.

          A double peak or hump seems to reflect one hemisphere of the sun changing its phase of the cycle before the other hemisphere. This lack of synchronization might be part and parcel of a general change to a quieter sun for the next few cycles.

  13. Christian says:

    Very simple, adding 0.1K to SH and also to NH you got 0.25K Globals

  14. Richard Linsley-Hood says:

    From the table linked.

    Looks like a typo somewhere.

    2015 8 0.28 0.15 0.33 0.25 0.18 0.29 0.30 0.08 0.35 0.52 0.62 0.49 0.11 0.09 0.14 0.19 -0.40 0.29 -0.10 -0.04 -0.16 -0.61 -1.61 -0.13 0.09 0.02 -0.22
    Year Mo Globe Land Ocean NH Land Ocean SH Land Ocean Trpcs Land Ocean NoExt Land Ocean SoExt
    Land Ocean NoPol Land Ocean SoPol Land Ocean USA48 USA49 AUST

  15. AndyG55 says:

    Vln.. UAH USA48 shows a pretty close trend to the trend in USCRN and US ClimDiv.

    (UAH USA48 actually shows slightly less cooling that USCRN and ClimDiv)

    The similarity in trends for a quite large sample are with a high quality surface data set validates the data extraction process for UAH.

  16. DaveC says:

    (My comment directly above is meant as a reply to
    Gunnar, Hakan and Geran, who are asking whether the global figure is wrong in light of the figures for the northern and southern hemispheres only. They seem to be disregarding the figure for the tropics. I thought my reply would be placed higher up in the chain. Sorry for any confusion.)

    • Ivan says:

      The problem with this is that in ALL previous month the global value was the average of NH and SH anomalies. “NH” in the table does not mean “extra-tropical North” but “northern hemisphere INCLUDING the tropics”, so the figure for the tropics is irrelevant.

  17. Rick A says:

    This El Nino was supposed to be a big one but we haven’t seen the temp spike like back in 98. Wonder if this will in fact be a Super El Nino. Is there still time?

    • bit chilly says:

      in my opinion, no.

    • rah says:

      Guess well have that answer before too long. That guys as weatherbell are saying sea surfaces temps are at the highest they’ve been during the satellite record. That should eventually lead to a spike in air temps at all levels should it not?

    • BenjaminG says:

      Still plenty of time. 2015 is comparable to 1997, not 1998. That’s when the surge in sea surface temperatures in the equatorial Pacific occurred. Peak effect on satellite temperatures lags by something like 4-6 months. So, as seen in ’97-98, we should start seeing satellite temperatures climb at the end of this year (reflecting conditions the last few months) with an eventual peak in the spring or early summer reflecting the normal peak of El Nino conditions in the ocean around December this year.

  18. dave says:

    Rick A says:

    “…Super El Nino. Is there still time?”

    Likely to dissipate in six months’ time. So, just about possible.

  19. DaveC says:

    Hakan, thanks. I guess we do need an expert answer from Dr. Spencer then.

  20. Brian D says:

    Definite typo with the 0.25 globe anomaly. If hemisphere values correct then it should be 0.15. Unless of course hemisphere values incorrect and should be 0.24 and 0.27. Spot checked past data, and globe is always average of the hemisphere values.

  21. Buzz B says:

    You folks arguing about how 0.14 in one hemisphere + 0.17 in the other hemisphere can’t possibly equal 0.25 globally are missing the point I think. The global anomaly is not the average of the SH and the NH. Think of a student taking two classes each with 20 students. She is the 5th best student in both classes. That does not mean she is the #5 student overall. The #1 and 2 students in one class may be #19 and 20 in the other, such that our example is the #3 overall. You don’t average the two hemispheres (classes) to determine the overall average, instead you show the anomaly from the overall average. That is apparently 0.25 this month.

    • Håkan says:

      We have only two students here, NH and SH. We don’t compare their ranks, but their scores. The question is what is their average score on the “test”? Please explain to me how the average score ever can be higher than the score of the top student (SH).

  22. richard verney says:

    If one looks at the table at the head of this post, for all 9 months so far, the global figure is an average (presumably suitably weighted) of NH + SH + Tropics.

    In none of the months is the global figure a simple average of the NH and SH figures.

    Accordingly, the globe must be divided into 3 regions consisting of the NH above the tropic of Cancer, the SH below the tropic of Capricorn, and the Tropics (ie., the area between Cancer and Capricorn).

    Personally, I find it strange that NH (or SH) does not refer to the entire hemisphere as that is the usual and ordinary meaning of the term, but it appears to me that for the purposes of this data, it does not.

    Like others, I consider that Dr Spenc3er should clarify, although the position looks clear to me.

    • Håkan says:

      Richard Verney, I don’t agree with your numbers. All of the months presented above have GLOBE equal to the mean of NH and SH. Except September.

    • geran says:

      richard verney says: “In none of the months is the global figure a simple average of the NH and SH figures.”

      WRONG.

      There are ALL the simple average of NH and SH figures, with rounding.

      (It’s just amazing how confused some people can get themselves!)

  23. Euan Mearns says:

    Roy, I note that the global value normally = the arithmetic mean of NH+SH. Not so for September. There appears to be a typo. Others have noticed and commented on this too.

  24. Brad says:

    Hi Roy,
    have you seen the conclusions by a Mathematics Dr down our way called David Evans?
    I don’t have the smarts to completely comprehend his findings, but he seems to broadly agree with your assetions in your book about co2 not being a terribly efficient driver of “Global Warming” or it’s bastard child “Climate
    Change”

    Regards
    Brad
    http://www.theaustralian.com.au/news/miranda-devine-perth-electrical-engineers-discovery-will-change-climate-change-debate/story-e6frg6n6-1227555674611

  25. Brian D says:

    Well, RSS shows an uptick in the NH, with a downtick in the SH. Should the the NH be .34 instead of .14? That would have a globe value of .25 with a .34 NH and .17 SH.

  26. Ric Werme says:

    I don’t know where Anthony is getting data, but he just posted in
    http://wattsupwiththat.com/2015/10/07/global-temperature-report-september-2015-in-the-tropics-warmest-september-in-the-satellite-temperature-record/

    Global composite temp.: +0.25 C (about 0.45 degrees Fahrenheit) above 30-year average for September.
    Northern Hemisphere: +0.34 C (about 0.61 degrees Fahrenheit) above 30-year average for September.
    Southern Hemisphere: +0.17 C (about 0.31 degrees Fahrenheit) above 30-year average for September.

    0.25 = (0.34 + 0.17) / 2. (Okay, 0.255.)

    Brian D. wins.

  27. lewis says:

    Ric,

    It refers to a UAH press release.

  28. jim2 says:

    Dr. Spencer,

    Can you give us an update on when the version 6 code will be available?

    Thanks.

  29. The other Brad says:

    You may already be aware of this but your data is being talked about. Of course the believers in CAGW tell us your data shows no slow down in warming.

    http://blog.chron.com/sciguy/2015/10/ted-cruz-1-sierra-club-0/

  30. dave says:

    The UAH data files have now up-dated (click above), and show for September:

    NH +0.34

    and

    SH +0.17

    and

    Globe +0.25

    So, Dr Spencer’s typo, or whatever, is corrected.

    As someone mentioned, the RSS report was similar to UAH’s.

  31. MikeR says:

    Dr Spencer,

    I notice that your revision version 6 has data for Australia that currently gives a trend of 0.24 degrees per decade. This is a factor of 1.5 times larger than the value of 0.16 degree per decade of version 5.6.. This is a substantial revision upwards to say the least.

    These numbers in turn, are much larger than the Australia Bureau of Meteorology trend value of about 1.2 degrees per decade (1979-present) for the homogenized temperature data.

    The Bureau has been criticized extensively by those who have a tendency to indulge in conspiracy theory (we have have a large and diverse range who think like this in Australia), for homogenizing the trend of the data upwards by 0.3 of a degree per decade from 1910 until the present.

    In light of these massive discrepancies that UAH v6 introduces for the Australian data, do you present this data for entertainment purposes only or do you think it can serve some useful purpose? Maybe you should consider providing a caveat that it should not be taken too seriously as some appear to be doing.

Leave a Reply