Archive for August, 2013

Revisiting Wood’s 1909 Greenhouse Box Experiment, Part II: First Results

Monday, August 26th, 2013

In Part I of this series, I mentioned how Wood’s (1909) “greenhouse box” experiment, which he claimed suggested that a real greenhouse did not operate through “trapping” of infrared radiation, was probably not described well enough to conclude anything of substance. I provided Wood’s original published “Note”, which was only a few paragraphs, and in which he admitted that he covered the issue in only cursory detail.

Wood’s experiment was not described well enough to replicate. We have no idea how much sunlight was passed through his plate of rock salt-covered box versus the glass-covered box. We also don’t know exactly how he placed another glass window over the rock salt window, which if it was very close at all, invalidated the whole experiment.

I also mentioned two more recent experiments which came to totally opposite conclusions: one showed a substantial temperature rise in a glass covered box versus one covered with an IR-transparent material, the other did not.

Here I’ll present first results from my own backyard experiment. Ideally, one wants to have identical boxes in terms of their absorption of sunlight and resistance to conductive heat loss. We want to measure just the effects of IR-transparent and IR-opaque materials placed over the boxes on their energy budgets, as measured by a temperature difference of the air trapped within the boxes.

I used inexpensive Styrofoam coolers purchased from WalMart, doubled-up and sealed with transparent packing tape to trap the air space between them. The insides of the coolers were completely lined with adhesive metal tape from Lowes, then sprayed with 3 coats of Krylon #1502 flat white paint, which has a measured IR emissivity of at least 0.99:
Box-experiment-day-2-materials

Temperatures within the boxes are monitored with K-type probes using a 3-probe Extech SD200 thermometer datalogger, set to record temperatures every 2 minutes, as well as the ambient air temperature in the shade of one of the boxes. The probe tips in the boxes were in the shade near one end, half way between the top and bottom of the coolers:
Box-experiment-day-2-datalogger

Both boxes were covered with kitchen plastic wrap (0.5 mil polyethylene), which is approximately 90% transparent to IR. Both coverings are sealed around their periphery with clear packing tape to make the boxes approximately air-tight. A sheet of 0.22 in thick plexiglass was placed about 1 inch above one of the boxes:
Box-experiment-day-2-boxes-side-view

The first thing I discovered is that, without the plexiglass, it was difficult to get the two boxes to run at the same temperature, one being a little warmer (by 5 deg. F or more) as see in the thermal imager photo:
Box-experiment-day-2-1-box-warmer
I believe this was the result of the spray paint…the warmer one had a slightly more textured painted surface, slightly darker in appearance (and thus absorbing more sunlight) while the cooler box had somewhat smoother paint, with a slightly brighter appearance.

The effect of the plexiglass is to block the IR coming out of the box, as is clearly seen in the following FLIR images of the two boxes, where the one on the left has the plexiglass sitting above the plastic wrap (indicated temperatures are for the crosshair locations):
Box-experiment-day-2-FLIR-of-boxes

After monitoring temperatures and deciding that one box was going to run a little warmer even without the plexiglass present, I decided the best way to see if the plexiglass caused IR warming was to place it over one box, then over the other box, switching boxes every 10 minutes. I figured I would then see how the temperature difference between the two boxes changed as a result. I did this for 2 hours, from 3 p.m. until 5 p.m., with the following temperature readings taken every 2 minutes (gridlines, not the arrows, indicate when the plexiglass was swapped):
Box-experiment-day-2-temperature-plot

The effect of the plexiglass can then be most clearly seen when we then plot the temperature difference between the two boxes over that 2 hour period:
Box-experiment-day-2-temp-diff-plot
Now we clearly see the warming effect of the plexiglass. Even though the plexiglass only passes 92% of the visible sunlight, which by itself should cause cooler temperatures, its presence over one box causes that box to warm relative to the other box (or, you can say its absence causes the other box to run cooler).

This is how the “greenhouse effect” works. Even though the plexiglass is at a cooler temperature than the inside of either of the 2 boxes (just as the atmosphere is at a cooler temperature than the solar-heated surface of the Earth), its presence causes warmer temperatures in the box it is placed over.

I don’t believe this is being caused by suppression of convective heat loss from the plastic wrap because I had considerable air space under the plexiglass and there was a light breeze ventilating that air (see UPDATE, below).

Of course, there are many different ways the experiment could be structured. I could have used black paint instead of white, which would have caused higher temperatures, but I wanted the experiment to produce temperatures closer to those seen naturally. I hope that there is enough detail above for others to replicate what I have done, if they wanted to.

Finally, it should be mentioned that using an experiment like this to demonstrate the fundamental mechanism of the greenhouse effect is somewhat difficult because one is trying to produce a marginally increased greenhouse effect over that which is already present. The sky is already largely opaque to the transfer of IR radiation, and so such an experiment tries to measure the incremental warming effect of a solid surface (the plexiglass) over and above that already being produced by downwelling IR from the sky.

UPDATE: Since there is concern expressed that the plexiglass might be inhibiting convective heat loss from the top of whichever box it is placed over (even through there is a 1+” inch air space for ventilation), here are the temperatures of the two boxes from last evening (during which I swapped the plexiglass a couple of times) and during the night:
Box-experiment-nighttime
Importantly, note that even when the interior of the box is cooler than the ambient temperature, the plexiglass has a warming influence. This is better revealed in a plot of the temperature difference between Box 1 and the ambient air temperature:
Box-experiment-nighttime-T-diff
So, since convection can only transport heat from warmer to colder temperatures, convective inhibition cannot explain the warming effect of the plexiglass. It must be an infrared effect.

Revisiting Wood’s 1909 Greenhouse Box Experiment: Part I

Friday, August 23rd, 2013

Much is made in some circles of R.W. Wood’s 1909 experiment which supposedly “disproved” the “greenhouse effect”. As we shall see (below) the experiment reported on in the literature has only cursory detail. It also raises questions over the ability of the setup to demonstrate anything of use to the issue of whether downward IR emission from the sky raises the average surface temperature of the Earth.

I’m finally putting together my own experimental setup, which could be easily replicated by others. We now have widely available materials which are better suited to performing the experiment, and it should be an ideal candidate for High School science experiments.

Part of my interest is the fact that at least two attempts at replicating Wood’s experiment (Pratt’s and Nahle’s) came to totally opposite conclusions(!) Vaughan Pratt has told me he is interested in revisiting the experiment he did as well.

But first, here is R.W. Wood’s original note from Philosophical Magazine (1909 Vol. 17, pp. 319-320), which most have probably not bothered to read, and which I believe reveals some serious shortcomings in his experimental setup:

XXIV. Note on the Theory of the Greenhouse
By Professor R. W. Wood (Communicated by the Author)

THERE appears to be a widespread belief that the comparatively high temperature produced within a closed space covered with glass, and exposed to solar radiation, results from a transformation of wave-length, that is, that the heat waves from the sun, which are able to penetrate the glass, fall upon the walls of the enclosure and raise its temperature: the heat energy is re-emitted by the walls in the form of much longer waves, which are unable to penetrate the glass, the greenhouse acting as a radiation trap.

I have always felt some doubt as to whether this action played any very large part in the elevation of temperature. It appeared much more probable that the part played by the glass was the prevention of the escape of the warm air heated by the ground within the enclosure. If we open the doors of a greenhouse on a cold and windy day, the trapping of radiation appears to lose much of its efficacy. As a matter of fact I am of the opinion that a greenhouse made of a glass transparent to waves of every possible length would show a temperature nearly, if not quite, as high as that observed in a glass house. The transparent screen allows the solar radiation to warm the ground, and the ground in turn warms the air, but only the limited amount within the enclosure. In the “open,” the ground is continually brought into contact with cold air by convection currents.

To test the matter I constructed two enclosures of dead black cardboard, one covered with a glass plate, the other with a plate of rock-salt of equal thickness. The bulb of a thermometer was inserted in each enclosure and the whole packed in cotton, with the exception of the transparent plates which were exposed. When exposed to sunlight the temperature rose gradually to 65oC., the enclosure covered with the salt plate keeping a little ahead of the other, owing to the fact that it transmitted the longer waves from the sun, which were stopped by the glass. In order to eliminate this action the sunlight was first passed through a glass plate.

There was now scarcely a difference of one degree between the temperatures of the two enclosures. The maximum temperature reached was about 55oC. From what we know about the distribution of energy in the spectrum of the radiation emitted by a body at 55oC., it is clear that the rock-salt plate is capable of transmitting practically all of it, while the glass plate stops it entirely. This shows us that the loss of temperature of the ground by radiation is very small in comparison to the loss by convection, in other words that we gain very little from the circumstance that the radiation is trapped.

Is it therefore necessary to pay attention to trapped radiation in deducing the temperature of a planet as affected by its atmosphere? The solar rays penetrate the atmosphere, warm the ground which in turn warms the atmosphere by contact and by convection currents. The heat received is thus stored up in the atmosphere, remaining there on account of the very low radiating power of a gas. It seems to me very doubtful if the atmosphere is warmed to any great extent by absorbing the radiation from the ground, even under the most favourable conditions.

I do not pretend to have gone very deeply into the matter, and publish this note merely to draw attention to the fact that trapped radiation appears to play but a very small part in the actual cases with which we are familiar.

Regarding Wood’s setup, the first question I have is with his use of a rock salt plate, which is indeed mostly transparent to infrared…if it is kept very dry. He said nothing regarding his efforts to keep the plate from absorbing humidity, which will affect its IR transparency. Today, we can use thin polyethylene sheets (e.g. Saran Wrap), which are about 90% transparent to IR.

The second question I have comes from this passage (emphasis added):
“When exposed to sunlight the temperature rose gradually to 65oC., the enclosure covered with the salt plate keeping a little ahead of the other, owing to the fact that it transmitted the longer waves from the sun, which were stopped by the glass. In order to eliminate this action the sunlight was first passed through a glass plate.”

Say what? He put a glass plate in front of the rock salt plate? Well, that would invalidate the experiment altogether! The point was to see whether the IR opaqueness of the glass caused warmer temperatures in the box than did the IR-transparent salt plate. If he put glass over the salt plate, then we no longer have IR transparency, do we?

Another question I have is whether the salt plate and the glass were transmitting the same levels of visible sunlight. Using Saran Wrap (for IR transparency) and Plexiglass (for IR opaqueness) should each pass around 99% over 90% of visible sunlight, from what I have read. Glass is seldom as much as 90% transparent, so it is not the best choice, in my view. The issue is important because, assuming direct sunlight, you might have 800 W/m2 of solar heating available, but a 10% difference in transparency will result in 80 W/m2 difference in how much sunlight is entering the box. This is the same as the difference between downwelling sky radiation (say, 350 W/m2) versus the downward IR emission from a plexiglass plate at 73 deg. F (assuming an IR emissivity close to 1.0).

In other words, two boxes might produce the same interior temperatures (seemingly contradicting greenhouse theory) if a glass covered box is “trapping” 80 W/m2 more IR, but the Saran Wrap covered box is letting in 80 W/m2 more visible sunlight. The covering materials need to be passing very close to the same levels of solar energy. (The IR portion of solar energy flux should be very small since the sun’s emitting temperature is so high, and most of that IR is absorbed by the atmosphere anyway before it ever reaches the ground.) You want an experimental setup where everything is close to identical, except the IR transmission characteristics of the cover material.

Anyway, this post is meant as an introduction to the experiment I will be carrying out. (I’ve talked to Anthony Watts, who might perform his own experiment at some point.) What I will be using is nested Styrofoam coolers, lined with poster board painted with Krylon #1502 flat white spray paint (0.99 IR emissivity). One cooler will be covered with two layers of Saran Wrap (or equivalent), with an air space for insulation. The other cooler will be covered with Plexiglass. Both coolers will be sealed to be relatively air-tight. I’ve done some calculations which suggest that the similarity in thermal conductivity of the covering materials will be the biggest source of uncertainty….possibly 10 W/m2 or more. Conduction through the doubled Styrofoam containers will be essentially the same, and limited to not much more than 1 W/m2.

I will be monitoring temperatures with an Extech SD200 3-probe thermometer data logger, which continuously stores 3 temperatures at regular intervals.

A few of you might recall my backyard box experiment from a few years ago, where I chilled air in a Styrofoam box. This part of the problem is also of interest to me…to see how much cooler at night the air gets in the Saran Wrap covered box than in the Plexiglass covered box. Stay tuned.

On the Cloud Thermostat Hypothesis

Thursday, August 22nd, 2013

Over 20 years ago, Ramanathan and Collins (1991 Nature, “RC91”) advanced what became known as the “Thermostat Hypothesis”, relating to how cloud formation over the tropical Pacific warm pool limits just how warm surface waters there can get. While this conceptual view was OK for the warm pool itself, they made some extrapolations which weren’t really warranted about what this meant for the larger-scale climate system, and ultimately whether “global warming” will be reduced by a resulting increase in cloud cover reflecting more sunlight back to space (negative cloud feedback).

Now, I will say that I believe that the climate system is stabilized by negative cloud feedback, even though most if not all climate models exhibit positive cloud feedback. But you have to be careful about what you use as evidence, and cloud formation over warm areas (e.g. at the end of this post at WUWT) is simply not evidence. Even climate models with strong positive cloud feedback (decreasing clouds with warming) are going to form clouds over warm areas of the oceans. That’s the way atmospheric circulation systems work.

The RC91 Thermostat Hypothesis paper, written by experts in radiation but not so much in atmospheric dynamics, was quickly attacked for neglecting the fact that, for all of that rising cloudy air over the warm pool, there has to be sinking air elsewhere which suppresses cloud formation.

In other words, just because clouds preferentially form over locations with warmer ocean waters doesn’t mean it’s evidence for negative cloud feedback (clouds increasing with global warming). Here’s a cartoon showing the basic idea:
clouds-over-warm-spots-do-not-prove-thermostat

Hartmann and Michelsen (1993 J. of Climate) and Lau et al. (1994 Geophys Res. Lett., 21, 1157-1160) were among the first papers to point this out. Much work has been done on the issue in the last 22 years with the general conclusion that, for the tropical oceans at least, warming leads to virtually no net cloud feedback, either positive or negative. The problem gets even more complicated because the temperature inversion in the above cartoon — the result of subsidence-warmed air overlying cooler ocean waters — also causes marine stratus clouds to form, which have a strong cooling effect on the climate system as a whole.

If the cloud feedback problem was that simple, it would have been solved long ago. But it ain’t that simple.

Does a Greenhouse Operate through the Greenhouse Effect?

Sunday, August 11th, 2013

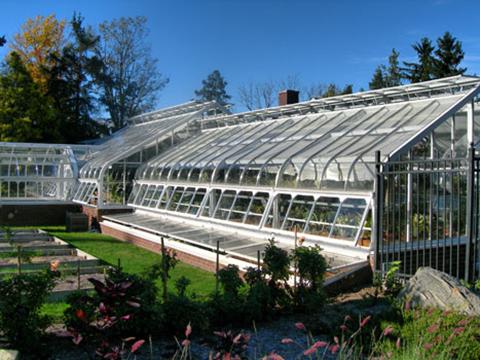
real-greenhouse
One of the oft-cited objections to the term “greenhouse effect” is that it is a misnomer, that a real greenhouse (you know, the kind you grow plants in) doesn’t work by inhibiting infrared energy loss. It is usually claimed that a real greenhouse works by inhibiting convective heat loss by trapping the sun-heated air inside.

While working on a new website devoted to answering greenhouse questions, I decided to examine this issue. What piqued my interest was a couple quick back-of-the-envelope calculations that (1) for a glass covered greenhouse, the downward infrared (IR) emission from the roof should be about 100 W/m2 more than from a clear sky (a pane of glass is high emissivity, and opaque to broadband infrared), and (2) the realization that a greenhouse generates its own convection from the roof because the glass heats up, so convective air currents inside have their heat conducted (albeit inefficiently) through the glass, then the warm glass of the roof causes its own convection.

Add to this the fact that greenhouses are usually vented, which means they lose heat convectively anyway that by-passes the greenhouse structure.

So, the question is: Does a greenhouse work more from infrared heating (the “greenhouse effect”), or more from the inhibition of convective heat loss?

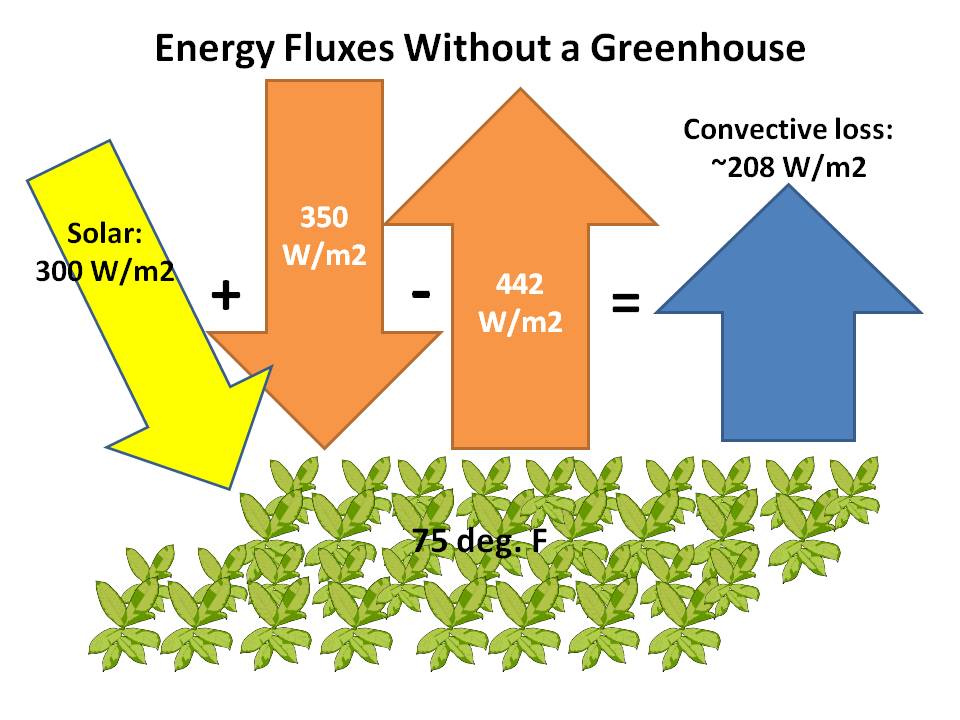
First, let’s examine some approximate energy fluxes for vegetation in the summertime. These are only rough estimates, and there are rather large variations in these depending on cloud cover, etc., and to be meaningful they need to represent a day+night average (infrared fluxes are orange; solar are yellow; convective are blue):
Greenhouse-effect-without-greenhouse
For simplicity, the calculated IR emission from solid surfaces assumes an emissivity of 1. The downward sky infrared is consistent with the BSRN network measurements during the warm season. Note that the energy fluxes have to sum to zero for temperature equilibrium, and we will ignore the photosynthetic storage of energy in plants which is very inefficient.

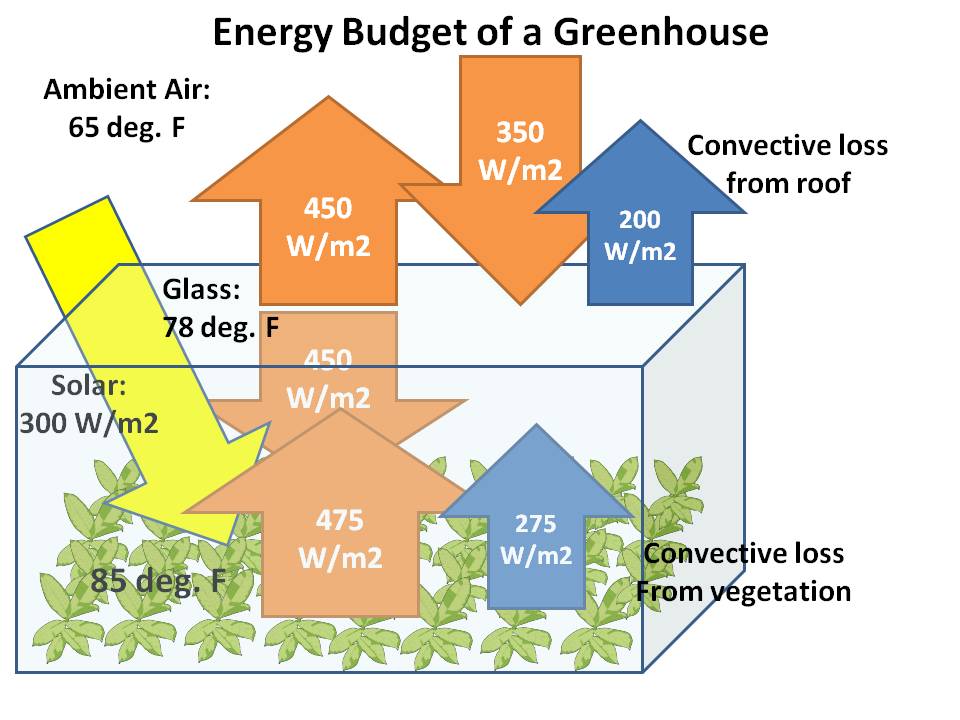
Now, with a greenhouse in place, we assume the average temperature of the interior rises, and that the glass roof reaches a temperature intermediate between the inside and outside air temperatures:
Greenhouse-effect-in-greenhouse

What really changes a lot is the downwelling IR, increasing from the sky value of 350 W/m2 to 450 W/m2, an increase of 100 W/m2. Convective heat generated (but temporarily “trapped”) within the greenhouse increases substantially, from 208 without the roof to 275 with the roof, for an increase of 67, which further heats the air, which in turn is helping to heat up the roof.

But notice that the convective heat loss by the greenhouse roof (200 W/m2, inferred as a residual) is only 8 W/m2 less than if the greenhouse was not there (208 W/m2). In contrast, the extra IR energy “input” (actually, reduced IR “loss”) is twelve times as large (100 W/m2) as the reduction in the convective loss (8 W/m2).

Of course, changing any of the assumed numbers will change the result. But, assuming I haven’t made a fundamental mistake, I think you would find that the “greenhouse effect” will consistently be larger than the convective inhibition effect.

So, maybe the greenhouse effect really does work like a real greenhouse. Again, the basic issue is this: replacing the downwelling sky radiation with a roof that is opaque to infrared (but still transparent to sunlight) represents a huge decrease in the IR energy loss by the vegetation, whereas the greenhouse roof still generates convective heat loss nearly as large as if the greenhouse wasn’t there.

I’m open to ideas, and better estimates of energy fluxes on this subject. The problem is actually surprisingly difficult one to think through. There are many energy fluxes involved (I haven’t even addressed energy losses out the side of the greenhouse) and the trick is to know which are the important ones and which ones can be ignored for the purposes of a rough estimate.

For example, the emissivity of glass is less than 1, but what that means is that it “traps” even more IR energy inside because it partly reflects the higher levels of IR the warmer vegetation is emitting upward.

What do the experts say about all this? I’m sure this problem has been analyzed before, probably in great detail, by multiple aggie graduates in their theses. Unfortunately, a Google search on “greenhouses” and “energy budget” is hopelessly cluttered with pages related to the Earth’s greenhouse effect (wow! how did that happen?)

If anyone is aware of studies done on the energy budget of greenhouses (of the agricultural kind), I would appreciate a reference or two. But until someone finds a serious error in the above analysis, I’d say we might need to admit that the “greenhouse effect” is pretty accurately named.

UPDATE: It appears the debate was brought up in the literature by R. Lee (“The Greenhouse Effect”, J. Appl. Meteorology, 1973) who has been referenced by many as showing a greenhouse does not work through the greenhouse effect, but he curiously admits the analogy “is correct only with respect to the glass, not with respect to the space enclosed”. Well, duh. That’s the point…the glass produces a greenhouse effect. In any event, his paper was refuted by Edwin Berry (Comments on “The Greenhouse Effect”, J. Appl. Meteorology, 1974) who showed several problems with Lee’s analysis.

So, I guess I’m left wondering…where did the oft-cited claim that a greenhouse does not operate through a greenhouse effect come from?

UAH v5.6 Global Temperature Update for July, 2013: +0.17 deg. C

Friday, August 2nd, 2013

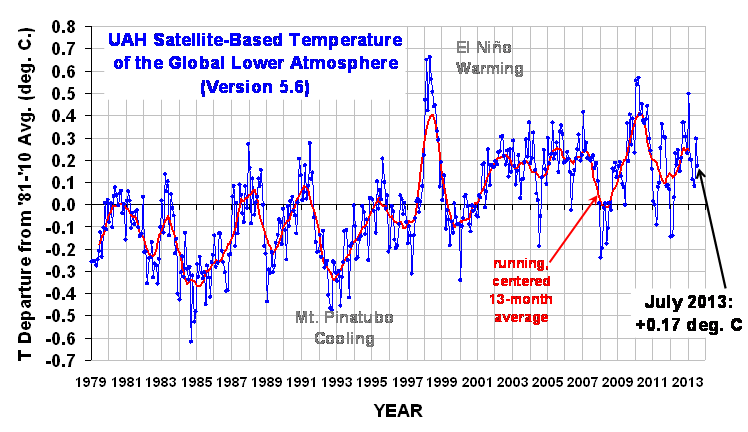
The Version 5.6 global average lower tropospheric temperature (LT) anomaly for July, 2013 is +0.17 deg. C (click for large version):
UAH_LT_1979_thru_July_2013_v5.6

The global, hemispheric, and tropical LT anomalies from the 30-year (1981-2010) average for the last 19 months are:

YR MON GLOBAL NH SH TROPICS
2012 1 -0.145 -0.088 -0.203 -0.245
2012 2 -0.140 -0.016 -0.263 -0.326
2012 3 +0.033 +0.064 +0.002 -0.238
2012 4 +0.230 +0.346 +0.114 -0.251
2012 5 +0.178 +0.338 +0.018 -0.102
2012 6 +0.244 +0.378 +0.111 -0.016
2012 7 +0.149 +0.263 +0.035 +0.146
2012 8 +0.210 +0.195 +0.225 +0.069
2012 9 +0.369 +0.376 +0.361 +0.174
2012 10 +0.367 +0.326 +0.409 +0.155
2012 11 +0.305 +0.319 +0.292 +0.209
2012 12 +0.229 +0.153 +0.305 +0.199
2013 1 +0.497 +0.512 +0.481 +0.387
2013 2 +0.203 +0.372 +0.034 +0.195
2013 3 +0.200 +0.333 +0.068 +0.243
2013 4 +0.114 +0.128 +0.101 +0.165
2013 5 +0.083 +0.180 -0.015 +0.112
2013 6 +0.295 +0.334 +0.255 +0.219
2013 7 +0.174 +0.134 +0.215 +0.077

Note: In the previous version (v5.5, still provided due to contract with NCDC) the temps are slightly cooler, probably due to the uncorrected diurnal drift of NOAA-18. Recall in v5.6 we include METOP-A and NOAA-19, and since June they are the only two satellites in the v5.6 dataset whereas v5.5 does not include METOP-A and NOAA-19.

New names of popular files:

uahncdc_lt_5.6
uahncdc_mt_5.6
uahncdc_ls_5.6