Archive for January, 2018

U.S. Corn Yield a New Record – Again

Monday, January 29th, 2018

Global warming be damned — full speed ahead on the Maize Train.

Kentucky Corn Growers Association

The numbers are in from USDA, and 2017 saw a new record in average corn yield, with 176.6 bushels per acre.

In fact, the last four growing seasons (2014, 2015, 2016, 2017) had higher yields than any previous years. The last time that happened was in 1964.

And compared to 1964, the U.S. is producing nearly three times as much corn per acre as we did back then.

There is no indication of a slowdown in the long-term upward trends in corn yields. While the 176.6 bpa U.S. average for 2017 is a huge increase compared to just 50 years ago, the latest winner for the highest yield produced by a single farmer has risen again to over 542 bpa, which is fully three times the U.S. average yield.

While the global warmmongers continue to wring their hands over rising temperatures hurting yields (the Corn Belt growing season has indeed warmed slightly since 1960), improved varieties and the “global greening” benefits of more atmospheric CO2 have more than offset any negative weather effects — if those even exist.

Globally, upward trends in all grain yields have been experienced in recent decades. Of course, droughts and floods cause regional crop failures almost every year. That is normal and expected. But there has been no global average increase in these events over the last century.

In his latest movie, Al Gore claimed just the opposite for wheat yields in China. While I hesitate to call him a liar, since I don’t know where he got his information — Gore was just plain wrong.

The sky is not falling. Life on Earth depends upon CO2, even though there is so little of it — now 4 parts per 10,000 of the atmosphere, compared to 3 parts a century ago. No matter how much we emit, nature gobbles up 50% of it.

Most of the evidence suggests that life is now breathing more freely than any time in human history, thanks to our CO2 emissions.

Sydney Heat and “Bomb” Snowstorm: Pimped Out for Climate Change

Sunday, January 7th, 2018

It’s been an eventful weather week in some portions of the globe. In fact, it is always an eventful weather week – somewhere.

But what really drives the narrative is when weather extremes — which always have, and always will, occur — happen to hit major metropolitan areas. Many people are already aware of the relentless guffawing resulting from Al Gore’s tweet that Michael Mann says the Northeast’s current cold wave is just what global warming predicts. (As I recall, Mann is a mathematician, not a meteorologist. Correction: Mann is a geologist/geophysicist, which is equally uninformed on atmospheric dynamics.)

Yesterday, Kristine Phillips of The Washington Post wrote about the recent “bomb” snowstorm in New England, the ensuing cold wave, and the extreme heat (110+ deg. F) that has just hit Sydney, Australia.

To her credit, she did not explicitly put the blame on climate change for these events, but her legal-background prose came pretty darn close… just close enough so that the casual reader would make the connection. Wink-wink, nod-nod.

The trouble is that neither of these two events are exceptional from a meteorological perspective. That is, they have happened before (Sydney’s 117 deg. F peak was exceeded in 1939), and they will happen again.

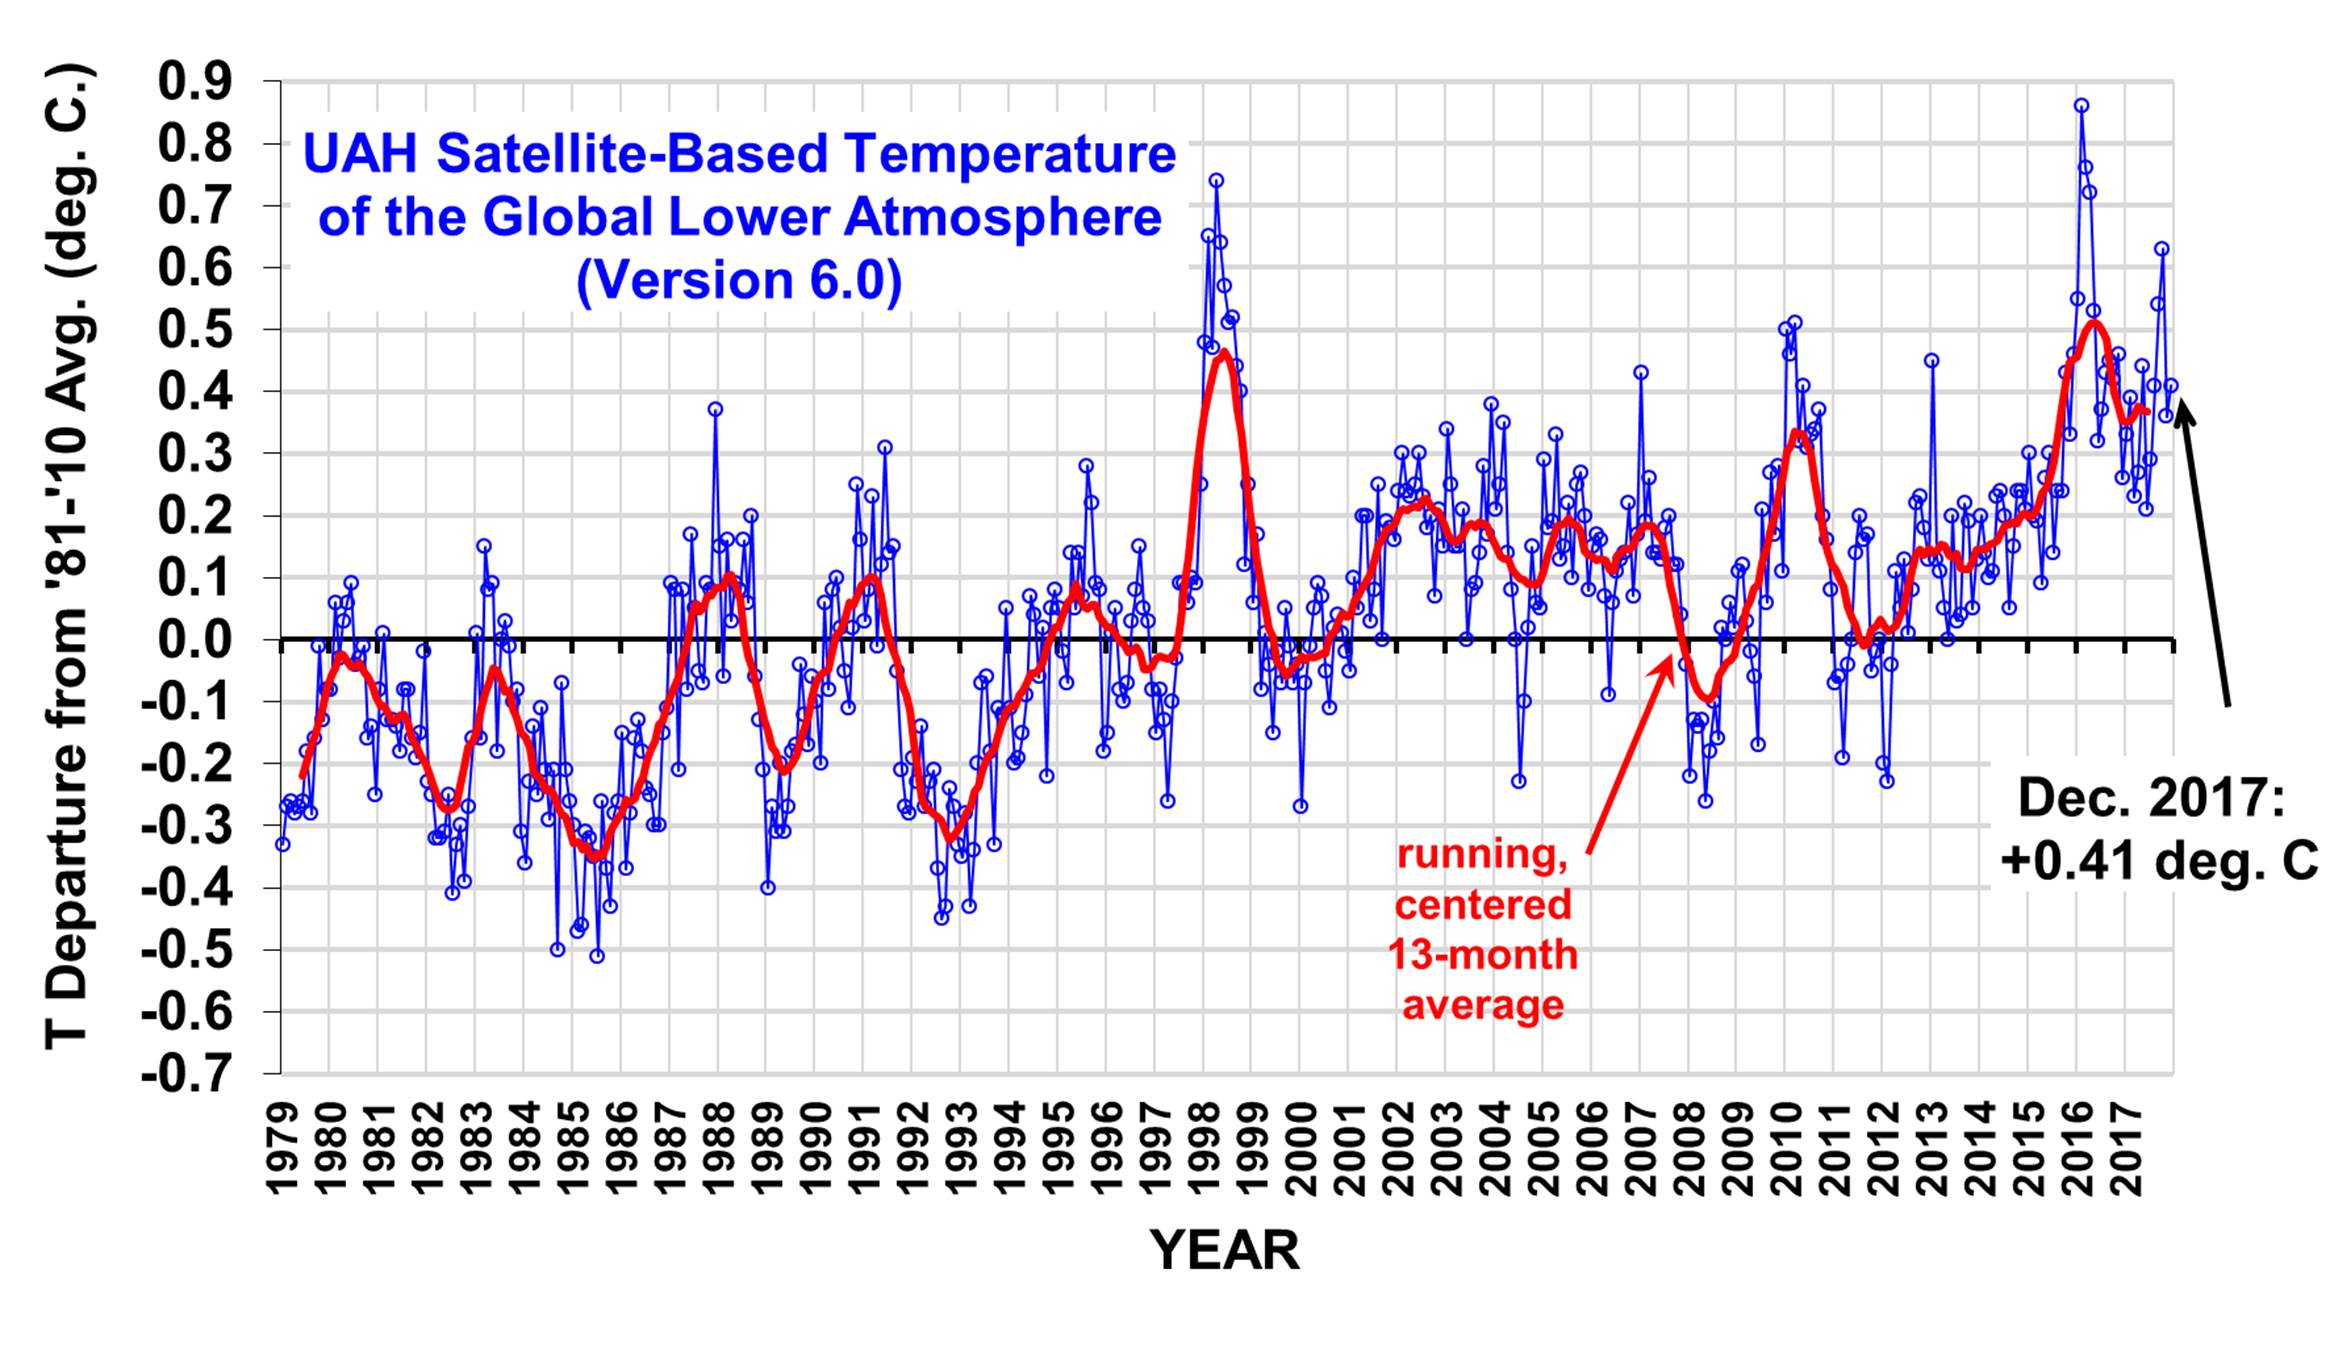
It is only when we can demonstrate that such events are increasingly occurring over, say, 50 to 100 years that we can begin to invoke climate change. (And even then we must debate the various causes of climate change.) So far, that evidence is sorely lacking.


The Sydney Heat Wave

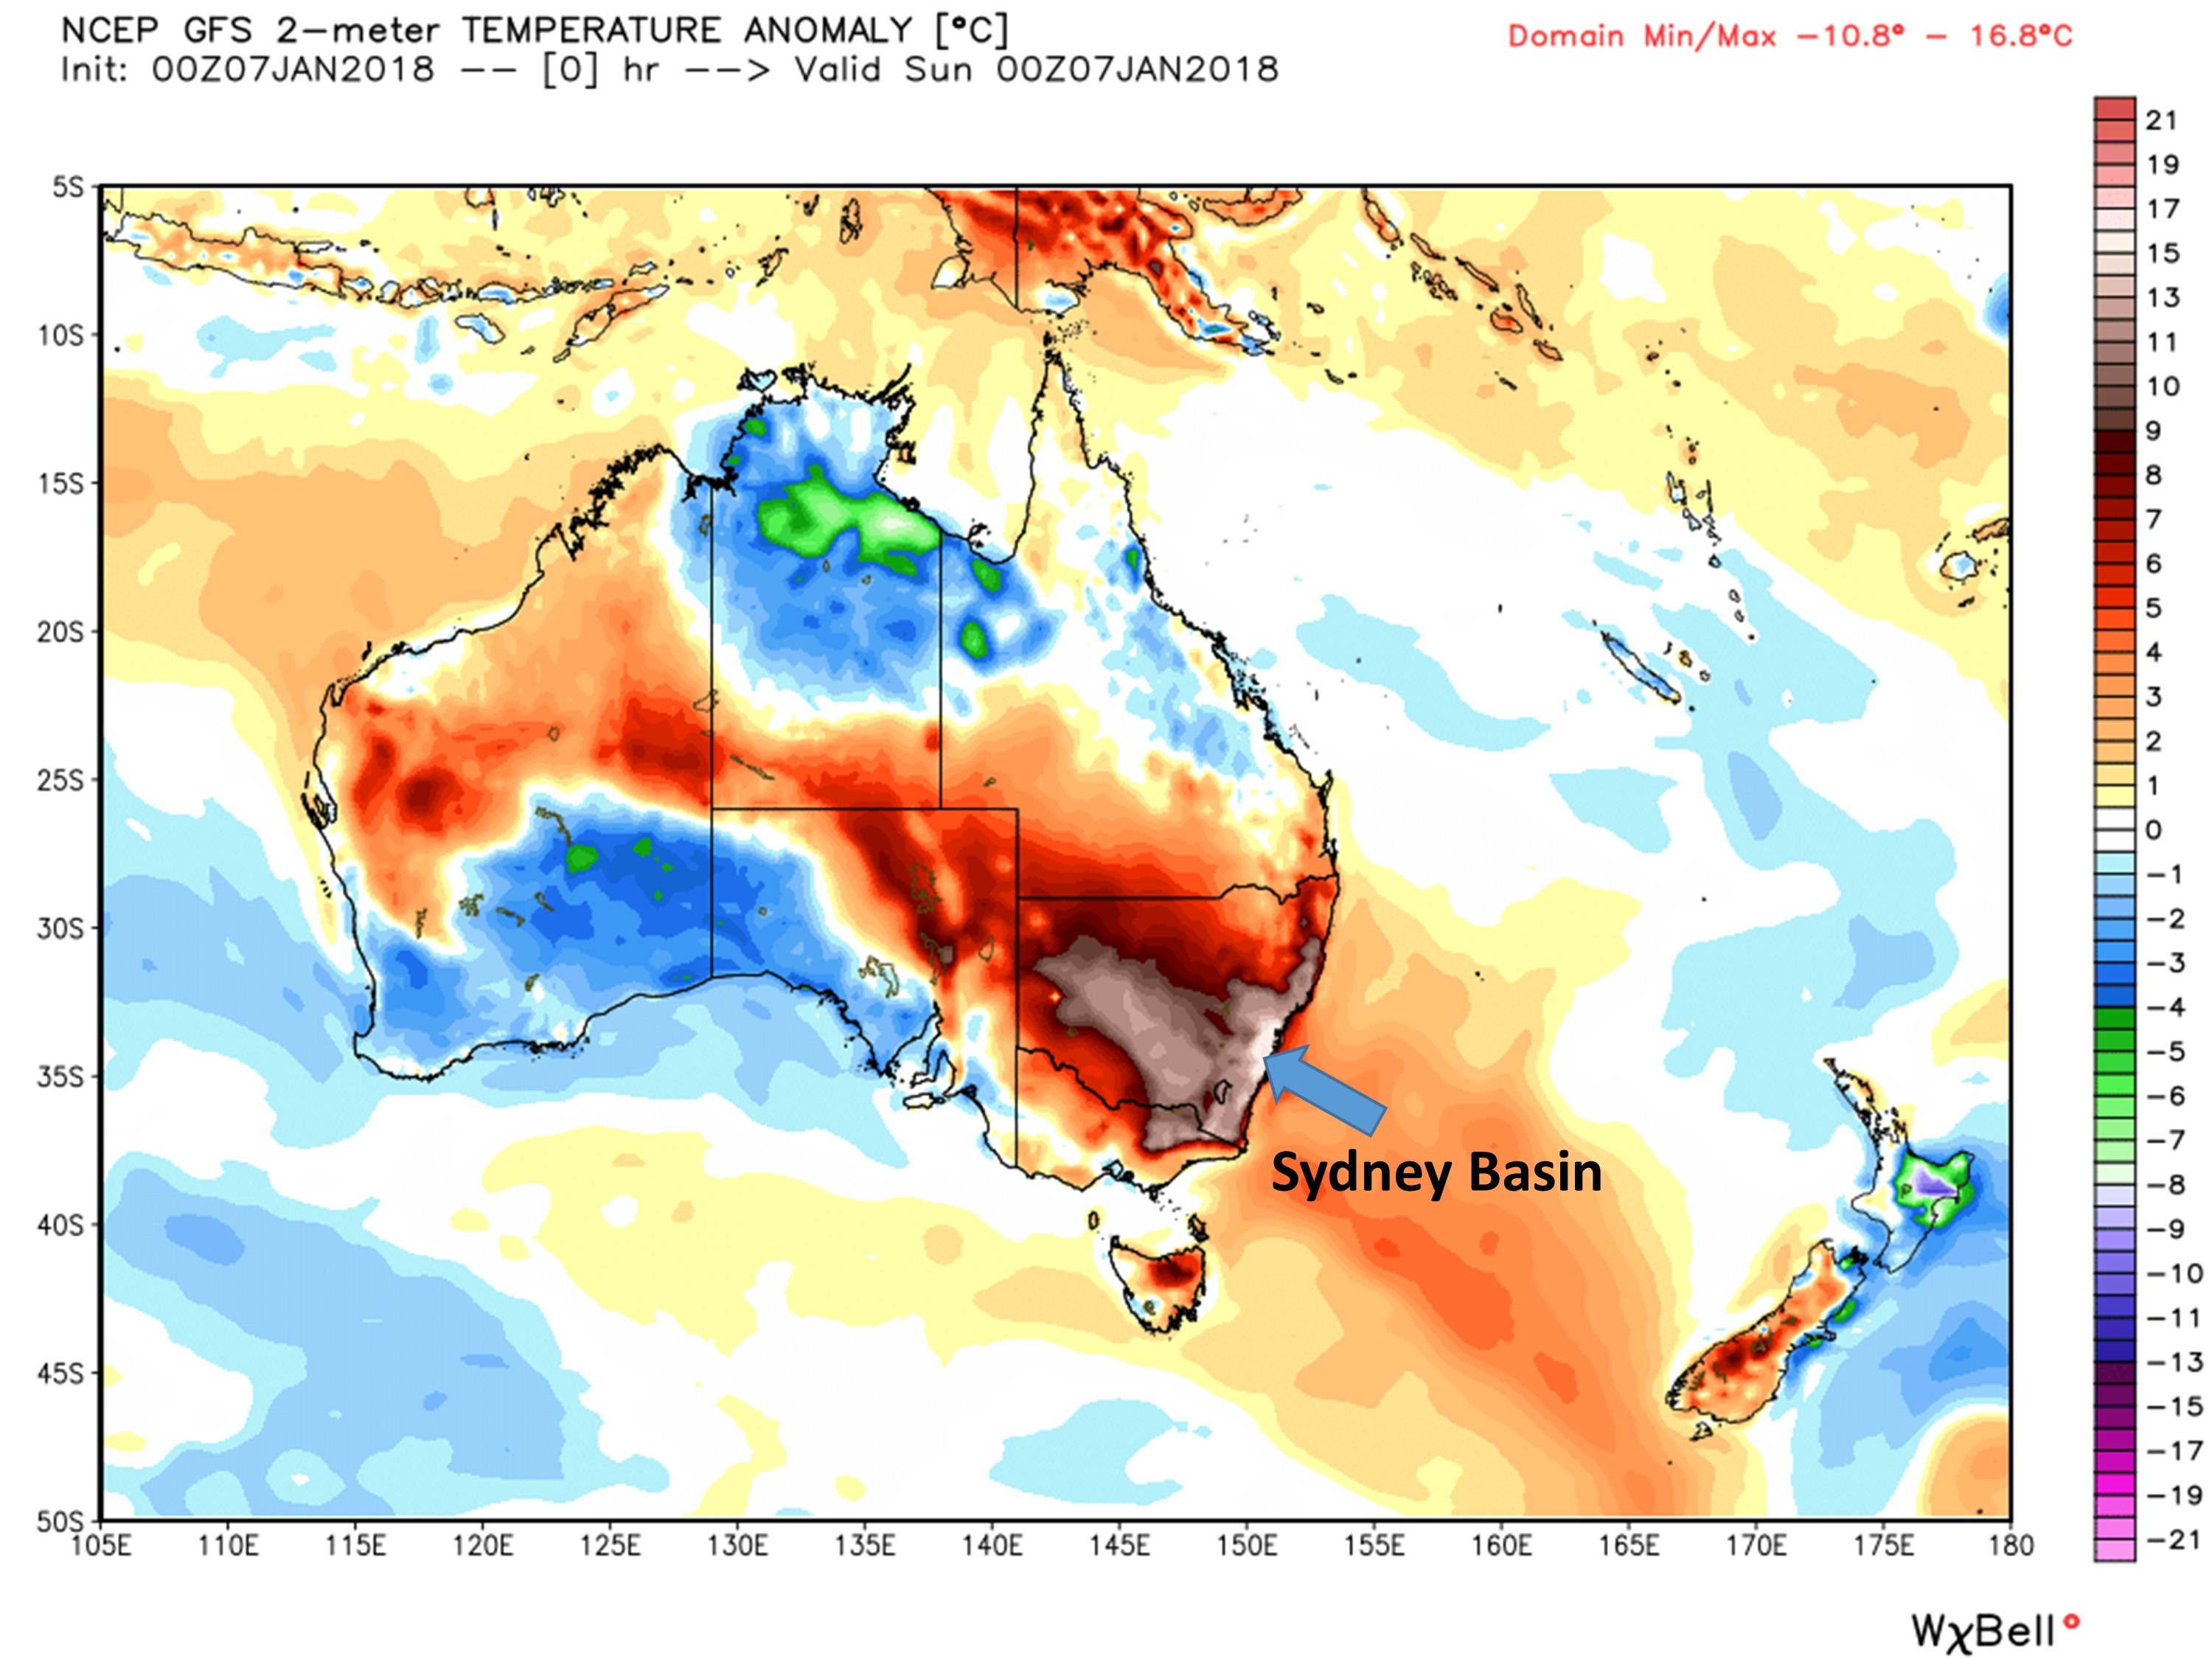
Here’s the GFS forecast model analysis of surface temperature departures from average for about the time that peak temperatures were reached in Sydney yesterday. Maybe you can tell me which of these cold and warm patterns are consistent with global warming theory and which aren’t? (Hint: Warming should be occurring basically everywhere):

GFS analysis of surface temperature departures from normal at about the time 110 deg. F temperatures were reached in Sydney, Australia (Weatherbell.com graphic).

See that hotspot in the Sydney Basin? That is a localized effect of downslope winds from the highlands to the west which causes enhanced warming of the air, as well as bushfires. It clearly does not represent what is happening across Australia as a whole. Australia is exceedingly hot this time of year anyway, heat which is made even worse since the sun is closer to the Earth in January than in July (leading to a 7% range in solar radiation reaching the Earth).
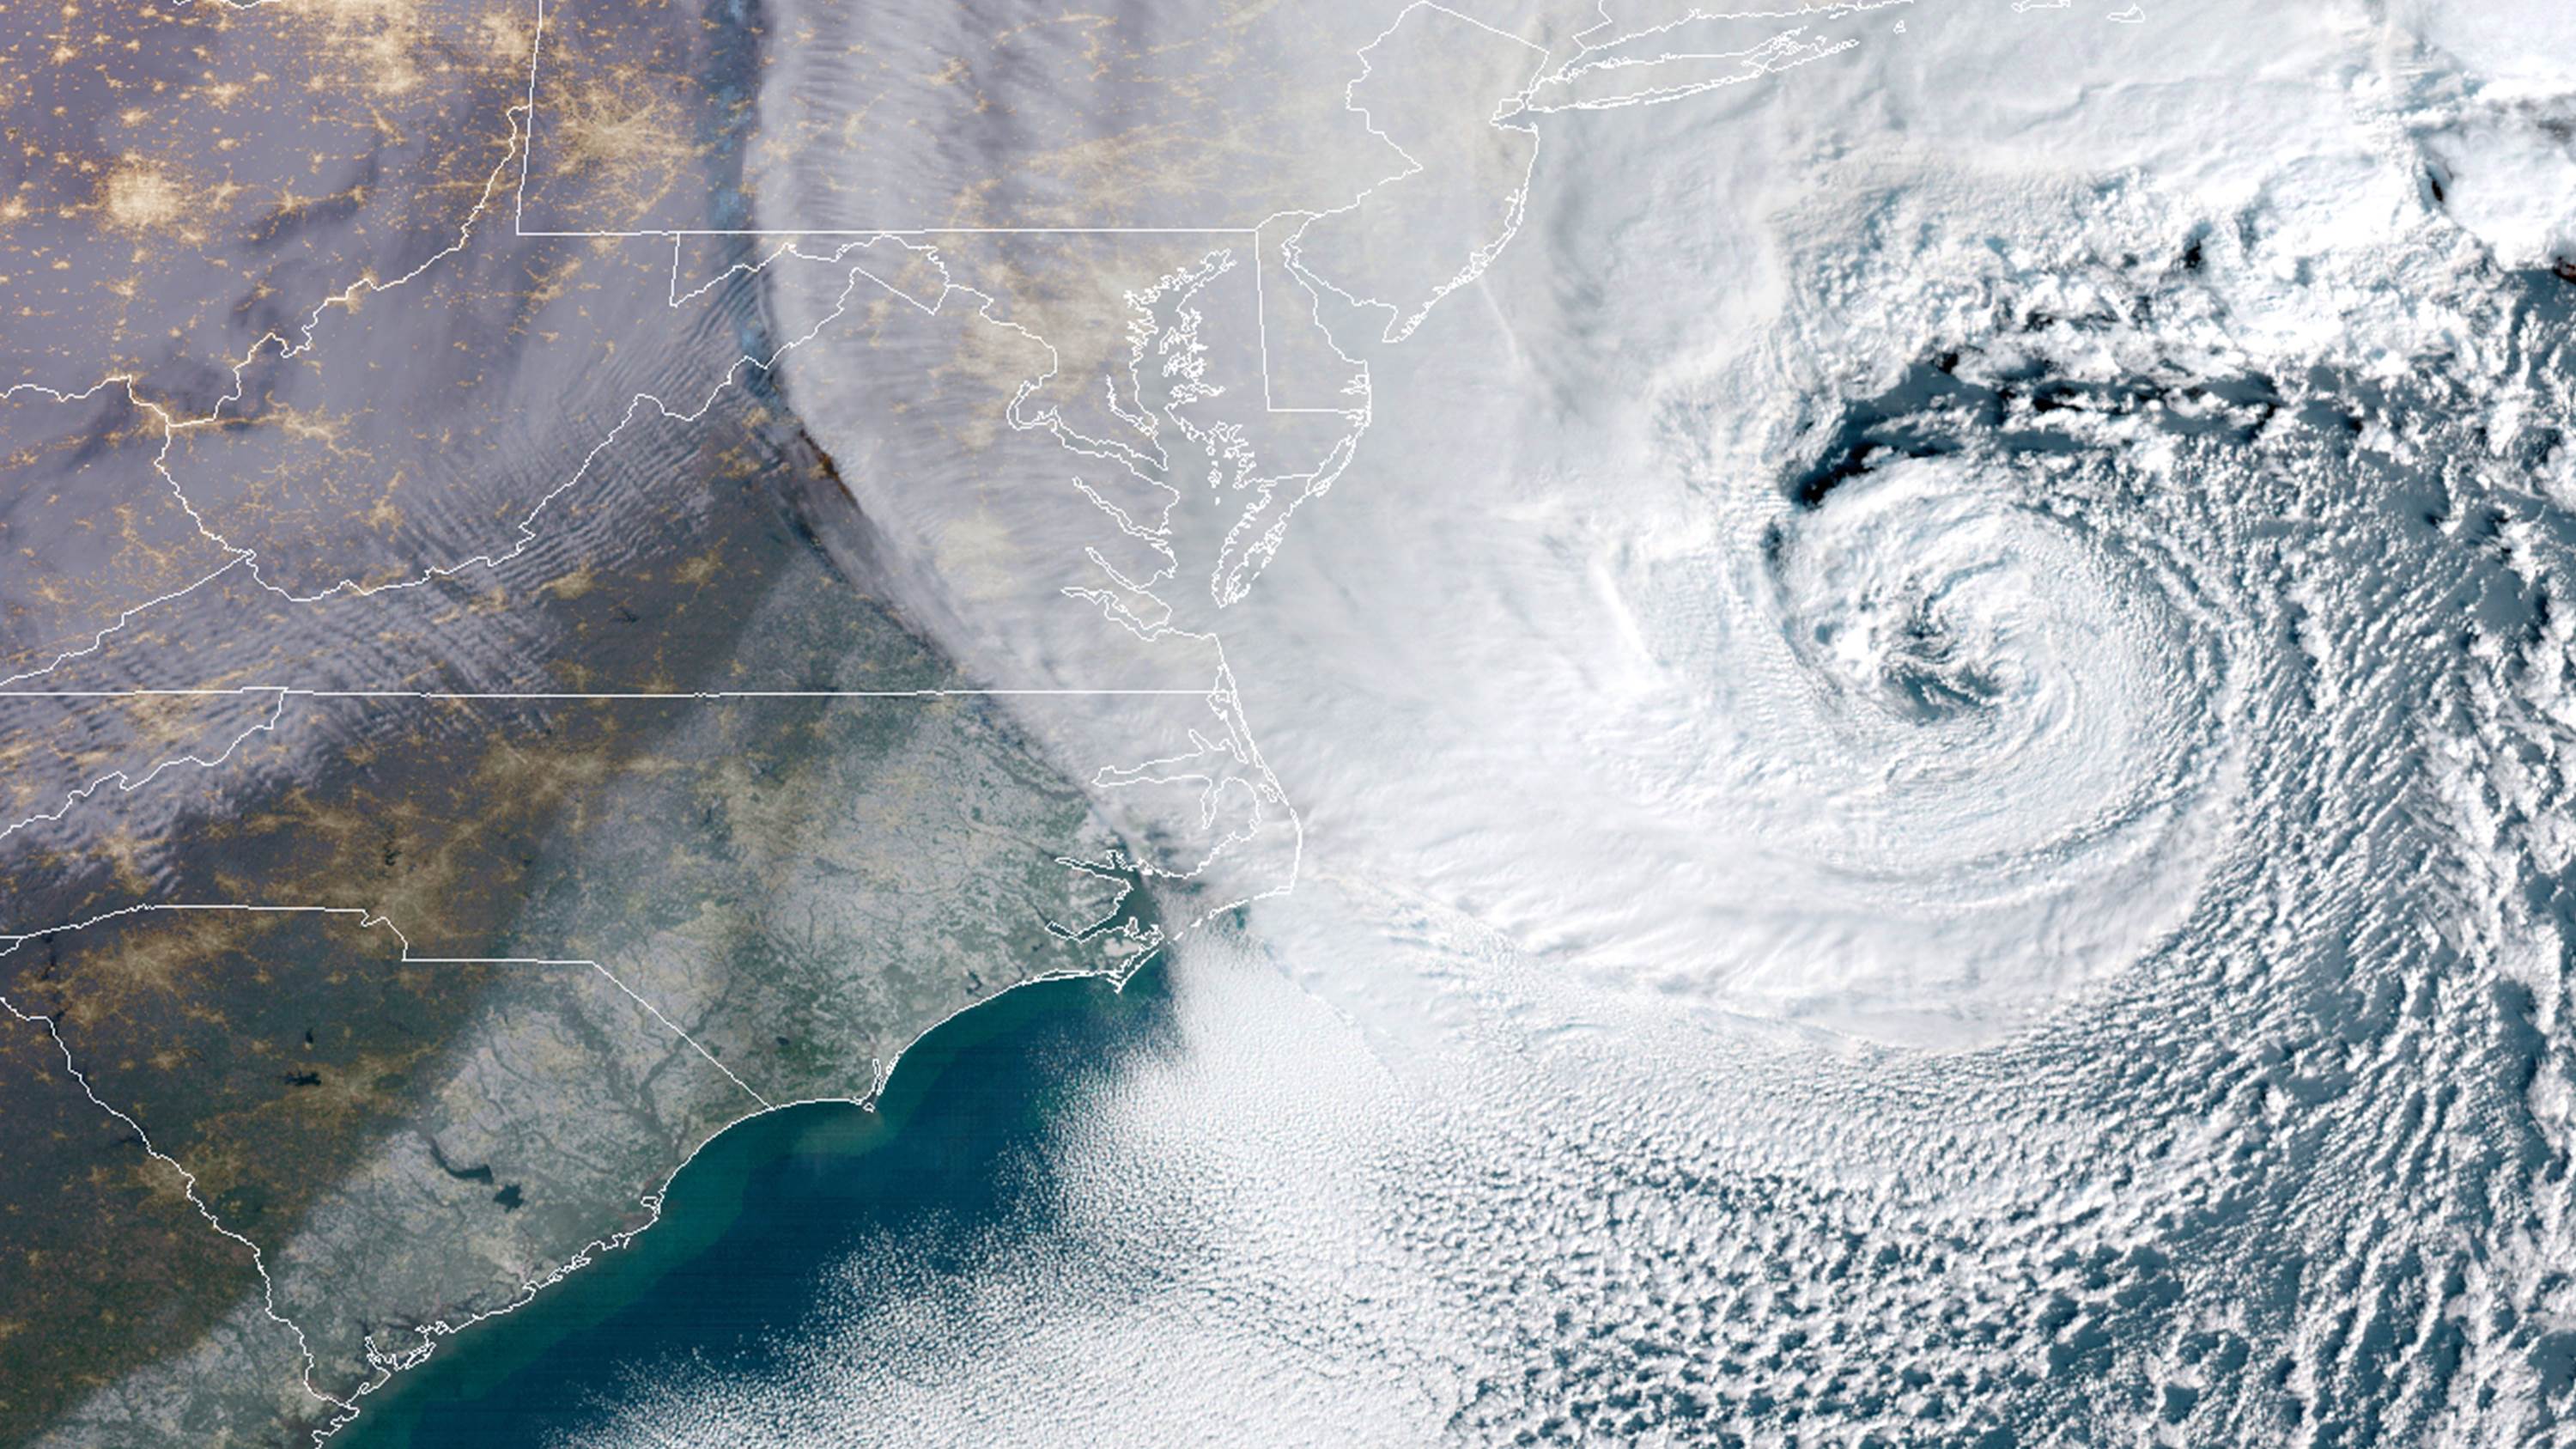
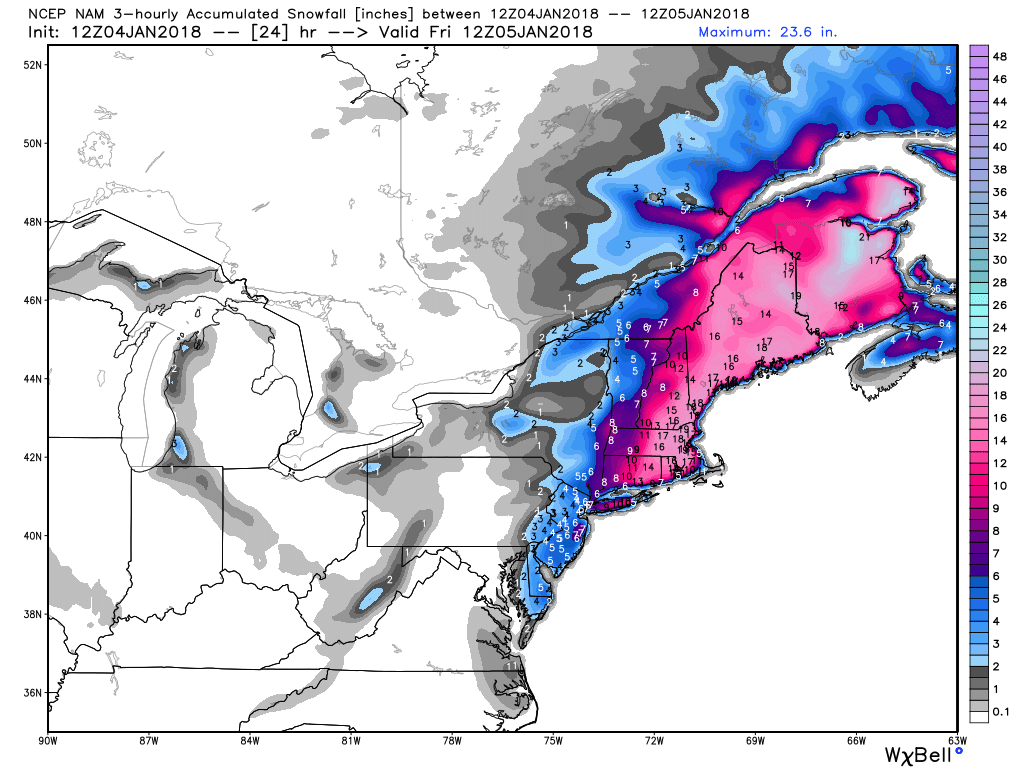
The “Bomb” Blizzard

Meteorologist Fred Sanders coined the term “bomb” in 1980 to refer to a non-tropical cyclone whose central pressure drops by at least 24 millibars in 24 hours.

They happen every year.

But what doesn’t happen every year is them influencing major metro areas. So, the recent nor’easter snowstorm to hit the Mid Atlantic and New England was also a “bomb” because the low pressure center intensified so rapidly. These events happen every year in, for example, the North Atlantic and North Pacific.

We meteorologists used to talk about “bombs” fairly regularly in the 1980s, but not so much in recent years. I wonder if maybe climate change is making winter storms weaker? Hmmm…

And to attribute every winter cold wave or heat wave to global warming is just plain silly. These things happen even without global warming (which, by the way, I do believe is occurring, just not very strongly, dangerously, or maybe not even mostly due to human causation). Seasoned New Englanders can tell you that.

Meanwhile, The Weather Channel (aka “The Disaster Channel”) serves up a steady stream of weather porn to titillate the senses.

And before you believe that warmth in January is unusual, “January thaws” are a routine phenomenon, too, which is why the term was coined. According to the Glossary of Meteorology:

“The daily temperature averages at Boston, computed for the years 1873 to 1952, show a well- marked peak on 20-23 January; the same peak occurs in the daily temperatures of Washington, D.C., and New York City. Statistical tests show a high probability that it is a real singularity. The January thaw is associated with the frequent occurrence on the above-mentioned dates of southerly winds on the back side of an anticyclone off the southeastern United States.”

Nevertheless, the weird-weather-is-climate-change narrative will continue until the populace finally agrees with the warmongers that we can control our weather through taxation and regulation.

Da Bomb

Thursday, January 4th, 2018

GOES-16 image of the intense extra-tropical cyclone at 8:45 EST January 4, 2018.

The rapidly intensifying non-tropical cyclone producing heavy snow and blizzard conditions over the mid-Atlantic and New England is meeting expectations, with localized snowfalls of over 6 inches already this morning.

The latest NAM model forecast of additional snowfall after 7 a.m. this morning until tomorrow morning shows up to 12-18 inches of snow over portions of Massachusetts, Connecticut, Rhode Island, Vermont, and Maine (graphic courtesy of Weatherbell.com):

Maximum additional snow accumulations from 7 a.m. Thursday Jan. 4 to 7 a.m. Friday, from the NAM weather forecast model.

As of 9 a.m. EST, all 5 NWS reporting stations in Rhode Island have heavy snow falling.

The term “bomb” was coined by meteorologist Fred Sanders in 1980 to refer to a non-tropical low pressure area that intensifies at least 24 millibars in 24 hours. They happen every year, and are usually centered offshore in the winter where cold continental air masses meet warm oceanic air masses, providing maximum energy to the intensification process.

UAH Global Temperature Update for December, 2017: +0.41 deg. C

Tuesday, January 2nd, 2018

2017 Third Warmest in the 39-Year Satellite Record

Global Satellite Monitoring of Temperature Enters its 40th Year

The Version 6.0 global average lower tropospheric temperature (LT) anomaly for December, 2017 was +0.41 deg. C, up a little from the November, 2017 value of +0.36 deg. C:

Global area-averaged lower tropospheric temperature anomalies (departures from 30-year calendar monthly means, 1981-2010). The 13-month centered average is meant to give an indication of the lower frequency variations in the data; the choice of 13 months is somewhat arbitrary… an odd number of months allows centered plotting on months with no time lag between the two plotted time series. The inclusion of two of the same calendar months on the ends of the 13 month averaging period causes no issues with interpretation because the seasonal temperature cycle has been removed as has the distinction between calendar months.

The global, hemispheric, and tropical LT anomalies from the 30-year (1981-2010) average for the last 24 months are:

YEAR MO GLOBE NHEM. SHEM. TROPICS
2016 01 +0.55 +0.72 +0.38 +0.85
2016 02 +0.85 +1.18 +0.53 +1.00
2016 03 +0.76 +0.98 +0.54 +1.10
2016 04 +0.72 +0.85 +0.58 +0.93
2016 05 +0.53 +0.61 +0.44 +0.70
2016 06 +0.33 +0.48 +0.17 +0.37
2016 07 +0.37 +0.44 +0.30 +0.47
2016 08 +0.43 +0.54 +0.32 +0.49
2016 09 +0.45 +0.51 +0.39 +0.37
2016 10 +0.42 +0.43 +0.42 +0.47
2016 11 +0.46 +0.43 +0.49 +0.38
2016 12 +0.26 +0.26 +0.27 +0.24
2017 01 +0.32 +0.31 +0.34 +0.10
2017 02 +0.38 +0.57 +0.19 +0.07
2017 03 +0.22 +0.36 +0.09 +0.05
2017 04 +0.27 +0.28 +0.26 +0.21
2017 05 +0.44 +0.39 +0.49 +0.41
2017 06 +0.21 +0.33 +0.10 +0.39
2017 07 +0.29 +0.30 +0.27 +0.51
2017 08 +0.41 +0.40 +0.41 +0.46
2017 09 +0.54 +0.51 +0.57 +0.54
2017 10 +0.63 +0.67 +0.59 +0.47
2017 11 +0.36 +0.33 +0.38 +0.26
2017 12 +0.41 +0.50 +0.33 +0.26

The linear temperature trend of the global average lower tropospheric temperature anomalies from January 1979 through December 2017 remains at +0.13 C/decade.

2017 ended up being the 3rd warmest year in the satellite record for the globally-averaged lower troposphere, at +0.38 deg. C above the 1981-2010 average, behind 1st place 2016 with +0.51 deg. C, and 2nd place 1998 at +0.48 deg. C.

The UAH LT global anomaly image for December, 2017 should be available in the next few days here.

The new Version 6 files should also be updated in the coming days, and are located here:

Lower Troposphere: http://vortex.nsstc.uah.edu/data/msu/v6.0/tlt/uahncdc_lt_6.0.txt
Mid-Troposphere: http://vortex.nsstc.uah.edu/data/msu/v6.0/tmt/uahncdc_mt_6.0.txt
Tropopause: http://vortex.nsstc.uah.edu/data/msu/v6.0/ttp/uahncdc_tp_6.0.txt
Lower Stratosphere: http://vortex.nsstc.uah.edu/data/msu/v6.0/tls/uahncdc_ls_6.0.txt

U.S. Average Temperature Plummets to 11 deg. F

Monday, January 1st, 2018

This morning at 7 a.m. EST, the area average temperature across the contiguous 48 states was a frigid 11 deg. F.

Here’s the high-resolution surface temperature analysis from NCEP, graphic courtesy of Weatherbell.com:

Surface temperature analysis at 7 a.m. EST January 1, 2018.

Over 85% of the nation is below freezing, and nearly 1/3 is below 0 deg. F. The forecast is for cold air to continue to flow down out of Canada into the central and eastern U.S. for most of the coming week.