2017 Third Warmest in the 39-Year Satellite Record
Global Satellite Monitoring of Temperature Enters its 40th Year
The Version 6.0 global average lower tropospheric temperature (LT) anomaly for December, 2017 was +0.41 deg. C, up a little from the November, 2017 value of +0.36 deg. C:
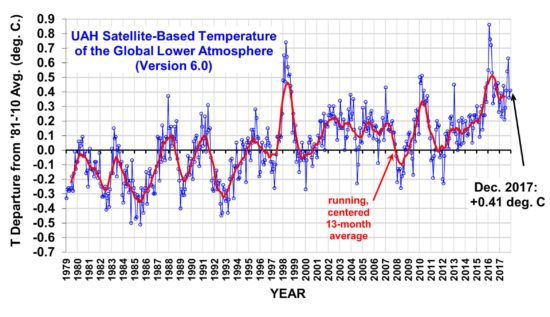
Global area-averaged lower tropospheric temperature anomalies (departures from 30-year calendar monthly means, 1981-2010). The 13-month centered average is meant to give an indication of the lower frequency variations in the data; the choice of 13 months is somewhat arbitrary… an odd number of months allows centered plotting on months with no time lag between the two plotted time series. The inclusion of two of the same calendar months on the ends of the 13 month averaging period causes no issues with interpretation because the seasonal temperature cycle has been removed as has the distinction between calendar months.
The global, hemispheric, and tropical LT anomalies from the 30-year (1981-2010) average for the last 24 months are:
YEAR MO GLOBE NHEM. SHEM. TROPICS
2016 01 +0.55 +0.72 +0.38 +0.85
2016 02 +0.85 +1.18 +0.53 +1.00
2016 03 +0.76 +0.98 +0.54 +1.10
2016 04 +0.72 +0.85 +0.58 +0.93
2016 05 +0.53 +0.61 +0.44 +0.70
2016 06 +0.33 +0.48 +0.17 +0.37
2016 07 +0.37 +0.44 +0.30 +0.47
2016 08 +0.43 +0.54 +0.32 +0.49
2016 09 +0.45 +0.51 +0.39 +0.37
2016 10 +0.42 +0.43 +0.42 +0.47
2016 11 +0.46 +0.43 +0.49 +0.38
2016 12 +0.26 +0.26 +0.27 +0.24
2017 01 +0.32 +0.31 +0.34 +0.10
2017 02 +0.38 +0.57 +0.19 +0.07
2017 03 +0.22 +0.36 +0.09 +0.05
2017 04 +0.27 +0.28 +0.26 +0.21
2017 05 +0.44 +0.39 +0.49 +0.41
2017 06 +0.21 +0.33 +0.10 +0.39
2017 07 +0.29 +0.30 +0.27 +0.51
2017 08 +0.41 +0.40 +0.41 +0.46
2017 09 +0.54 +0.51 +0.57 +0.54
2017 10 +0.63 +0.67 +0.59 +0.47
2017 11 +0.36 +0.33 +0.38 +0.26
2017 12 +0.41 +0.50 +0.33 +0.26
The linear temperature trend of the global average lower tropospheric temperature anomalies from January 1979 through December 2017 remains at +0.13 C/decade.
2017 ended up being the 3rd warmest year in the satellite record for the globally-averaged lower troposphere, at +0.38 deg. C above the 1981-2010 average, behind 1st place 2016 with +0.51 deg. C, and 2nd place 1998 at +0.48 deg. C.
The UAH LT global anomaly image for December, 2017 should be available in the next few days here.
The new Version 6 files should also be updated in the coming days, and are located here:
Lower Troposphere: http://vortex.nsstc.uah.edu/data/msu/v6.0/tlt/uahncdc_lt_6.0.txt
Mid-Troposphere: http://vortex.nsstc.uah.edu/data/msu/v6.0/tmt/uahncdc_mt_6.0.txt
Tropopause: http://vortex.nsstc.uah.edu/data/msu/v6.0/ttp/uahncdc_tp_6.0.txt
Lower Stratosphere: http://vortex.nsstc.uah.edu/data/msu/v6.0/tls/uahncdc_ls_6.0.txt
Warm is good: let the alarmist wailing and gnashing of teeth begin.
“As a result of global increases in both temperature and specific humidity, heat stress is projected to intensify throughout the 21st century. Some of the regions most susceptible to dangerous heat and humidity combinations are also among the most densely populated. Consequently, there is the potential for widespread exposure to wet bulb temperatures that approach and in some cases exceed postulated theoretical limits of human tolerance by mid- to late-century.”
– “Temperature and humidity based projections of a rapid rise in global heat stress exposure during the 21st century,” Ethan D Coffel1, Radley M Horton, and Alex de Sherbinin,
Environmental Research Letters, Volume 13, Number 1 (2017).
http://iopscience.iop.org/article/10.1088/1748-9326/aaa00e
And nobody on this site will be alive to witness this doomsday scenario.
Gotta love unaccountable doomsday forecasts
You’re sticking your head in the sand. Mid-century is only 32 years away. Many will still be alive, even of those here. Don’t you care about the world you leave for today’s children and young people?
(Do you care about the US budget deficit? What’s the difference? The young are the ones who pay for both problems here.)
davie, why do you believe religious zealots always use fear tactics? Do you believe it has something to do with funding/contributions?
G* thinks highly of science.
Nate, you got something right!
“Dont you care about the world you leave for todays children and young people?”
Dave I have read your comments on these threads for a long time now. Do you have any idea how ignorant you come off when you spew comments like this? Your camp is no where near the moral high ground you seem to think you have. For perspective call me a luke-warmer, and I am more worried about RIGHT NOW.
In the name of stopping a 2 degree warmer world – which can’t be done anyway – and we can easily adapt to. The world is turning food into fuel. There are over a billion people with no power, and your pampered ass is part of the reason they die of respiratory illnesses (from having to burn wood and dung) and malnutrition in their millions. We could improve their situation. But in the name of CAGW – for which there is absolutely no empirical evidence – we do not.
So before you talk this crap again I say “You first.” Prove your resolve. Take nothing what-so-ever that was derived from fossil fuels and walk out into the wilderness and just live.
In Minecraft parlance, strip down naked, walk into the woods and punch a tree. I don’t even give you 24 hours.
Bob,
“(from having to burn wood and dung)” I dont see how this problem derives from our energy policies in the US? If anything fossil fuel prices are lower because of efficiency in the West.
“The world is turning food into fuel.”
Massive ethanol expansion was a Bush era program. Many people, including me, agree it is a terrible idea.
Bob: We no longer have the luxury of thinking only about “now.”
Dave Appell, I’m just not seeing the warming acceleration.
For acceleration, look at sea level rise, or Arctic melting, or global glacier mass balance.
“A 20th century acceleration in global sea-level rise,” John A. Church and Neil J. White, Geophysical Research Letters, v. 33, L01602, doi:10.1029/2005GL024826, 2006GRL (2006).
http://onlinelibrary.wiley.com/doi/10.1029/2005GL024826/abstract
“Global and regional sea level change during the 20th century,” Manfred Wenzel and Jens Schrter, JGR-Oceans, (7 Nov 2014) doi:10.1002/2014JC009900.
http://onlinelibrary.wiley.com/doi/10.1002/2014JC009900/abstract
Sea-Level Rise from the Late 19th to the Early 21st Century, John A. Church and Neil J. White, Surveys in Geophysics, September 2011, Volume 32, Issue 4-5, pp 585-602, doi: 10.1007/s10712-011-9119-1.
http://link.springer.com/article/10.1007%2Fs10712-011-9119-1
Here’s a good figure that makes sea level acceleration obvious:
http://www.columbia.edu/~mhs119/SeaLevel/SL.1900-2017.png
ANOTHER “paper” suitable for lining bird cages. Thanks, davie.
Case in point
DA,
That is unmitigated BS. We do not know what will happen even 20 years from now. In science there is the concept of falsifiabilty when evaluating an hypothesis. Those climate models are not falsifiable, therefore unscientific.
You’re confused. Climate models don’t make predictions, they make projections.
Their truest test is to start them at some point, feed in the known emissions data, volcanoes, solar changes, etc., and see if what they output is close to what actually happened. They have skill at doing so:
https://www.climate-lab-book.ac.uk/files/2014/01/fig-nearterm_all_UPDATE_2017-panela-1-1024×525.png
“All models are wrong, but some are useful.”
– George Box
You are misleading readers about the nature of statistical models. I posted the following on another website.
[This] illustrates a risk for novices in statistical modeling, a risk known as overfitting. If you give me a set of data observations, I can construct a complex formula that will predict the given data perfectly – no error at all. However, try to use that complex formula to extrapolate to NEW observations, and you are courting disaster. The complex formula is guaranteed to have a graph filled with wild oscillations, much like the predictions of the climate alarmists.
In statistical modeling, we are taught to cherish parsimony in models, meaning that a simpler model is preferable, even if it maintains a small amount of error. I am disappointed that no statistician has spoken up to refute this fraud. (end snip)
Box, and other practitioners of the past, measured the usefulness of their models by prediction, and comparing observation to prediction. Apparently for you, increasing inaccuracy is a virtue. At some point, the deplorables notice that the emperor is wearing no clothes, and you have ruined the reputation of science.
“Apparently for you, increasing inaccuracy is a virtue.”
Not sure where this notion comes from?
What I see are plenty of papers comparing data to models, and trying to determine what assumptions make some models do better.
No different than any field of research. It is an ongoing process of refining models to better reflect data.
Surak: Climate models aren’t statistical models, they’re physics models. They don’t project by fitting past data, they project by solving the equations that govern climate.
Congratulations on contradicting yourself in back-to-back posts.
Dave Appell, Climate Models only generate imaginary data, some coder imagines a climate scenario codes it and viola the computer generates the requisite imaginary data. Climate models don’t do science.
Dave Appell, you said “. . . theyre physics models.” I don’t think so, not unless they can accurately model multiple-closely-coupled-chaotic-climate-systems, can these GCM’s model chaos theory Dave ?
Climate models are no different from the models uses to design airplanes, bridges, etc — they take input, calculate via the known laws of physics, and get an output.
For your perusal:
“Description of the NCAR Community Atmosphere Model (CAM 3.0),” NCAR Technical Note NCAR/TN464+STR, June 2004.
http://www.cesm.ucar.edu/models/atm-cam/docs/description/description.pdf
‘Climate models dont do science.’
Well…
Science is about predictions and observations. Sometimes a computer is required to solve the eqns and make the predictions.
This is done for black hole collisions (just observed!) or plasma physics for fusion reactors, or testing new microprocessor designs.
Are these also examples of not doing science?!
No DA. They are treated as predictions. But it does not matter. They do not meet the tenets of the scientific method anyway.
No, they are treated as projections. Ever heard of the RCPs? They assume particular futures, none of which will actually come to pass.
They are NOT SCIENTIFIC. The RCP”s are BS. They cannot be falsified, you idiot.
I didn’t say the RCPs are “scientific.” They’re simply assumptions of future energy use.
SkepticGoneWild says:
“We do not know what will happen even 20 years from now.”
That’s the purpose of the RCPs, which are assumptions about future energy use.
And, yes, we can make some intelligent assumptions. For example, one is that this trend will continue:
https://en.wikipedia.org/wiki/Keeling_Curve#/media/File:Mauna_Loa_CO2_monthly_mean_concentration.svg
“In science there is the concept of falsifiabilty when evaluating an hypothesis.”
That’s a simplistic notion. It’s true for experimental sciences, but climate science is not an experimental science, it’s an observational science. (So are geology, astronomy, medical science, and more.)
There is no Earth 2 that we can set up with conditions we’d like to test against and see what happens in 150 years.
https://www.nature.com/articles/s41559-017-0414-1
Dave this extensive savannah is a more likely outcome based (more) on empirical data. Earth was warm in Miocene and we will likely revert to that ecosystem. My home state of Indiana was mediteranian, and to the South in TN and Florida was likely a monsoon. Even last interglacial at 120k yr ago, sea level was 6 m higher so it was much warmer. So I do agree this will be a dramatic change but it is not all doom and gloom. Canada and Siberia will be great. Dont get me wrong if this happens there will be big loosers and winners. And yes countries need to get their population in control before nature does. We cant solve the CO2 problem without population control anyway. People want energy.
Aaron, looks like we have reached the previous interglacial temperatures:
“The global mean annual values were ∼0.5C warmer than they were 150 years ago and indistinguishable from the 19952014 mean. This is a sobering point, because sea levels during the last interglacial period were 6 to 9 m higher than they are now.”
http://science.sciencemag.org/content/355/6322/276
We need much more energy, but count all costs and pick something sensible.
The trouble is that there is hardly “something sensible to pick” in terms of renewable wind and solar energies to replace seriously the fossils. Those can simply not meet the challenge.
We already addressed this topic, Svante.
One may heavily whine about and deplore it but we will most likely burn all the fossil fuels available on this planet.
The only way to theoretically maintain civilization at present population level with little fossils seems to be nuclear fission (and fusion) with their own relevant well known risks and moreover potentially sooner or later many other vital resource’s shortage.
Now the practical and much more likely and realistic way to maintain (or rather rebuild) civilization in future is to “drastically reduce” global population level by at least one or two orders of magnitude.
That’s the real inconvenient truth.
The plan put forward to cool air In Antarctica to make it snow c02 looks like it would work. It would cost lots but less than switching everything to non fossil fuels.
Rofl… Anyone who convinces people to give him money to cool Anrarctica deserves ti live like a king … King of the snake oil salesmen LOL
gammacrux,
Solar and Wind power growth has been dramatic. Some states ND, TX getting a substantial fraction of energy from Wind.
The idea that, in next decades, these sources won’t be playing a significant role in our energy supply seems silly.
Example: US peak electric power 10^9 kW.
PV solar area needed in desert SW for peak power: 10^10 m^2 = 10^4 km^2 = 62 mix 62 mi.
A bit larger than Phoenix metro area.
Not that it would be done that way.
The point is it is 1890, and you are saying electric will never supplant gas light.
it is 1910 and you are saying the horseless carriage will never replace the horse.
It is 1970 and you say cable TV is a passing fad. etc
Nate,
What’s really silly is to believe that wind and solar might ever seriously replace fossil fuels, even if one considers only electricity generation that is, by the way, just a part of human energy needs.
From a physical point of view, it’s simply impossible because of intermittence and the need to implement huge storage capacity, a technology that does not even yet exist at appropriate scale.
The installed power of wind and solar is irrelevant. What’s important is only the relevant fraction of the total energy injected into the grid. It remains (and most likely will remain) small.
Germany is a typical example of fairly large installed wind and solar power and guess what ? Not only did their CO2 emissions not decrease but they even augmented and they burn now more coal than before. Moreover their grid ‘tolerates” that much renewables only because neighbors such as Switzerland or France did not themselves install so much intermittent power.
Similarly worldwide coal consumption never decreased and it still augments In spite of and in part even because of solar and wind power installation. The “cheap” solar panels are fabricated in China with electricity generated incoal plants.
In the US it’s their switch to gas plants that reduced the emissions a bit, not wind or solar.
Again what’s silly is to believe that wind and solar will curb any soon our CO2 emission to an extent that might have an influence on climate..
“From a physical point of view, its simply impossible because of intermittence”
Impossible is a strong word and one should be cautious in using it. Not impossible from a fundamental POV.
Storage is an issue, but it is being vigorously researched, and even today there are promising options, batteries, pumped hydro, hydrogen, thermal, flywheels, compressed air.
Germany got freaked by Fukushima about nuclear, made a political choice.
“Similarly worldwide coal consumption never decreased and it still augments In spite of and in part even because of solar and wind power installation.”
That is just an assertion. Asian energy demand has grown dramatically in two decades. That is the main reason coal consumption increased.
Nate,
Well, when I say “impossible”, I mean impossible with present technology at a scale that might allow a decent life of and energy supply to 7+ billions people.
I quite agree that it’s certainly not impossible at a smaller scale.
I got sensible comments only, how refreshing!
I’ll continue on Nate’s comment below.
Methane with nuclear are the best viable options. I agree wind and solar are unrealistic to scale up in most situations. Also we should have a conversation about population. Its simple math US consumption per capita is dropping fast… its the population growth that is the issue. Final add, lumping all hydrocarbons or fossil fuels together is a dirty political trick. Coal and methane are totally different in CO2 production and more importantly for pollution. Asking developing countries to jump to wind and solar is crazy. That money should go to methane infrastructure. We need to get them off of open fires with dung and wood and on methane. Its a cruel joke to keep them in poor air conditions for a political stance.
“We need to get them off of open fires with dung and wood and on methane. Its a cruel joke to keep them in poor air conditions for a political stance”
Your the 2nd person to state this odd correlation between dung fires and renewable energy. Please cite some source for this notion.
Nate,
“Your the 2nd person to state this odd correlation between dung fires and renewable energy. Please cite some source for this notion.”
Im not sure what you are disagreeing with? Obviously pollution is huge from indoor cooking. Solar and wind are more and less reliable than methane in many places (Africa, Asia, etc).
https://www.sciencedirect.com/science/article/pii/019689049400086F
http://www.who.int/mediacentre/factsheets/fs292/en/
We need everything we can muster.
A 4th generation reactor by a guy from my home town:
https://tinyurl.com/yar84gas
It would be wrong for government to prescribe technical solutions, it should just put us in the sweet spot here:
https://tinyurl.com/ybqjzrs6
Government does have a role in fundamental research, for example fusion power.
Aaron,
You’ve said something is bad, dung fires, and its a direct result of something else, renewable energy.
I asked for evidence of connection.
All you give is evidence that the thing is bad.
If there is no grid in parts of Africa,
1. Is it because of renewables?
2. Is having non-grid power a bad thing?
Dubious claims.
https://www.sciencealert.com/denmark-got-42-of-its-electricity-from-wind-last-year-smashing-the-world-record
re: intermittency
Yes, we talked about this before.
Avoid static thinking, we are talking about a moving target.
Battery prices are coming down fast, but it’s not just about storage.
Denmark can have 42% wind power because Norway can balance it with water power. The same is possible on the american west coast and other parts of the world. There will be an international H*V*D*C grid that can even out local fluctuations.
Of course the grid needs backing power, natural gas turbines etc., just like now. Consumption can be adapted with variable prices, and major consumers can agree to cut back once in while.
David Archer said known petroleum reserves may not be enough to put us over +2 C, you need coal for that. I think he is wrong because new technology keeps giving us more and more oil. Anyway, the transportation sector has only 14% of the total CO2 emissions (last time I looked). It could run on natural gas, but it looks like electricity is cheaper.
I think Richard Muller is right that we need fracking and natural gas as a stop gap measure. In fact we need everything we can find.
Traditional nuclear power is not so cheap with modern safety standards (clean coal is not that competitive either), although there are a lot of promising developments.
Anyway, consumers must be given a true price to make optimal choices, and to create incentives for new solutions.
Certainly, I think so too.
Yet the challenge is so formidable that there is no reason (as unfortunately done repeatedly in media in France- and even academia in the US- ) to tout there simply exists a satisfactory “solution” with nearly 100% renewables.
What is despicable is to delude people and tell them lies such that wind turbines and solar photovoltaics might readily “solve” the problem without drastic economic recession.
https://ourfiniteworld.com/2017/07/22/researchers-have-been-underestimating-the-cost-of-wind-and-solar/
And this is just the problem to maintain (and in poor countries merely install from scratch and develop) an electric grid.
And then there is the problem of agriculture, transport, fishing, public works, logging etc. Tractors, trucks, airplanes etc will still need liquid hydrocarbons because there is simply no serious alternative solution. The fuels might be synthetic but there is by now no economic way to do this with renewables.
“satisfactory solution with nearly 100% renewables.”
Strawman.
Sensible people are all talking about an energy mix, with ramping up over decades of renewables.
And, of course, the market playing a large role in determining which energy sources are dominant.
The link is had some good points, but seemed stuck in antiquated pricing schemes.
“Economists have set up their economic models as if we would never reach limits.”
On the contrary, economics is all about allocation of scarce resources.
I agree it will take decades, markets must have time to find the optimum without a recession.
Not true in media and politics. Delusion is ubiquitous.
And, sadly, not even true at all in academia:
http://web.stanford.edu/group/efmh/jacobson/Articles/I/CombiningRenew/CONUSGridIntegration.pdf
And by the way, according to the so-called “scientific consensus” itself, a rapid and drastic transition to low carbon energy sources is allegedly mandatory if one is to expect a sizable mitigation effect.
Gamma,
The article is great evidence against your ‘impossible’ claims. Offers possible solutions.
Here are academics suggesting an mix and 5 decade ramping:
http://cmi.princeton.edu/wedges/intro.php
That last link has most of the things we have been talking about.
Perhaps we are in agreement – it’s just a matter of time.
The way I see it, you don’t have to worry about solutions if you put the right price on all those risks and damages. If we keep burning coal it means it is worth it and those other solutions are just too difficult.
Indeed, IMO the strategy proposed in Nate’s link is certainly much more serious and credible than Jacobson’s one.
Good for you SkepticGoneWild. Over that first denial hurdle! 🙂
No. I said warm is good, Einstein.
Maybe read before commenting. “2017 ended up being the 3rd warmest year in the satellite record”.
Maybe you should learn to read English. Your response to my first comment was just plain dumb. Were you dropped as a baby?
“… behind 1st place 1998 with +0.48 deg. C, and 2nd place 2016 at +0.44 deg. C. Thus, despite recent warmth, we are now entering the 20th year without beating the record warmth of 1998.”
Am I missing something?
According to UAH TLT V6, as linked to above, the year 2016 was +0.51 deg. C, not +0.44 as stated.
That would make 2016 the warmest year in the UAH TLT record, with 1998 in second place.
We’re now entering the 2nd year without beating the record warmth of 2016.
Rgds
TFN
and perhaps it would be fair to add an acknowledgement that
“this means that 2016 and 2017 are both in the top 3 warmest years in the UAH TLT V6 dataset, despite the prevailing weak La Nina conditions that prevailed from the second half of 2016 until the present”
And 2017 actually is the warmest non-el nino year in the record.
2017 may yet be called a la Nina year if current conditions persist.
I think when considering ENSO it makes more sense to use the ENSO season as the year (July-June) and then calculate the seasonal temperature.
http://ggweather.com/enso/oni.htm
Then for the 2016-2017 season (July2016-June2017), which had a weak La Nina, UAH LT global was the warmest La Nina season in the record, and the 4th warmest season overall.
For the N.O.A.A. surface temperature, 2016-2017 was also the warmest La Nina season, but the 2nd warmest season overall.
I don’t think it makes much difference. The peak lag in cross-correlation of TLT datasets with the unsmoothed Nino data is 3-4 months, and there are still significant correlations at a lag > 12 months. In other words, whats happening with ENSO now will have its strongest effect 3-4 months later and continue to affect the following year. Since ENSO event onset also slips back and forth by a few months (the current weak La Nina was very later forming, for example) you ay as well use a calendar year.
That said, it doesn’t matter how you look at it, any direct effect of the 2015/16 El Nino is well and truly over, with ENSO having first swung negative back in July 2016…. So its very hard to explain 2017’s warmth using ENSO, let alone December 2017 (2nd warmest in the UAH record if I’m not mistaken – after 2016).
No, 2016 is still the warmest year (0.51 C) with 1998 in second place (0.48 C).
In all other troposphere datasets (satellite, radiosonde, reanalysis) 2017 will likely be the second warmest year after 2016.
Indeed.
Even the table printed in the post shows that 2016 averaged 0.51. Some clarification is called for perhaps…
TFN
let me recheck the numbers…I whipped up the spreadsheet pretty fast.
Dang! My profound aplologies…will fix thge post.
Thanks Roy. Thought it was me for a minute. Feel free to delete my posts referring to it once you make the fix. Happy New Year.
TFN
A few calculations …
Here are the 12 month periods with the highest averages (with the end date listed)
Year Mo 12MonAvg
2016 11 0.528
2016 9 0.518
2016 10 0.518
2016 12 0.511
2016 8 0.502
2017 1 0.493
2016 7 0.486
1998 11 0.483
1998 12 0.483
1998 10 0.480
>Tim Folkerts says: January 2, 2018 at 9:01 AM
> A few calculations
I guess that’s essentially what the red line on the plot is showing.
Another metric could be the period since some milestone value was last seen. eg It now appears to be some 30 months since a monthly anomaly of <0.2C was last seen. No previous period has even come close.
Johnd,
Funny you should mention streaks. I was looking at that too (before life interrupted).
Here are the lengths (in months) of the longest streaks at or above a given threshold along with the end date. (In parentheses are the next longest streak and the end date)
0.0 69 @ *NOW* (41 @ JUN-04)
0.1 32 @ *NOW*(15 @ NOV-10)
0.2 29 @ *NOW*(11 @ OCT-98)
0.3 14 @ NOV-16 (10 @ OCT-98)
0.4 10 @ OCT-98 (6 @ MAY-16)
Its pretty similar for 13 month running averages.
0.0 88 @ NOV-07 (69 @ *NOW*)
0.1 59 @ *NOW*(37 @ JUN-04)
0.2 32 @ *NOW*(15 @ DEC-98)
0.3 23 @ *NOW*(11 @ NOV-98)
0.4 12 @ SEP-16 (6 @ AUG-98)
Basically a few record-long streaks occurred with the 1998 el nino — all others were set in the last couple years (and/or continue to grow each month now).
That streak will have to be broken before there’s any basis for talking about “imminent cooling.”
Latest 5 year average 0.291. 0.125 above previous 5 y record.
Looks like it will continue to increase this year-given that 2013 ave was 0.1
So much for the cold in the US. The globe does not put America first.
3 days of below freezing, similar rain, similar heat will probably keep things similar. I still wager both sides will be surprised at the new climate equilibrium, so best to start getting along now.
Pray tell us what you mean by “the new climate equilibrium”
Sorry, just another alien name.
Alarmists claim runaway climate, which hasn’t happened so obviously there are mechanisms that aren’t understood. Deniers don’t trust their own climate sensors and even basic climate logic. Draw the line between the positions.
Who’s claiming “runaway warming?”
And even if they were, it certainly wouldn’t have happened by now. Global warming is just getting started….
In fact, the model results look quite good:
https://www.climate-lab-book.ac.uk/files/2014/01/fig-nearterm_all_UPDATE_2017-panela-1-1024×525.png
Alarmists claim runaway climate
No, strange people on the net claim that “alarmists claim runaway climate.”
There’s a large army of straw men out there.
I think I represented the loudest arguments fairly.
Really? Then you should have no problem supplying a bunch of links to the MSM verifying that “alarmists” are claiming “runaway climate.”
And maybe you want to qualify what you mean by “alarmists.” Do you mean science researchers? You’re going to have little luck substantiating your claim there. If you mean journalists you’re going to have more luck finding examples, because the news media are sensationalist by nature.
As you think it is one of the “loudest” claims there should be plenty of independent references pointed to in the MSM.
MSM, of course, otherwise you’re not talking about anything “loud”.
Roy, what do you make of 2017’s warmth? Last January you guessed the year would end up about 0.20 C. Just a guess, granted. Do you see any contributing factors, or just a noisy fluctuation?
“Roy W. Spencer, Ph. D.says: “”If I had to guess, I’d say 2017 should be around 0.20.””
http://www.drroyspencer.com/2017/02/uah-global-temperature-update-for-january-2017-0-30-deg-c/#comment-236370“
davie, this is the second day of the New Year. Why not take this time to turn your life around? Why not try to get a job? Walmart is hiring and they promote from within. Who knows, maybe in a few years you could work up to assistant manager?
Go for it!
David,
0.13C per decade. No change. We are not doomed. The end is not near. The sky is not falling.
Chill, dude.
Uh… that IS change, and it’s statistically significant change.
1.3C warming in a century would be the fastest rate of global change since the ice ages.
To put a number on global change during the last thaw from ice age: 5C over 5000 years.
That’s 1C per thousand years. Globe is warming 10 times as fast now?
barry
I am not sure if your logic with this post is correct. I do not know if it acceptable to take an average temperature over a certain period to derive a rate of warming or cooling.
Consider this article:
https://www.nature.com/scitable/knowledge/library/abrupt-climate-change-during-the-last-ice-24288097
This article indicates climate was very chaotic during the time 18000 to 80000 years ago. Just taking an average does not really give much indication to what was actually taking place. If the climate was in a highly chaotic state your average does not really show this. In the article it said very rapid temperature changes over Greenland took place in the time scale of decades and it was quite a bit of change. I think they also indicate the changes could have been on a global scale.
“I do not know if it acceptable to take an average temperature over a certain period to derive a rate of warming or cooling.”
Bell tolls…
Yes, averages lose a lot of information. The average of 49 and 51 is 50 and the average of 1 and 99 is also 50. Different data sets – identical averages. Or as one of the entries in my tag lines and quote files says:
“Be careful of averages, the average person has one breast and one testicle”
-Dixy Lee Ray
Norman,
Greenland surface area is 0.5% of global.
It is by no means clear that the abrupt changes in Greenland are reflected globally.
In Antarctica the Byrd core from West Antarctica, and probably the Vostok and some other cores from East Antarctica, show events that are correlative to the larger millennial events of Greenland, including the Younger Dryas (6, 31). Byrd and Vostok also contain indications of events that may be correlative to nearly all of the Greenland events (31). However, the ice isotopes indicate an antiphase behavior, with Byrd warm during the major events when Greenland was cold; dating control is not good enough to determine the phase of the smaller events. The general impression of the Antarctic events is that they are smaller and less abrupt than those in Greenland, although fewer paleothermometers and other indicators have been brought to bear in Antarctica, reducing confidence somewhat.
To further complicate the issue, the Taylor Dome core from a near-coastal site in East Antarctica appears to be in-phase with Greenland and out-of-phase with Byrd during the deglacial interval centered on the Younger Dryas (32). As reviewed in ref. 33, non-ice records from broadly distributed sites in the Northern Hemisphere indicate large, abrupt changes (near-)synchronous with those in Greenland, with generally cold, dry, and windy conditions occurring together although with some sites wet perhaps because of storm-track shifts (cf. ref. 28). Some Southern Hemisphere sites also exhibit the Greenland pattern during the deglaciation, although high-resolution (annually resolved) southern records are still lacking. However, southern sites near and downwind of the south Atlantic show an anti-Greenland pattern with millennial warming when Greenland cooled, superimposed on the slower orbital variations, which are broadly synchronous in both hemispheres.
http://www.pnas.org/content/97/4/1331.full
To answer your larger point, Norman, The long-term change in the last ice age transition is something we’re much surer of than short-term global change through the transition period. I put my final point with a question mark to leave it somewhat open-ended, being aware of the Greenland record and what it suggests, and correlation issues – go with what is well-established, but keep an open mind.
If there were abrupt changes over that past period, the corollaries for times present are a double-edged sword. One could argue that current change is nothing new, or one could argue that it doesn’t take much for global climate to tip into a fairly radically new regime.
I would actually expect major shifts during a long-term major change, rather than a completely smooth transition, but the evidence on what degree of change occurred globally in relatively rapid shifts is inconclusive.
Warming is now about 30 times faster than the average rate of warming coming out of the Last Glacial Maximum.
Hard to say for sure on centennial scale, lacking good global resolution.
Sure. I mean the long-term average over many millennia.
I’m quite surprised the tropics didn’t cool.
Eh – the linked text file dataset of the lower troposphere has data only going through 2017/11. Near the top of this article is an image of text file data going through 2017/12. Where is the source of the new data for December 2017? Thanks.
Ah, I just saw the note stating that the files will be updated in the next few days.
If you are eager, you can use the date in this post and append it to the spreadsheet. It doesn’t have all the columns, but it has the key global data.
Thanks for the quick updates, Dr. Spencer! Happy New Year! I look forward to another excellent year!
Indeed. The updates are the only reason why I keep coming back.
What does average temperature mean?
http://pamola.um.maine.edu/wx_frames/gfs/ds/gfs_world-ced_t2anom_1-day.png
Do you need to have an average explained? Or do you need to learn the difference between daily temps and the ones used here?
“What does average temperature mean?”
You mean, for an entire planet?
If T(x,y,z) is the temperature at any point on the Earth’s surface, then its average is defined as for any function:
= (1/surface_area)*surface_integral_of_T
In practice the integral is approximated numerically.
In other words, the temperature of a planet is the output of a formula… which is fine and, really, it couldn’t be otherwise.
Weirdly, most people do not understand this and freak out when you tell them. After all, they protest incredulously, Earth’s temperature must be a FACT because… what if the formula is wrong? Are there no other formulas? Has the temperature of every point on Earth the same importance as any other point when calculating the average? Are the temperatures of every point on Earth really known so that it is actually possible to then calculate their average? Is the temperature on top of a mountain the same as that on a beach? And so on and on, they go, freaking out.
No, the AVERAGE temperature of a planet is the output of a formula.
Don’t pretend you can’t read.
I reckon this tale of people ‘freaking out’ for the reason stated is imaginary.
But, what does it mean physically? Temperature is an intensive variable.
If you don’t know the definition of the temperature of a gas, look it up.
Indeed, in Asia is now a bit warmer than in North America.
http://files.tinypic.pl/i/00953/vipib66r6az1.png
Asia is quite a bit warmer than it normally is:
http://pamola.um.maine.edu/wx_frames/gfs/ds/gfs_world-ced_t2anom_1-day.png
And check out all the warmth in Russia. While the US is plunged into cold, the whole Northern Hemisphere is nearly 1C above baseline.
Yes, Siberia and Alaska are scorching:
http://pamola.um.maine.edu/wx_frames/gfs/ds/gfs_world-ced_t2anom_1-day.png
This is how the left portrays this issue. It is laughable.
No Joke. During Record Cold Spell, The Guardian Warns of Global Warming
https://co2islife.wordpress.com/2018/01/01/no-joke-during-record-cold-spell-the-guardian-warns-of-global-warming/
I think its funny that you think the Guardian, in the UK, should care about a cold spell in the US, when the world experienced well above average temps.
“… when the world experienced well above average temps …”.
By definition “average means “… a number expressing the central or typical value in a set of data …”.
Why not do it simple, use the “average” in Dr. Spencers data, and that’s the anomali for 1979 – 2010;
http://clivebest.com/blog/?p=7960
Climate average is a well-defined thing. Usually a 30 y average for a date and place.
You can find this on most weather sites for your town.
Why should the rest of the world care about a not record high Cold spell in the Eastern part of US?
Are You suggesting that during Cold spells in the US, reporting or debating climate should be forbidden? Why not suggest a presidential order; during cold spells in the US, approximately 2% of the Worlds area, any mention about climate, AGW, Global Warming or Environment is punishable by death.
What a self-centric crackpot You must be.
During Record Cold Spell, The Guardian Warns of Global Warming
Unlike CO2isLife, the Guardian realizes that the US is not the whole world.
The Northern Hemisphere is 0.9C above average, even while the US is way cooler than normal for this time of year.
http://pamola.um.maine.edu/wx_frames/gfs/ds/gfs_world-ced_t2anom_1-day.png
That’s because the US is only 7% of the surface area of the NH.
barry says … at 8:51 PM
“…the Guardian realizes that the US is not the whole world.”
One of the best responses to that argument I’ve seen:
“richard verney July 8, 2017 at 6:24 am
Given:
1. CO2 is said to be a well mixed gas and therefore operates in like manner on a global scale (subject to differences in humidity/water vapour feedback); and
2 The US is a large tract of Northern Hemisphere land; and
3. The US is a good representative sample of geography and topography, and is therefore a valid sub set of the behavoir of land masses in the Northern Hemisphere;
4. The US has the best sampling of data of any significant land surface.
If the US is not showing warming (the US was warmest in the 1930s/1940s), one would needs a strong explanation as to why the US is an outlier and not behaving in the same manner as the Northern Hemisphere as a whole.
The fact is that when you have good quality data, there is no warming, just multidecadal variations, seriously begs the question as to the quality and validity of the data for other areas, and whether the so called AGW thing is just a data issue brought about the manner in which poor quality data with insufficient spatial coverage is presented.”
https://wattsupwiththat.com/2017/07/07/how-they-airbrushed-out-the-inconvenient-pause/comment-page-1/#comment-2545754
Its false that the US was warmer in the 1930s and 1940s. Look at the data.
David Appell says:
January 2, 2018 at 11:05 PM
Its false that the US was warmer in the 1930s and 1940s. Look at the data.
Read up on the “Dust Bowl” some time.
But don’t look at the data?
“Its false that the US was warmer in the 1930s and 1940s. Look at the data.”
The metric that assesses intense heat waves in Summer(when they count) says otherwise about the 1930’s.
https://www.epa.gov/climate-indicators/climate-change-indicators-high-and-low-temperatures
If you rank the average USA48 temperatures by decade, then the 1930s is 3rd warmest and the 1940s is 6th warmest. (That’s not counting this decade yet, since it’s not over. But it’s looking to likely be the warmest.)
data:
http://www7.n_c_d_c.n_o_a_a.gov/CDO/CDODivisionalSelect.jsp
(Remove the spacers, as usual.)
Mike, the record heat waves during 1930s Summer are still in the official record.
https://tinyurl.com/y8mqd6xs
Spring, Autumn and Winter have become warmer, and the result is that annual temps are warmer now than then.
https://tinyurl.com/yd7ej963
The Us has a bigger one (Pres. Trump).
>>> The US has the best sampling of data of any significant land surface.
Says who? So Europe has no quality data back before 1900?
Steve,
You are cherry picking a location and data set. Why not focus on Cleveland?
Reminds me of the ‘publication’ I received in the mail several years ago, prominently showing the flat temperature over time in the Sargasso sea!
All 7 continents, individually, show significant warming, with similar history, a sharp rise beginning 1980. Easiest to see at Climate at a Glance site (NO*AA), but not unique.
Steve,
1. CO2 is said to be a well mixed gas and therefore operates in like manner on a global scale (subject to differences in humidity/water vapour feedback); and
Global CO2 does not influence daily, weekly, monthly or yearly weather, nor weather patterns for such periods in a specific region. We’re talking about US temps over a week or two.
2. The US is a large tract of Northern Hemisphere land
Smaller than other tracts that are much warmer than usual. Look at Russia, twice as large as the USA, and Asia, 5 times larger than the US:
http://pamola.um.maine.edu/wx_frames/gfs/ds/gfs_world-ced_t2anom_1-day.png
3. The US is a good representative sample of geography and topography, and is therefore a valid sub set of the behavoir of land masses in the Northern Hemisphere
Straight BS. What, because the US has all sorts of topography it can be a proxy for the whole NH temp? That’s not even logic.
4. The US has the best sampling of data of any significant land surface.
Making its temp record relatively sound… Wait, what?
You and many skeptics keep telling us that the US temp record is fraudulent. Does it suddenly become valid when it’s cold in the US? In the general debate, this opportunistic double standard on the US (or global) temp record by skeptics leaves me pretty cold when they appeal to it to make a point.
If the US is not showing warming (the US was warmest in the 1930s/1940s), one would needs a strong explanation as to why the US is an outlier and not behaving in the same manner as the Northern Hemisphere as a whole.
Along a single line of latitude it can be snowing, rainy, cloudy, sunny, relatively cold or relatively warm on any given day in the Winter. You don’t need oodles of data, just look at the world weather report on any news service on any given day. RV’s attempt to link US temps to the whole NH or globe looks pretty wishful to me.
barry says:
January 3, 2018 at 2:19 AM
Steve,
…You and many skeptics keep telling us that the US temp record is fraudulent.
I keep telling you that temperature records are constantly adjusted and the adjustments form a very distinctive pattern here’s the GISS Global Land-Ocean Temperature Index as it appeared in 2005:
http://web.archive.org/web/20050914112121/http://data.giss.nasa.gov/gistemp/tabledata/GLB.Ts+dSST.txt
and in 2015:
http://web.archive.org/web/20151015132529/http://data.giss.nasa.gov/gistemp/tabledata_v3/GLB.Ts+dSST.txt
And the comparison looks like this:
http://oi68.tinypic.com/wck4lc.jpg
That graph is a few years old and GISS changes the data every single time they put out a new release. Here’s a link to Steve McIntyre’s “Climate Audit” about that fact:
https://climateaudit.org/2008/04/06/rewriting-history-time-and-time-again/
But I expect that if I did that graph today it would look pretty much the same.
Steve,
I recommend not getting your data and analysis from an agenda-driven blog (agenda not good science)
Nate says:
January 3, 2018 at 6:56 AM
Steve,
I recommend not getting your data and analysis from an agenda-driven blog (agenda not good science)
The data I posted links to is directly from GISS
The graph was constructed directly from GISS data
It’s a fact that GISS changes the historical data every single month.
Steve McIntyre wrote a critique of those data changes.
Not everything that appears on agenda driven blogs is B.S.
Steve,
Their is no accountability, such as peer review, for what is written on a blog. None. Nada. It can be very misleading, cherry picked, or straight up lies.
Steve Case wrote:
“Its a fact that GISS changes the historical data every single month.”
So does UAH.
It’s called ‘doing good science.’
David Appell says:
January 3, 2018 at 11:25 AM
Steve Case wrote:
Its a fact that GISS changes the historical data every single month.
So does UAH.
Its called doing good science.
Out of 77 editions of the GISS Land-Ocean Temperature Index that I had at the time that I made that graph, 27 entries for just January 1880 were changed. Good science? I’m guessing that the value for every month is changed at least once a year. By 2005 all the changes that were made to entries after 1980 amounted to increases. One has to wonder why that is.
UAH also changes historical monthly data from time to time, even between revisions.
It’s called quality control.
Steve, historical data is continually being found and added to the GHCN data set, and the institutes do quality control regularly. There is 10 times as much data for the NH now than they had in the 1980s, for example, when most weather station data came from the US and Europe.
If you prefer older data sets, then you prefer less coverage of the globe.
Steve Case says:
“One has to wonder why that is.”
Yes. And one can read about why.
“Understanding Adjustments to Temperature Data,” BEST
http://berkeleyearth.org/understanding-adjustments-temperature-data/
“Thorough, not thoroughly fabricated: The truth about global temperature data: How thermometer and satellite data is adjusted and why it *must* be done,” Scott K Johnson, Ars Technica 1/21/16.
http://arstechnica.com/science/2016/01/thorough-not-thoroughly-fabricated-the-truth-about-global-temperature-data/
“Understanding Time of Observation Bias,” Zeke Hausfather, 2/22/15.
https://judithcurry.com/2015/02/22/understanding-time-of-observation-bias/
I know you think the US temp records are fraudulent, Steve, so why did you applaud this statement?
“4. The US has the best sampling of data of any significant land surface.”
This only makes it a good proxy for NH (according to richard verney) if the data are good, right?
If the US is not showing warming (the US was warmest in the 1930s/1940s), one would needs a strong explanation as to why the US is an outlier
Would that be the explanation skeptics give all the time? The US data is manipulated?
You don’t see the contradiction in referring to the temp records to make a positive point, such as above, and on a different day dismissing them as completely unreliable?
To me, this is a double standard, and it reeks.
barry says:
January 3, 2018 at 7:51 AM
I know you think the US temp records are fraudulent, Steve, so why did you applaud this statement?
I KNOW that historical global temperature data is re-written every single month. See my earlier post with the links to the Internet WayBack Machine. That includes US data. US data is the only place where I can easily get Minimum and Maximum data. As I’ve been pointing out, averages erase important aspects of the record. The US data available at NOAA’s Climate at a Glance shows us that it’s the colder months of the year that run up the average temperature. The IPCC tells us that the warming will be at night, in winter and in the higher latitudes. The implication is that summer afternoons and in the tropics not so much. But what are we shown as effects of climate change by government funded science?
https://climate.nasa.gov/system/content_pages/main_images/1320_effects-image.jpg
That showed up as #1 on a Google Image search on “Climate Change”
What we are getting from NASA and other government agencies is pure good old fashioned B.S. or to use today’s parlance, “Fake News”. Does B.S. and Fake News equate to Fraud? I haven’t used the term fraud in my critiques of what passes for government funded science. You can look up the definition of fraud.
Steve,
Dont like NASA? Dont like NO*AA? How bout BE*ST? JA*XA, Had*crut? Who do you like?
They all show similar warming. If your looking, as I suspect, for a lower trend in surface data, you’re out of luck.
Steve: But have you tried to understand WHY the data are adjusted every month?
What do you find wrong with the scientific reasons for doing the adjustments?
Nate says:
January 3, 2018 at 10:11 AM
Steve,
Dont like NASA? Dont like NO*AA? How bout BE*ST? JA*XA, Had*crut? Who do you like?
They all show similar warming. If your looking, as I suspect, for a lower trend in surface data, youre out of luck.
That’s right, I don’t have access to the raw data at least not in a form that I can easily deal with. So I have to look at what I know has been adjusted whether those adjustment were honest or not.
You can always look for work that uses the raw data if you haven’t the wherewithal to analyse it yourself.
BEST was one attempt, now derided my skeptics.
Here’s another done by skeptics.
https://noconsensus.wordpress.com/2010/03/24/thermal-hammer/
Whenever skeptics actually do the analysis with raw data, they find the same or higher mean trend than the institutes.
UAH and RSS also adjust the data, and the latest revision from both groups made significant changes to the trends.
Little known fact – NOAA’s latest revision of the SST data lowered the trend.
Other little-known fact – the raw global data for the whole period has a warmer trend than adjusted.
If they’re trying to make things hotter, they shoot themselves in the foot using adjusted data.
JMA use their own SST set for the last 20 years. GSOD is an alternative to GHCN, and gets a warmer result.
The data get tested and tested, and different groups do it differently, and use different data, and skeptics (rarely) do it with raw data, and still the overall results are very similar.
When someone takes the raw data and comes up with something very different, then that will be significant, but all attempts so far only corroborate the institutes.
People yell bias simply because the data are quality controlled. But they never demonstrate it comprehensively, just cherrypick a few stations that got warmer from adjustment – and always being blind to those that got cooler due to adjustments.
Been watching this closely for 10 years. This is what I see.
“Thats because the US is only 7% of the surface area of the NH.”
Not only that, the US did not even get cold until the last week of December.
You can use the link below to view daily, 7 day, 14 day and monthly averages for any date going back over a year.
http://www.cpc.ncep.noaa.gov/products/tanal/temp_analyses.php
1 week of bitter cold in a geographically small location of the Northern Hemisphere contributed a tiny fraction towards the monthly value.
……….And the cold came from high latitudes on the other side of the Northern Hemisphere(Siberia), where it was replaced by milder air which caused those areas to be MUCH warmer than average.
It was just an extreme reconfiguration of the heat distribution caused by an extreme weather pattern that caused air masses from Siberia to cross the Arctic, plunge southward thru Canada and continue momentum into the US.
The pattern has a La Nina type fingerprint………anomalous upper level ridge all the way north in Western North America, at times connecting to ridging in Siberia with an upper level trough downstream in Eastern North America. The flow between the two has had a strong north to south component.
The pattern is also in the process of breaking down. Next week, strong Pacific flow will start to blow zonally across the US, with milder Pacific origin air spreading across much of the country from west to east……as the northern stream retreats.
The new target for Arctic air masses may shift to the east and be in Northern Europe in the middle of January.
“an extreme reconfiguration of the heat distribution”
Nice description of whats going on , Mike. Hopefully people will take it into account.
Indeed, the eastern Arctic is warmer than the western one.
http://pics.tinypic.pl/i/00953/qxtrn73txm2q.png
It almost seems like the temperatures go up in spurts a little bit. An El Nino raises the plateau, followed by a few years of stasis, then another El Nino raises the plateau, followed by stasis, repeat.
I think this is some evidence, though no proof of course, that those who think the pause is over are correct, and that warming is resuming. That is, it is more plausible now than before that 2016 was not an anomaly, but perhaps a new baseline for future warming. Or to put it another way: maybe the skeptics were right for the last 15 years or so before 2016, but not right going forward.
The warming has been here all along, but noise can create short-term trends that, if you believe them (you shouldn’t) make it seem otherwise if you’re looking to confuse the situation.
davie imagines: “The warming has been here all along. ..”
The warming is hiding behind the La Nina and the Arctic blast, right davie?
The 13 month centered average is +.4*C since the bottoming out of the 1998 El Nino less than 19 years ago, or more than +.2*C per decade since then. How does that equate to a ‘pause’?
15-years seems like a long time to be noise in the context of trying to predict temperatures
Incoming decades.
Accidentally sent that. “In coming years”.
I wonder if there is some signal in there, something to be learned. But I am no climate expert.
It’s not. Since ENSOs can cause temporary swings in global temperature of 0.2-0.6 C, and AGW is 0.15-0.2 C/decade, a strong ENSO can temporarily obcure the AGW in 15 years.
https://static.skepticalscience.com/graphics/Escalator500.gif
DA links to the bizarre SkS website where their leaders like to Photoshop themselves as Nazi soldiers. Wow! Scraping the barrel there DA!
Cant dispute their graph, huh?
John, Dr. Spencer showed the “step change” mechanism pretty well here:
http://www.drroyspencer.com/2013/11/the-magical-mystery-climate-index-luis-salas-nails-it/
The AMO is about 40 years and +/- 0.2 C IRC.
Thanks Svante and David.
Seems like the kind of thing where, from a polemical point of view, if the stairsteps continue, then you’re a fool for focusing on them, and if it slows down or rounds off, then you’re a fool for thinking there was an enduring trend.
So unless 2018 drops like a rock, which I don’t think many scientists are expecting,
Bad idea to use an old iPhone to post! Too slow and unresponsive to touch so a second inadvertently partial/unedited post. But nuff said.
So, temperature rising. Quod erat demonstrandum.
Why winter is always to be cooler in Asia? Maybe tren is changing?
http://www.cpc.ncep.noaa.gov/products/stratosphere/strat_a_f/gif_files/gfs_z70_nh_f00.png
Sorry.
Maybe the trend is changing?
“Temperatures in Syracuse and Buffalo, New York, will struggle to get above zero during the daylight hours late this week and into the weekend. Highs will stay in the teens from Baltimore to New York City.
On Saturday, Boston will challenge its lowest maximum temperature ever recorded for the date, which stands at 7 from 1896.
Low temperature records, some dating back to the late 1800s and early 1900s, will be challenged in Baltimore; Harrisburg, Pittsburgh and Philadelphia, Pennsylvania; New York City, Buffalo and Syracuse, New York; Boston; Hartford, Connecticut; and Bangor and Portland, Maine, on Friday and/or Saturday night(s).”
Low it can cause heavy snowfall on the east coast.
https://earth.nullschool.net/#2018/01/04/0300Z/wind/isobaric/850hPa/overlay=total_cloud_water/orthographic=-88.47,41.34,1037
Pressure forecast.
http://www.lightningwizard.com/maps/North_America/gfs_cape_usa45.png
Sorry.
Ice Armageddon.
Going forward, if GT’s were to increase at 0.005 C/yr (year after year), they’d still shrilling, each and every year, that ‘this past year was a warmer, or warmer than all years in the historical record.’ Wouldn’t be very meaningful, however.
The UAH LT trend is increasing at 2.6 times your rate.
Do you understand the meaning of the word, “if?”
Why would you use a low guess when you could use the actual trend?
Bill Clinton had a difficult time with the meaning of another 2-letter word.
I think you used an small and incorrect trend just so you could rant at the people I’m sure you rant at all the time.
I posted a comment – ‘what if?’ – the only one ranting, is you.
I find that disturbing.
The item I am watching is overall oceanic surface temperatures now down to +.199c and trending lower.
“2016 will not be s warm as 2015, and 2017 will not be as warm as 2016 etc”
– Salvatore del Prete, 12/3/15
http://www.drroyspencer.com/2015/12/2015-will-be-the-3rd-warmest-year-in-the-satellite-record/#comment-203097
Salvatore, of all the people posting here you are the one that sees the forest from the trees. Happy 2018.
thanks
This is what matters
AGW is over.
“Your conclusions are in a word wrong, and that will be proven over the coming years, as the temperatures of earth will start a more significant decline (which started in year 2002 by the way)….”
– Salvatore del Prete, Reply to article: IC Joanna Haigh – Declining solar activity linked to recent warming, 10/8/2010
http://climaterealists.com/index.php?id=6428
Your conclusions are going nowhere along with global temperature deviations.
“Global cooling has started, and it will be here for sometime to come. All the factors that control the climate are now in, or going toward a colder phase.”
– Salvatore del Prete, December 31, 2010
http://www.drroyspencer.com/2010/12/dessler-and-spencer-debate-cloud-feedback/#comment-8257
I guess thats why we had the second warmest December in the UAH TLT series eh Salvatore? (after 2016, which was #1)
David reminds one of a inexpensive computer program.
AGW is over.
Huh? You said that your view would be proved in (NH) Summer if temps were at UAH zero line in 2018.
We have neither reached that time nor that level of coldness, so how come you have made this judgement?
Whats everybodys prediction for 2018 temperature anomaly? UAH lower global atmosphere?
Stevek
“Whats everybodys prediction for 2018 temperature anomaly? UAH lower global atmosphere?”
Probably lower than 2017, I suspect. La Nina Conditions are kicking in. Month or two before the TLT picks that up.
If La Nina conditions persist, then I’d bet that 2018 will be cooler than 2017, but still the warmest La Nina year on record.
No global warming since 2016!!!
TFN
I would be slightly surprise if it when up. Seems likely to be about the same, or slightly cooler.
Salvatore Del Prete thinks it will cool significantly, which seems to me about the same probability of it going up- or I would be slightly surprised.
Over next two years it seems likely to go down from 2017.
Or I expect a slight affect from the current solar minimum
AND expect to go lower from the spike in global temperature, but also like 1998 there could step [up] change. But generally speaking a continuation of “the pause” or no acceleration in warming nor do I think there ever was an acceleration in warming.
Or we should continua to recover from the Little Ice Age and there no reason or evidence that indicates anything else.
Of course some kind evidence may become evident.
I like your “or’s” because even the anti-human climate alarmists are finally forced to acknowledge that unpredictable fluctuations supersede the claimed/projected/predicted trends. So 2018 will be whatever or… whatever.
If we are still recovering from the LIA, why are recent temperatures exceeding its beginning by 0.8-1.0 C?
“If we are still recovering from the LIA, why are recent temperatures exceeding its beginning by 0.8-1.0 C?”
LIA was cold period or why it is called the Little Ice Age, and at least one coldest periods in last 8000 years.
During LIA there was advancing glaciers globally and long term periods of sea levels falling. It was a period of time in which there were ice fairs on the river Thamas. With violent weather and Central England Temperature was recording an average temperature below 9 C and recently it’s been about 10 C. Which btw happens to be about same average temperature of
all of Earth’s land temperature.
The world’s average land is 10 C and average ocean is 17 C.
Now how I look at world, it seems obvious that global average temperature is about 15 C because the ocean warms the earth’s surface air temperature.
Ocean average temperature is much warmer than average land surface air temperature- 17 vs 10 C.
And ocean area is 70% of total earth surface area.
And what is required to increase Earth’s average temperature is for the ocean temperature to increase.
Now the tropical ocean warms the rest of the world and tropical ocean is about 80% of the tropical region. And anyone with any understanding of climate knows this.
But some might imagine that the tropical ocean must increase in temperature in order to increase global temperature- and that is not necessarily true. What is more necessarily true is tropics has to absorb more energy from the sun.
What is true now, and for “forever” is the tropical ocean does absorb most of the sunlight which reaches Earth surface
and when include the entire ocean, 70% of surface and absorb obviously more than 70% of the sunlight.
Or the land surface absorb less- even if they were 50% of surface area would absorb less sunlight as compare to ocean surface of 50% and land area is only 30%, land absorbs less than 30% of the sunlight.
So obviously less than 30%, and question is how much less?
I would guess that land area absorbs about 10% of the total sunlight.
I mean ground absorbing energy of sunlight and ground warming the air above it. And ground absorbs less than air above it- but it’s total is about 10%. And dry land as in deserts absorbs the least sunlight. Or if Sahara desert was glassland the grassland would absorb more sunlight [and have very small effect of increasing average global temperatures, though having larger region affect upon temperature.
But Sahara desert as grassland absorbs less energy as compared to Sahara desert being replaced with an ocean.
And land surface can get higher air and surface temperature, but of course it’s radiating [losing] more energy into space.
Land surface has lower average temperature and is losing more energy into space, and not doing much “global warming”- warming the rest of the world. The ocean is warming the poles, not the land areas.
Or the smaller Mediterranean sea warms Europe
more the Sahara desert does. And Sahara desert isn’t warming Mediterranean sea, rather the sea is warming the Sahara.
You get higher temperatures [ground and air] with land, but the ocean area have higher average temperature and keep land areas warmer. Or without the ocean the average land temperature of 10 C would be much colder.
Central England temperature:
https://en.wikipedia.org/wiki/Central_England_temperature
2018 prediction:
Lower than 2017.
It will be warmer than any year prior to 1998.
Likely in the top 10 warmest years of the instrumental record, (ignoring uncertainty, just going by rank).
Wild guess – annual anomaly will be 0.21 for 2018.
Top 10 years by rank for UAH annual global temp anomaly:
2016: 0.51
1998: 0.48
2017: 0.38
2010: 0.34
2015: 0.27
2002: 0.22
2005: 0.20
2003: 0.19
2014: 0.18
2013: 0.13
(1998 is quite the anomaly)
Not taking any chances, are you?
Huh? I gave a prediction to 2 decimal places. I just know that it’s impossible to nail it down further than the rest of my post.
Weak La Nina now so 0.1 lower than 2017 for first half than ~ 2017 for second half.
So net .05 lower ~ .32
Don’t forget that the second half of 2016 was also a weak La Nina, which persisted through to early 2017.
http://origin.cpc.ncep.noaa.gov/products/analysis_monitoring/ensostuff/ONI_v5.php
at or below 30 year means
since records began . …
latest 30 year means 1980-2010
Yes, thanks.
Are you serious? Would love to wager some money if you are!
James
This was a reply to Salvatore
You must give Salvatore his due: he has studied the issue closely and has come to certain conclusions. He stands by them. I, for one, hope he is wrong about the results, believing warmer is better than colder.
David, and many others I’m sure, seem to believe based on what someone has told them to believe, and seem to think colder is better than warmer. Even more fantastical is their belief they can control the earth’s thermostat though mankind’s actions.
WhooHOO.
My guess is: I’ve no idea.
Salvatore has been saying the same old thing for many years — solar this, solar that, my criteria have been met, the ocean is colder today that it was yesterday, this is the decade of cooling, cooling starts next year.
And he’s been wrong all along.
Repeating the same incorrect prediction all the time is not indicative of someone who studies the science, it’s someone who never stops to think about why he was wrong and why he’s always been wrong. And it shows a heavy bias.
Wait until Salvatore discovers he can turn frowns upside down by claiming that his predictions are not predictions but projections and,… voila!
Laura: Do you understand why climate can be projected but not predicted?
It makes it easierto duck responsibility and ignore model prediction failures thus the chucken little theory can continue to be maintaind and the sheeple controlled…
You can fool some of the people….
I’m amazed at how many people are so sure adjustments are wrong but won’t take 10 minutes to understand why they’re done, in order to at least intelligently discuss or disprove them.
“Understanding Adjustments to Temperature Data,” BEST
http://berkeleyearth.org/understanding-adjustments-temperature-data/
It makes it easierto duck responsibility
Wrong answer. Do you even know the technical difference between a prediction and a projection? If not, have a guess.
Mr. Del Prete…you have lost all semblance of credibility. You seem to think all your countless fallacious predictions just vanish month by month. They dont. Anyone can go through your history here and see that your predictions have been entirely wrong.
Please spare us the nonsense….and spare yourself further embarrassment.
Reindeer are a thing of the past.
Non-sequiturs are not.
Ironic.
Glad you got the joke.
I have never changed my prediction it was always based on very low solar which is now finally being met in year 2017- going into year 2018.
In the meantime where is all the global warming? Temperatures are stuck in a slightly positive range which has not broke to the up side.
AND MOST IMPORTANT -global oceanic temperatures are trending lower which I said would occur.
Here’s the global warming:
http://www.drroyspencer.com/wp-content/uploads/UAH_LT_1979_thru_December_2017_v6.jpg
Some of us know better than to expect every month be a record high or that a few weeks of SSTs are indicative of a decadal trend. I wonder when you’re going to finally understand that.
DAVID we will see. It is crazy to go back and forth.
I think year 2018 is the year.
We have already seen — you’ve been wrong for years. Then you make the same prediction again, without analyzing how you went wrong.
For you, next year is always “the year.”
A broken clock is exactly right twice every 24 hours. Salvatore seems to be banking on that principle.
TFN
I think year 2018 is the year
I’m taking this as your last chance to be right. You’ve pushed the prediction forward for many years now when it hasn’t worked out. This has to be it.
Your prediction:
“I still say according to satellite data global temperatures by next summer will be at or below 30 year means. 1980-2010.”
If la Nina conditions persist and kick in strong in the coming months, we might just get to the 30-year zero line by summer if not before.
A big volcanic eruption very soon would help kick that along.
It’s possible. For me I don’t think hitting the baseline temporarily for a few months is meaningful, especially since you use the lowest temp record with the highest baseline (UAH), but I will hold you to this prediction, especially if it doesn’t pan out.
The current La Nina is already phasing out. There is a rapidly increasing subsurface warm cell of water extending to about 160 degrees West. The current cold blob is quite shallow and concentrated around 100 W. Expect about 4-6 months of lower temp forcing from La Nina, then it will start to turn back quite quickly. There is a very small possibility that the 2018 average will be anywhere near the 30 year baseline. Should be similar to 2017 depending on the timing of the El Nino/La Nina transition and the eventual strength of the next El Nino. Although as mentioned above, a historic volcanic eruption could produce a sizable (but temporary) dip.
For tons of great graphs, google
“Weekly ENSO Evolution, Status, and Prediction Presentation” for the weekly NOAA update.
JD
If solar stays low and year 2018 is not the year I will say this time I am wrong.
“If however Dr. Spencers data and Weatherbells data still show temperatures this high a year from now I will have to say I am wrong.”
– Salvatore Del Prete, 8/3/17.
http://www.drroyspencer.com/2017/08/uah-global-temperature-update-for-july-2017-0-28-deg-c/#comment-257573
“If solar stays low and year 2018 is not the year I will say this time I am wrong.”
Don’t.
Say it was a projection and keep on trucking.
It has always been a projection, based on a certain scenario:
http://www.drroyspencer.com/2017/10/uah-global-temperature-update-for-september-2017-0-54-deg-c/#comment-267005
Barry, right. And Salvatore is also projecting, not predicting — he has a set of assumptions of things that he thinks matter, and of things that he thinks don’t.
And he makes assumptions about the values of certain parameters.
Aren’t the alarmists just pointing to known weather phenom and calling it proof of agw?
No. Exactly the opposite. It is the so-called skeptics that repeatedly (and often knowingly) conflate weather phenomena with climate phenomena.
Riiiiight. And, all the breathless claims that the past season’s hurricanes were PROOF of AGW? Because, of course, we never had hurricanes before.
Scientist said they were, in part, a CONSEQUENCE of AGW, not a proof of it.
What, on this blog? I didn’t see much, if any, of that.
Salvatore
You are right where is the big blow out on the upside
DA
“Some of us know better than to expect every month be a record high or that a few weeks of SSTs are indicative of a decadal trend” really… you actually wrote that
Regards
HC
No hes not. Climate Science doesnt predict a blow out on the upside. Thats a straw man…and you know it.
you actually wrote that
Is there something wrong with it?
The problem is the record is skewed misleadingly higher because there are three large El Ninos since 1998 without corresponding offsetting La Ninas. The changes or trend remains small and completely compatible with a zero anthropogenic influence. I’m not saying it is zero, just that it’s compatible with zero.
The record is not skewed. Your interpretation of the data is skewed. Climate is what happens over long periods of time. No single-year data point is meaningful in and of itself….not high or low.
John is one of those AGW believers who will say what ever it takes to support AGW which never was and natural global warming is soon to end.
But you said warming ended in 2002.
1998-99: medium La Nina
1999-00: medium La Nina
2000-01: weak La Nina
2010-11: medium La Nina
2011-12: weak La Nina
2016-17: weak La Nina
http://ggweather.com/enso/oni.htm
Incorrect
https://youtu.be/GorWMLSPC6I
My post was a response to RW.
Homework for the deniers: recreate Dana’s video using the satellite data, instead of the NASA data he used.
What are you smoking, RW?
There are a number of la Ninas since 1998, including the 2.5 year strong la Nina immediately after the 1998 el Nino, 2 la Ninas in a row 2007-2009, and the strong la Nina of 2010/11, which extended into 2012.
http://origin.cpc.ncep.noaa.gov/products/analysis_monitoring/ensostuff/ONI_v5.php
Since, and including 1997, an El Nino year:
80 blue months
63 red months
Barry,
Look at the red line in the temperature record. Do you see the 3 big upward humps since 1997 that were El Ninos? Now, do you see 3 equally offsetting downward dips from La Ninas? No. Hence, this is skewing the record and/or trend higher than it really is as it relates to GHG warming, because El Ninos aren’t caused by the build up of GHGs in the atmosphere.
Sure, but they’re temporary. They’re not responsible for the trend. They have impact on the trend if they lie at the beginning or end of the trend analysis, making it cooler if you start with a large el Nino, and warmer if you end with one. Why do you think skeptic talked about the trend since 1998 for so many years – the year of the most powerful el Nino of the last 60 years? Then they suddenly got interested in el Ninos when we had the large one in 2016, saying (as they had been told for years) that el Ninos skew the trend if they lie near one end of it, especially if you analyse a short period.
The answer to this has always been – use the whole record. This lowers the impact of occasional high anomalies. Forget 1998.
Let’s do an analysis. Trend for the whole record with and without 2016 el Nino.
http://www.woodfortrees.org/plot/uah6/from:1979/mean:12/plot/uah6/from:1979/to:2016/mean:12/trend/plot/uah6/from:1979/to:2017/mean:12/trend/plot/uah6/from:1979/to:2018/mean:12/trend
Jan 1979 – Dec 2015: 0.11 C/decade
Jan 1979 – Dec 2016: 0.12 C/decade
Jan 1979 – present: 0.13 C/decade
Note: the trend is highest when you include non el Nino year 2017. The record is long enough that the 2016 el Nino doesn’t peak the trend. This is also the case since 1998, the period being just long enough that the 2016 el Nino doesn’t dominate too much – also that starting in 1998 gives us a ‘peak to peak’ period, sort of canceling each other out.
barry,
As usual, you’re missing my point. They have impacted the trend in a way that makes the overall trend higher than it would otherwise be *if* they were offset by correspondingly strong La Ninas (which they were not). I’m not saying there isn’t a warming trend over the record. There is.
I think you’ve missed my point.
If you start a trend with a massive el Nino, that will lower the overall trend than if there was not one. If you end on an el Nino that will make the trend higher than without.
If you have a number of them then it’s by no means clear what effect they have on the trend together.
There were more la Nina months than el Nino since 1998 (why are we talking about this period anyway?) The strongest La Ninas are never as powerful (re temp response) as the strongest el Ninos. But they tend to be longer. 1997/98 year-long el Nino was immediately followed by a la Nina more than twice as long, for example.
Get a long enough data set and they will have little impact no matter where they lie. That’s my point. Adding powerful 2016 el Nino year to the full satellite data record increased the long-term trend by 1 hundredth of a degree per decade. That’s a trivial difference.
So, don’t use short records. Use long records. Then el Ninos and la Ninas, wherever they lie, won’t matter much. For satellite data you need about 25-30 years of data minimum to get a robust trend. Shorter periods can be contaminated by el Nino influences. So avoid them. That’s the lesson here.
barry,
“If you start a trend with a massive el Nino, that will lower the overall trend than if there was not one. If you end on an el Nino that will make the trend higher than without.”
Yes, of course. This isn’t my point.
“The strongest La Ninas are never as powerful (re temp response) as the strongest el Ninos.”
Says who? It happens to be the case in this short record, yes, but that could just be coincidence.
“But they tend to be longer. 1997/98 year-long el Nino was immediately followed by a la Nina more than twice as long, for example.”
Yes, but a very weak one. It more or less just reverted back to the temperature it was before the big El Nino prior, i.e. didn’t dip significantly below it.
“Get a long enough data set and they will have little impact no matter where they lie. Thats my point. Adding powerful 2016 el Nino year to the full satellite data record increased the long-term trend by 1 hundredth of a degree per decade. Thats a trivial difference.”
Even if correct, that’s just one year. Elimate all of the significant El Nino and La Nina years and what impact does it have? A lot more, because the La Ninas were much weaker.
“So, dont use short records. Use long records. Then el Ninos and la Ninas, wherever they lie, wont matter much. For satellite data you need about 25-30 years of data minimum to get a robust trend. Shorter periods can be contaminated by el Nino influences. So avoid them. Thats the lesson here.”
I’m not using short records. Besides, trends matter little when the amount of the trend can be wiped out in only one or two months of consecutive cooling.
Says who? It happens to be the case in this short record, yes, but that could just be coincidence.
It is the case for the record since 1950, and also the case for the longer record extending to before 1900.
It could all be a coincidence, and la Ninas should *normally* be equally strong re temp response to to el Ninos, but we go with the data we have.
Yes, but a very weak one. It more or less just reverted back to the temperature it was before the big El Nino prior, i.e. didnt dip significantly below it.
I’m looking at the ENSO indices.
I’m trying to figure out what your point is. Do you imagine that the heat of each el Nino is cumulative to the surface temp record? I thought they were temporary blips, whose heat subsides into background, regardless of following la Ninas.
A 100 year linear trend of say 0.5 C/decade would remain 0.5 C/decade if you had el Ninos evenly interposed from beginning to end and no la Ninas. Only the mean temperature for the period would change.
But do you imagine that the heat released stays in the atmosphere unless a la Nina removes it?
If I take that for the moment as how you perceive it, then some simple calcs on the 97/98 event and following la Nina could go like this:
97/98 el Nino lasted 13 months with an average NINO surface anomaly of 1.67 C above normal. That accumulates to 21.7 C over the period.
The la Nina immediately following averaged at -1.01 C over 33 months, which yields -33.33 C for the period.
The weaker la Nina, being more persistent, has a stronger impact than the el Nino overall.
But I don’t know if this responds to what you are thinking because what you are saying is not clear to me.
Elimate all of the significant El Nino and La Nina years and what impact does it have? A lot more, because the La Ninas were much weaker.
This makes me think you DO imagine the temporary diversion have some cumulative effect. No, removing all el Ninos and la Ninas over a long-term period (decades) would have little impact on the trend, only on the mean temperature for the whole period.
Im not using short records.
You began this thread with 1998. That’s a short period relative to the variability in temperature data. But still long enough to provide a fairly robust trend against swings of a few months.
Besides, trends matter little when the amount of the trend can be wiped out in only one or two months of consecutive cooling.
I just showed you that using the whole satellite record, 2016 – a whopper el Nino – changed the overall trend by 1 hundredth of a degree.
You might be interested in this next bit:
The slight warming trend since 1998 in the UAH data is 0.07 C/decade.
Do you know how cold January would have to be to wipe out the slight warming trend since 1998 in the UAH data?
It would have to be -5.8 C. The coldest anomaly in the UAH record is -0.51 C (Aug 1985).
I’m not sure you understand the impact ENSO events have on long-term data. It’s tiny. You’ll only get trends wiped out in one or two months if you use short-term data and pick start/end dates that give you a really small trend to begin with.
You may have to explain in more detail what you are thinking. I don’t think I’m getting it. I’d also ask if you know how a trend is derived. You realize it’s not done by drawing a straight line with a ruler from one point to another?
I made some test data from 1979 to 2019, beginning at 0.1 C for the first year, and increasing by 0.1 C each year to 2019 (4.1 C).
That yields a trend of 1 C/decade.
Then I added a major el Nino every 10 years that raised the annual temp by 0.5 C and no la Ninas.
Eg:
1979 0.6 [el Nino]
1980 0.2
1981 0.3
1982 0.4…..
1987 0.9
1988 1.0
1989 1.6 [el nino]
1990 1.2
1991 1.3…..
1997 1.9
1998 2.0
1999 2.6 [el Nino]
2000 2.2
2001 2.3…..
and so on.
With large el Ninos added every 10 years the resulting trend is:
1.017 C/decade
With no la Ninas and only large el Ninos the difference in trend is 1 hundredth of a degree for the whole record.
What if we double the number of large el Ninos, so that they happen every 5 years instead of every 10? And no la Ninas at all.
Trend result: 1.015 C/decade.
It’s actually a lower trend than with 10-yearly el Ninos by a couple of thousandths of a degree. More el Ninos, lower trend – who’d a thunk?
This is without la Ninas at all and a sudden jump of 0.5 C every 5 years.
Temporary Temp swings only have a large impact on the trend if short-term data are used. That’s the lesson here. The other lesson is that timing matters, which is why you get a very slightly lower trend with more el Ninos, simply because of where they lie on the timeline.
Maybe visuals will do the trick.
I redid the linear regression, but with increments of 0.01 C per year, and 0.5 C Nino jumps every 10 years. This igves an overall trend of 0.1 C/decade, lower than UAH.
This is the result. Blue diamonds are the data, red squares the linear trend in yearly progression, with black line for the trend itself.
https://i.imgur.com/9kKm8nu.png
And NO la Ninas.
Here’s the result with Ninos every 5 years and NO la Ninas.
https://i.imgur.com/y7TWGAs.png
The trend lines with Ninos are virtually identical to the trend without. The only noticeable difference is that the mean for the whole period is higher.
Even with only el Ninos, the trend change is virtually nil from no el Ninos.
Major el Nino temp deviations don’t have much of an impact on the trend when using long-term data.
Bonus round: what would the change in trend be if we had only one major el Nino right at the end of the 41-year data set?
https://i.imgur.com/IEcwKGy.png
The trend?
0.117 C/decade
Less than 2 hundredths of a degree per decade change with a massive el Nino right at the end of the record and NO la Ninas.
Extra bonus round: How cold would a whole year at the end of the synthetic record have to be to get a negative trend?
https://i.imgur.com/7jGg3fq.png
Yep, you’d need an annual average anomaly of -2.5 C for a whole year to make the trend negative.
For a couple of months to wipe out the trend global temps would have to be much colder for this synthetic data.
For the actual UAH data, January 2018 would need to be -5.8 C to wipe out the slight warming trend from only 1998. Yes, the decimal point is in the correct place. To wipe out the trend for the whole record, Jan 2018 would have to be much colder than the depths of the last ice age. About -38 C.
https://i.imgur.com/6IZUayn.png
Lesson: the more data you have, the less impact occasional deviations have.
barry,
You apparently don’t understand the difference between the long term trend itself and the amount of the trend. The long term trend itself cannot be wiped out by a month or two of cooling, but the amount of the trend can be.
If the trend were 3-4C instead of about 0.3-0.4C, where monthly swings were still only a few tenths of a degree, then the trend is clear and significant. When monthly or consecutive monthly swings in temperature are not infrequently as large or larger than the entire trend itself, it’s not very significant since a month or two of change can easily get you back to the same level as the baseline temperature of the trend in one direction or another.
barry,
“But do you imagine that the heat released stays in the atmosphere unless a la Nina removes it?”
And no, this is not what I think at all.
barry,
You put way too much weight into so-called trend analysis. I fully agree there is a warming trend in the satellite record of about 0.4C (or whatever it actually is). I fully agree that there is a warming trend in the last 100+ years of about 0.5-1.0C.
The bottom line is when your start points and end points significantly impact the result of any trend analysis, it’s not a robust result, especially, as I’ve said, when the decades long trends are so tiny that monthly changes are not infrequently as large as the entire trend amounts themselves. Not to mention also that the margin of error of the data is not much less than the entire trend amount either.
Any trend in either direction over any given period will only be known in hindsight. There is nothing in any trend analysis, cooling or warming, over any period of time, that indicates more cooling or more warming is to come in the future.
RW, the land trends are 2 degrees F in 40 y. Not insignificant.
Monthly var in troposphere are double those at surface.
The bottom line is when your start points and end points significantly impact the result of any trend analysis
That’s simply not true with long-term data as I’ve shown above.
its not a robust result, especially, as Ive said, when the decades long trends are so tiny that monthly changes are not infrequently as large as the entire trend amounts themselves
The monthly swing could be 10 times larger than the trend and still not make much of an impact if the period is long enough.
I’ve done the regressions. With long-term data, even small trends are not going to be much affected by ENSO events at the beginning or end. I demonstrated that above.
Does it not impact you that to get a flat trend for the whole satellite period from this month’s anomaly, that anomaly would have to be -38 C??
That’s with a trend of 0.13 C per decade over 40 years. That’s small, isn’t it?
The strongest la Nina we’ve ever seen would barely make a dent on the long-term trend.
What you are concerned about does matter when the period is very short. A trend of 0.13 C/decade over only 2 years can easily be wiped out by a weak la Nina over a few months.
That’s why linear regression is superior to, say, drawing a line between two selected data points. Trend analysis makes an estimate using all the data. Say I chose Jan 1979 and Dec 2017 as my start and end points. The ‘ruler’ method is derived from 2 bits of information, and the result only compares those 2. Linear regression uses 468 bits of information to derive a trend. A temp swing at the end of a dataset has to compete with the combined weight of 468 data points. Short-term deviations just don’t have much of an impact with long-term data.
To repeat, the 2016 very, very strong el Nino increased the long-term trend by 1 hundredth of a degree per decade.
Here it is in pictures: figures supplied.
https://i.imgur.com/FyZJJ8b.png
https://i.imgur.com/tP7cOXU.png
If you think a big temp swing changes things by much, what do you think of this result?
barry,
Dude, you’re not hearing and understanding what I’m saying. You keep posting stuff in response that I generally don’t even dispute or disagree with.
I’m going to let the readers decide. I think my comments speak for the themselves and points I made are logical and clear.
barry,
I’m not saying there have been no La Ninas, as there have been. Only that they weren’t nearly as strong as the 3 El Ninos.
RW:
There’s another explanation.
Global temperatures are increasing by 0.13 degrees C per decade, and that makes any El Nino year look much stronger due to the underlying, ongoing increase, while La Nina years look much weaker due to the underlying, ongoing increase.
Look at the data. El Nino years are getting hotter. La Nina years are getting hotter. Neutral years are getting hotter.
https://www.youtube.com/watch?v=GorWMLSPC6I&feature=youtu.be
RW
You commented:
“Look at the red line in the temperature record. Do you see the 3 big upward humps since 1997 that were El Ninos? Now, do you see 3 equally offsetting downward dips from La Ninas? No.”
As I mentioned, since 1997, blue months have significantly outnumbered red months (80/63). OTOH, the el ninos have been more intense, which likely explains the temperature spikes we see with the latter but not the former.
My guess is it ends up about a wash WRT global anomalies.
You can’t just count colors, because the months have different values.
Over the past 10 years, the average ONI is 0.00. The 15-year average is -0.03. 20 years, -0.13. That’s very close to neutral (and just slightly La Nina-ish).
data:
http://ggweather.com/enso/oni.htm
David
Your comprehension/reasoning skills suck.
If I only counted colors, why would I claim the El Ninos were more intense? Why would I guess it ends up a wash?
BTW, I was trying to expain why we don’t see, “3 equally offsetting downward dips from La Ninas”.
Pointing out the average ONI doesn’t do it.
UAH is not ‘global temperatures’ it is troposphere temperatures. Global temperature has been rising faster than the troposphere temperature.
Snape, you wrote “blue months have significantly outnumbered red months (80/63).” I pointed out that that does indicate much.
The ONI is “the running 3-month mean SST anomaly for the Nio 3.4 region.” Temperatures. And it’s averaged very close to zero for the last 20 years; in fact, slightly negative (La Nina-ish).
So you can’t attribute the warming of the last 20 years to El Ninos. A better question is, why are El Nino years getting warmer (surface and LT), why are La Nina years getting warmer, and why are neutral years getting warmer? The heat doesn’t just pop out of nothing.
David
“Snape, you wrote blue months have significantly outnumbered red months (80/63). I pointed out that that does indicate much.”
Since the average ONI ends up a wash, even though red months are much fewer, this indicates red months have a greater departure from normal compared to the blue (this can be verified by examining the individual values).
Fewer, but stronger, the el nino months create a more noticeable jump when looking at the TLT record.
Those more noticeable spikes tend to mislead skeptics into thinking El ninos have been dominant, even though, as you point out, that’s not true.
“Without corresponding offsetting La Ninas”
Huh? What about the strong ones in 99-2000, in 2008, in 11-12?
Yes I am correct the AGW models have sucked in their predictions.
Wrong again.
https://www.climate-lab-book.ac.uk/files/2014/01/fig-nearterm_all_UPDATE_2017-panela-1-1024×525.png
https://www.tropicaltidbits.com/analysis/ocean/global.png
this is what matters and this was around +.35c in summer
What kind of car did I win?
Salvatore, don’t you have any sense of shame? You’re as bad as GR.
2017: warmest non-El Nino year in UAH’s records.
39 years since Jan 1979, @0.13 degrees C per decade.
That’s 0.51 degrees Celcius of warming so far, and no indication the trend will change, much like Salvatore’s predictions won’t change.
2017 was the hottest non-El Nino year on record.
1972 had similar solar irradiance levels and neutral ENSO conditions to 2017. Average temp difference? 0.9 degrees. That’s using NASA data, which is less than 0.05 degrees C different from the satellite data for long term warming trend. Different measurements, very similar results.
https://youtu.be/GorWMLSPC6I
Joel
Yesterday Gordon showed this graph of the Little Ice Age:
https://en.m.wikipedia.org/wiki/File:2000_Year_Temperature_Comparison.png
The difference between the Medieval Warm Period maximum and LIA minimum? ~0.9 C
That took 600 years!
According to the graph, the rate of temperature change between MWP and LIA was about 0.015 per decade.
The current rate is approximately 10 times faster.
I don’t know how anyone can say when the LIA ended. Some people say it’s still ending. Always seems like pure assertion to me. And it is, because they never explain why they think this. They just seem to like it as an explanation for recent warming.
I would say that since the LIA was caused by a quick string of volcanic eruptions in 1275-1300 and an associated ice-albedo feedback, the LIA ended when temperatures returned to the pre-LIA level. That would put it sometime around 1900. We’ve had 1 C of surface warming since.
Miller, G. H., et al. (2012), Abrupt onset of the Little Ice Age triggered by volcanism and sustained by sea-ice/ocean feedbacks, Geophys. Res. Lett., 39, L02708, doi:10.1029/2011GL050168.
” barry says:
January 2, 2018 at 10:03 PM
I dont know how anyone can say when the LIA ended. Some people say its still ending. Always seems like pure assertion to me. And it is, because they never explain why they think this. They just seem to like it as an explanation for recent warming.”
It’s commonly agreed LIA ended somewhere around 1850.
So one can say it ended at 1850 [because it’s commonly agreed- but it’s necessarily true, but it’s “how” you can say it.]
Now it’s said it’s 1850 because it’s was around time period where global glaciers stopped advancing and started retreating
as an average- because individual glaciers can advance or retreat mostly due to local conditions. Or currently there are some glaciers advancing but most still continue retreat or yearly advancing and retreating and no measurable direction other say a slight retreat over say, 10 years or more.
Another broad measuring stick is rising sea level. Of course rising sea levels are hard to measure for many reasons and modern monitoring, you need a few year to determine the small increase is sea level rise. Or can’t really say how sea level change in 2017- but say how much say 2010 to 2016 changed in terms global sea level. So wiki:
https://en.wikipedia.org/wiki/Sea_level_rise#/media/File:Trends_in_global_average_absolute_sea_level,_1880-2013.png
from:
https://en.wikipedia.org/wiki/Sea_level_rise
Or why does wiki only go to 2014. It not because no cares and they excessive lazy. But rather because there is fair amount confidence- though maybe a bit lazy.
Now in terms ending glacial periods, one has lot sea rise rise occurring- making easier to say when it ended.
Also the air temperature spike quite dramatic. Plus it’s such long time ago, that 10 year period is a small dot on graph. Nor can precise in terms less than a decade of time be possible.
Now, I generally avoid citing realclimate.org but did provided a guess about last 2000 years of sea level rise:
http://www.realclimate.org/index.php/archives/2011/06/2000-years-of-sea-level/
And a commenter says:
–Kevin McKinney says:
20 Jun 2011 at 8:53 PM
Very interesting indeed. On the graph, the increase in SLR appears to set in somewhere around 1800, which seems a bit early for big anthropogenic effectsthough its a bit hard to be definite due to the scale and image size. Can you say more about that? (Its a question the usual suspects would raise, to be sure.)–
And:
[Response: Actually, the sea level reconstruction (blue curve) doesnt show an increase until later (roughly 1900). ….]
If Kevin “right” one could argue LIA ended in 1800 and if “mike” is correct one could say about 1900 as it relates sea level rise.
http://www.cnn.com/2016/02/23/world/climate-change-sea-levels-study/index.html
Updated 6:17 AM ET, Thu February 25, 2016
“The authors said it was the first estimate, to their knowledge, of global sea level change over the past 3,000 years based on a “statistical synthesis of a global database of regional sea level reconstructions.”
And:
The study found that that the global sea level fell by
“a statistically robust” 8 centimeters between 1000 and 1400, a period in which the global temperatures declined by about 0.2C, he wrote.”
In the graph provided [which began about 1750] it recovers that period
“high” level at 1750 [which is sloping down and then goes up] until about 1950.
But sea level appears to “take off” starting around 1920
So search: global sea level rise in 3000 years
Ah, the paper:
http://www.pnas.org/content/113/11/E1434.full
Its commonly agreed LIA ended somewhere around 1850.
A lot of skeptics say we continued to ‘recover’ from it throughout the 20th century and that the ‘recovery’is ongoing.
gbaikie says:
“The study found that that the global sea level fell by
‘a statistically robust 8 centimeters between 1000 and 1400, a period in which the global temperatures declined by about 0.2C, he wrote.'”
That’s worrisome. That would mean our 1 C of warming will create 40 cm of SLR, and 2 C 80 cm. That’s about what models project.
Sea level takes a long time to rise. Ours will be rising for thousands of years. In the distant past, sea level has changed by 10-20 meters for every 1 C of global temperature change.
–barry says:
January 4, 2018 at 6:28 AM
Its commonly agreed LIA ended somewhere around 1850.
A lot of skeptics say we continued to recover from it throughout the 20th century and that the recoveryis ongoing.–
I am not aware of “lot of skeptics” saying this.
I would say a lot skeptics say LIA was a cold/cooler period and if measuring a trend from cooler “dip” ten one has what appears to be “more warming”. Just though cherry picking a trend starting from low or high valley or peak of temperature.
AND there the response to the unlikely claim that LIA wasn’t really a cooler period in terms of global temperature- to which I would say if glacier globally are advancing and sea levels falling, it’s global climate. And selected tree acting as thermometers is not adequate evidence to disprove a wealth of other evidence.
Anyhow, I would characterize the present time as recovering from LIA though I think it’s possible, evidence may be found which could prove otherwise. It’s possible that perhaps LIA
had ended in 1950.
One could say the ice age didn’t occur when newspapers were saying the ice age was coming, and it didn’t, “marked” the end. Or if had occurred as some predicted, then we basically never left the LIA.
Or the warming started when it failed to cool.
Basically, though I don’t like agreeing with IPCC, as general practice, I would be effectively agreeing with them.
Or they say that this time when CO2 effects occurred or had measurable effect. Or I am agreeing with idiots that think only CO2 level effect global temperature, in terms of when warming started.
But as said it seems to me we are stilling recovering from LIA, but it’s possible that more data could indicate otherwise.
Though it’s obvious that cooling stopped, or warming started well before 1900, but sea levels and glacier had not recovered by this time. And also think warming has to start
during the end of glacial period, before it’s manifested as increasing global temperature. Or melting ice and rising sea levels. Warming starts or cooling ends [same meaning, perhaps, though could be different].
Or as I have long stated, I don’t think we know enough about what causes cooling, and due to this lack of understanding
we don’t know jack about climate climate.
It’s pseudoscience, it’s cargo cult religion.
And one should be skeptical of it.
And even if was not pseudoscience, one should be skeptical of it.
Results are in for last month’s sweep:
UAH December anomaly: 0.41 C
Bets:
MikeR – 0.48
Snape – 0.43
Svante – 0.34
Des – 0.3s
g*e*r*a*n – 0.29
barry – 0.24
PhilJ – 0.19
Snape wins the car. That was his second guess. His first guess was bang on. My first guess (0.21) was bang off. PhilJ, g*e*r*a*n and I are eating goat steak.
Amendment: it was Svante who changed his bet to 0.43 (from 0.34), not Snape. Snape was bang on. Svante was close.
Amending the pool:
MikeR 0.48
Svante – 0.43
Snape 0.41
Des 0.3s
g*e*r*a*n 0.29
barry 0.24
PhilJ 0.19
Gah – wordpress is annoying. Here’s cleaner version:
MikeR – 0.48
Snape – 0.43
Svante – 0.34
Des – 0.3s
g*e*r*a*n – 0.29
barry – 0.24
PhilJ – 0.19
+.25c for jan anamoly
You switched my goats back again barry, and here’s Salvatore’s number for December:
http://www.drroyspencer.com/2017/12/uah-global-temperature-update-for-november-20170-36-deg-c/#comment-276068
Ah, your next edit below got my goats right again.
One of those days when you really wish you had an edit function…
MikeR – 0.48
Svante – 0.43
Snape – 0.41
Des – 0.3s
g*e*r*a*n – 0.29
barry – 0.24
PhilJ – 0.19
Well done to Snape!
The oracle is upset and looking for a new scapegoat with regard to her last prediction. She is blaming a goat entrail malfunction.
Barry , due to the latest truly offal result the oracle really needs a new goat. If you haven’t already distributed all your goats to the lucky losers could you please send one urgently to P.O. Box 12018 Delphi Greece.
Do not attempt to send one by email via
https://yougoatmail.com
as she stopped answering emails a long time ago.
MikeR
I was tired of guessing wrong. Used dark magic to see the December anomaly. Better than an oracle.
https://upload.wikimedia.org/wikipedia/en/thumb/b/b9/Ootp076.jpg/220px-Ootp076.jpg
Yes Snape. A lot of people predicted that she would turn out be a dud.
I might have to sack her and I do not have a good foreboding with regards to her football tips now. As I appear to be her last customer, unless she lifts her game, she may have to join the queue of jobless seers and oracles at the local unemployment office.
The goat is behind door 1, Mike. Probably.
Is it Schrodinger’s goat? If I find it I will return it to him dead or alive.
Hopefully dead after the Oracle has done with it.
I wouldn’t feel too put out. If I’d noticed the bet before moving on to other stuff last month, I’d almost certainly have plumped for a few-tenths reduction as well. Despite what I have said in the past about ENSO not being tied to a clear alternation, we generally EXPECT the monthly anomaly to be going down after a strong positive.
C’est la vie, I say, it goes to show you never can tell.
Kicking off the sweep for January’s UAH global temperature anomaly, I’m going with 0.24 C again.
Allow me to try: +0.32
Can I play? I will go with +0.34.
JD
Salvatore goes for 0.25 C.
http://www.drroyspencer.com/2018/01/uah-global-temperature-update-for-december-2017-0-41-deg-c/#comment-278842
Here are the UAH global annual anomalies for all years from 1998 inclusive:
1998: 0.48
1999: -0.02
2000: -0.02
2001: 0.12
2002: 0.22
2003: 0.19
2004: 0.08
2005: 0.20
2006: 0.11
2007: 0.16
2008: -0.10
2009: 0.10
2010: 0.34
2011: 0.02
2012: 0.06
2013: 0.13
2014: 0.18
2015: 0.27
2016: 0.51
2017: 0.38
And here they are by rank warmest to coolest:
2016: 0.51
1998: 0.48
2017: 0.38
2010: 0.34
2015: 0.27
2002: 0.22
2005: 0.20
2003: 0.19
2014: 0.18
2013: 0.13
2007: 0.16
2001: 0.12
2006: 0.11
2009: 0.10
2004: 0.08
2012: 0.06
2011: 0.02
1999: -0.02
2000: -0.02
2008: -0.10
Tsk, swap 2017 and 2016 around. Looks like someone needs more sleep.
2007 and 2013. Swap. My brain is officially fried.
Here is the really real warmest to coolest rank from 1998:
2016: 0.51
1998: 0.48
2017: 0.38
2010: 0.34
2015: 0.27
2002: 0.22
2005: 0.20
2003: 0.19
2014: 0.18
2007: 0.16
2013: 0.13
2001: 0.12
2006: 0.11
2009: 0.10
2004: 0.08
2012: 0.06
2011: 0.02
1999: -0.02
2000: -0.02
2008: -0.10
Note for the sleep-deprived: Vim one-liner :%!sort -k2nr
Greek!
Snowfall in New Orleans and freezing rain in Florida. This is the beginning of the low on the east coast.
https://www.facebook.com/719393721599910/photos/a.720324898173459.1073741829.719393721599910/756816344524314/?type=3&theater
Whats the significance of being 1st,2nd or 3rd in a series of 39?
39 years of measurements of pseudo global temperatures is almost meaningless to anyone but a fervent advocate of doomsday.
Now Bryan, even if they weren’t pseudo, why 39 years is forever in the imagination of those who live lives based on the fervent belief that history started when they were born. The curious part is these same people believe they can predict the future and control the climate using only human sacrifice (as long as they are not the sacrificial items)
Now enjoy the blog and quit whining. There is a lot to learn about the science of earth and, indirectly, how much we don’t know.
Lewis
You’re saying 39 years of data is too short a period to draw a conclusion?
I saw skeptics claim AGW is a hoax based on a 2 week cold snap.
Snape says, January 3, 2018 at 5:19 AM:
“AGW” isn’t a hoax. It’s really nothing more than a loose, speculative idea that somehow ended up at the top of the agenda of the green and politically correct – in effect, pseudoscience gone mainstream …
It is at least, as of 2017, still a nonexistent effect, as far as the observational data goes:
https://okulaer.files.wordpress.com/2017/08/erbsceres-vs-uah1.png
https://okulaer.files.wordpress.com/2017/12/olr-vs-tlt-siste2.png
Kristian
It’s good to see an intelligent argument! The charts definitely seem at odds with the theory behind the GHE.
I wonder if someone like Dr. Spencer would have an explanation?
Context for these graphs?
Nate,
It has been given on multiple occasions. And not only that, if you actually understand the concept of an “enhanced GHE” as a driver of GW through a gradual raising of Earth’s “effective radiating level”, then you have “the context” of those graphs already …
http://www.climatetheory.net/wp-content/uploads/2012/05/greenhouse-effect-held-soden-2000.png
Kristian,
As you should know, science papers show graphs, and offer an interpretation.
Dont’ expect everyone has total recall of your previous posts.
Kristian
Remember this? It’s the only thing I’ve found that addresses your chart.
http://www.washington.edu/news/2014/11/10/global-warming-not-just-a-blanket-in-the-long-run-its-more-like-tanning-oil/
Nate says, January 4, 2018 at 2:27 PM:
IOW, you don’t understand how an “enhanced GHE” is supposed to cause global warming …
Like I said, if you understood the proposed mechanism, you’d know what signal to look for.
How would you go about arguing that “AGW” is real, if you don’t know how it’s supposed to work in the first place …!?
Kristian,
this is the OLR response in fig. 1D in Snape’s paper.
https://tinyurl.com/y8xfz32p
You noted before that the paper says:
“Observational constraints also suggest an OLR recovery timescale on the order of decades. However, the current global energy imbalance seems to be dominated by reduced OLR because of the substantial SW forcing associated with anthropogenic tropospheric aerosols”.
So if you say the OLR is increasing then the “seems” is wrong and feedbacks have taken over?
Kristian,
I can guess what you are trying to convey with these graphs, the two don’t agree with each other. How large an effect should I expect to see and are you showing a NULL result with stat significance? I cannot tell.
why 39 years is forever in the imagination of those who live lives based on the fervent belief that history started when they were born
1) Skeptics tend to eschew the surface records and prefer the satellite records. Which starts in 1979 – 39 years. Skeptics are largely responsible for this focus on 39 years.
2) This blog is based on the UAH record – 39 years.
3) I look forward to you championing the instrumental global surface records extending back to the mid/late 1800s. Not sure if you’ll reject proxy data for times before….
Good Point Bryan, 39 years is a short time compared to the 100,000 year climate cycle (Milankovitch cycles). Even less than the 2% that many complain when some give USA conditions as representative of the world. However, understanding current conditions may help us prepare for near future climate changes. Based on the reconstructed temperature/sea level data, we should expect a need to adjust farming practices and/or move inland in the future to adapt, we just do not know how far into it.
From a policy standpoint, I would prefer to invest in the understanding of atmospheric dynamics to see if humans can effectively counter the 100,000 year cycles. In my opinion the low end of the cycle would be more detrimental than the high end. We have the current technology to live/produce food at sea, but very difficult to farm a glacier.
Good thing we don’t have to worry about the low end for 20 thousand years, eh?
I agree and we certainly do not want to have it come sooner.
I think we should have left that decision to generations of the future. It should be their decision, not ours.
As far as the CO2 debate, the data I have seen so far would suggest it has a small impact on temperature but is, in my opinion, the wrong focus for slowing down the climate change phenomenon. There are some who suggest extra CO2 helps in Ag production though. There are others that say slowing our contribution of CO2 will help delay the maximum or that the maximum will be higher if we don’t. I just have not seen the evidence of that or heard good arguments on this blog supporting that position.
However, I believe we can all agree that we can shut down every factory, disable every vehicle and euthanize every human and still not stop climate change. So would it not be prudent to invest in ways to figure out an alternative way to control global temperature? And more importantly, are we smart enough to know what that ideal temperature is for the planet? And finally, does an average global temperature even make sense?
However, I believe we can all agree that we can shut down every factory, disable every vehicle and euthanize every human and still not stop climate change.
Is anyone suggesting we do this?
So would it not be prudent to invest in ways to figure out an alternative way to control global temperature?
I expect we’d have to figure out various ways and see what works. Who shall fund this R&D?
And more importantly, are we smart enough to know what that ideal temperature is for the planet?
How about the temperature at which human life has flourished the most? Say, the 19th and 20th centuries? Or the range within the current interglacial?
I’d say that we have flourished most when global climate change was small and slow.
And finally, does an average global temperature even make sense?
Sure, you can average anything that has more than one data point. If you want to figure out if the whole globe is getting warmer or colder, how else would you go about it? Sea level? That would be an average, too. Amount of global ice? Also an average.
If we’re going to test ways of controlling global temperature, we’d need some way of monitoring global temperature, eh?
Yes, my point exactly. No one is suggesting something as draconian as killing all the humans. But the suggestion that reducing CO2 without definitive proof that it will slow down warming or is in fact not beneficial seems short-sighted given that the draconian approach won’t stop climate change.
I would prefer to use our resources to reduce poverty/hunger and better understand both the climate cycles and how we can influence it. I would suggest diverting some but not all funding that is going to CO2 impact analysis to a more comprehensive research in climate dynamics. I do not think we need to expand funding just use it more wisely. Perhaps a bit more to UAH, that’s a plug for Roy.
My point on average temperature is that you can have the same average with very different results. USA having ideal temperatures vs. Europe freezing and Australia boiling, is that good? What if we have higher/lower extremes across the board? What if 2C degrees warmer results in ending hunger? lower heating cost?
What criteria would you consider “definitive proof?”
David says “What criteria would you consider definitive proof?”
Great question David. It is like pornography, you know it when you see it. I am not a climate scientist, my expertise is in the analysis of data for various governmental studies I do. But I am interested in the climate debate and would defer to the “experts” on this blog for the actual criteria needed.
Kristen and Salvatore have been persuasive in their views. I find them interesting. I also like the contributions from Bindiddon, Barry and yourself. And Ren, though you are right many times off topic, I still appreciate Ren’s contributions. Others not mentioned I like as well just too many to list. But what I don’t like is when conversations degrade into name calling and the such, I typically bypass those discussions.
I am also uncomfortable when some compare a 7,000 year trend with a 30 year trend. As does saying maximum/minimum records ratio is 10 to 1, even though the majority of those records are for sites started post 1950 (a cold period in are recent history).
I simply have not been convinced that CO2 is a problem and may in fact have been beneficial to us.
bilybob says:
David says What criteria would you consider definitive proof?
“It is like pornography, you know it when you see it.”
Not even close to being good enough.
What set of measurements and data would convince you that AGW exists? Or that it doesn’t?
Why does every climate scientist on the planet accept that AGW is real? What have they said/written?
AGW? I thought we were talking about CO2. Lets keep the discussion focused. Why have CO2 levels of 300 PPM or less produced global temperatures in the past that are much higher than today? Why has CO2 levels significantly higher produced cooler temperatures. The short answer is that the CO2/Temperature relationship is spurious. However, there is a fairly established Temperature/CO2 relationship as well as a Human Activity/CO2 relationship. CO2 simply has minimal effect on raising temperatures, and may in fact lower temperatures by increasing plant biomass.
As far as every climate scientist believing in AGW, you ever read the “Madness of Crowds”. There is always a few who will come to their senses and break away from the herd. Keep an eye on the Roy and Salvatore types. They are winning the argument with me. In any case, I have to admit, I never did see a survey conducted on individuals with expertise in the atmospheric sciences that asked “do you think AGW is a problem”. Do you have a link to the survey? Wow, 100% said yes.
billybob says:
“Why have CO2 levels of 300 PPM or less produced global temperatures in the past that are much higher than today?”
When was that?
The only candidate I know of is the Eemian. But
“The Eemian climate is believed to have been about as stable as that of the Holocene. Changes in the Earth’s orbital parameters from today (greater obliquity and eccentricity, and perihelion), known as Milankovitch cycles, probably led to greater seasonal temperature variations in the Northern Hemisphere, although global annual mean temperatures were probably similar to those of the Holocene.”
https://en.wikipedia.org/wiki/Eemian#Global_temperatures
By the way, CO2 isn’t the ONLY FACTOR that determines climate and climate change.
This is a common mistake of those who reject AGW.
billybob says:
“Why has CO2 levels significantly higher produced cooler temperatures. The short answer is that the CO2/Temperature relationship is spurious.”
Wrong — the answer is that the Sun was weaker in the distant past.
The Sun’s luminosity is increasing by about 1% every 110 Myrs. So 450 Myrs ago, when the Earth was 12-14 C warmer, it was 4% less luminous. That’s a huge amount — 55 W/m2 at the top of the atmosphere. Today the Sun’s typical luminosity variation is 1-2 W/m2 over a solar cycle.
“As far as every climate scientist believing in AGW, you ever read the Madness of Crowds. There is always a few who will come to their senses and break away from the herd.”
That’s a lame, vapid argument.
By that reasoning, the Earth is flat and scientists have it all wrong.
AGW? You keep bringing up AGW. My comments are directed at CO2.
As far as those who reject AGW making a mistake if they only looking at CO2, I agree 100%.
I will take a look at the document link you sent on pollution externality costs, it over 400 pages so it may be awhile. Appreciate the link.
As far as the Madness of Crowds being a lame vapid argument. It is interesting that you mentioned a Flat Earth, I always believed that the masses believed the Earth was flat, after all the science was settled or at least the Church ordained it, but there was a few who rejected the Church. Eventually, the others saw the light.
It may be a while before I will be able to respond again, ciao for now.
I bring up AGW because CO2 causes it.
Thing is, we get a different message from the researchers, and uncertainty cuts both ways.
This is how I see it. We are and have been conducting a vast, uncontrolled geophysical experiment with the only atmosphere we have. Don’t know if the consequences will be minor or major. Could be beneficial, little, or deleterious.
If it was like insuring a house, no problem. Burns to the ground? Build another.
We’re inside the test tube, we can’t escape. Seems prudent to me to slow the experiment way down until we get a better fix on it. This can be done without starving ourselves, and it can be done while also fixing other problems. Business has better vision on this than some governments.
I would have to agree with you there. Slowing down seems to be a more prudent approach. We certainly do not want to go “all in” on a solution without a comprehensive understanding of the consequences. We also need not be blind to any impacts we are currently doing.
The good news is that humans are a very resourceful bunch, we are a very adaptable species. And we do learn from our mistakes. There was a time where we would dump raw sewerage into a river, but now we treat it. The other good news is the environment is very resilient. It is a dynamic entity that keeps us on our toes.
Now should we abandon the clean air act? Should we stop looking at being more efficient? Should we not look at alternative ways in energy and transportation? In my opinion, no. At the same time, I don’t see any need to over regulate either. I agree with you that businesses tend to have a better vision. I also believe that free market capitalism is the best way to prosperity, as long as there is just enough regulation, but no more that that.
Capitalism keeps the profits and socializes the cost of pollution. Someone said that global warming is the greatest failure of the free market in history.
I would say capitalism maximizes profit. As far as socializing the cost of pollution, that is where reasonable regulation is required. The key word being reasonable.
As far as someone saying global warming being the greatest failure of the free market in history. Given that we are less than 1.0 C warmer, have greater agriculture production, lower maximum temperatures, higher minimum temperatures, the question should be asked, why does socialism even still exist?
But there has been and is not sufficient regulation of pollution costs in the US. This is a serious problem that sets back the introduction of renewable sources, which cant compete when fossil feels pay no negative externalities.
I dont understand what your question about socialism has to do with temperatures. And your conclusions about temperature strike me as wrong. What data are you looking at?
You mentioned that someone said that Global Warming was Capitalism worst failure (paraphrased). My comment on socialism was directed at that. If that is the worst thing capitalism has done, why are we not all free market capitalist?
As far as the temperature data, that came from you a while back. They are not my conclusions.
http://www.climatecentral.org/gallery/graphics/daily-record-highs-are-dramatically-outpacing-daily-record-lows
If you follow that source you get to
https://science2017.globalchange.gov/chapter/6/
You will find that warmest temperatures, heat waves, warm days are down, coolest days are up. I estimate I am saving about 25% in my summer and winter personal energy needs. And before you say it, yes this only the USA. But it is the best data that goes back sufficiently in the past the world has.
As far as industry being under-regulated on pollution costs. It is an interesting opinion. Certainly before Clean Air and Clean Water Acts, however, we may have gone a bit on the over-regulated side. I do not desire a repeal of those acts. Maybe some tweaks to the regulations where needed.
Industry paying no negative externalities? I would have to disagree, at least for the USA. Maybe China, don’t know their regulatory system. Are they paying all externalities? Not sure if that would even be possible or desirable. From a policy standpoint, increasing production costs will negatively impact low income individuals.
The National Academy of Sciences estimated that fossil fuel for more than just electricity use causes damages of at least $120 B/yr to health and the environment:
“Hidden Costs of Energy: Unpriced Consequences of Energy Production and Use,” National Research Council, 2010.
http://books.nap.edu/catalog/12794.html
(Dollar figure for 2005, in 2007 dollars.)
From your last link (the CSSR Report):
“Cold extremes have become less severe over the past century. For example, the coldest daily temperature of the year has increased at most locations in the contiguous United States (Figure 6.3)”
…
“Changes in warm extremes are more nuanced than changes in cold extremes. For instance, the warmest daily temperature of the year increased in some parts of the West over the past century (Figure 6.3), but there were decreases in almost all locations east of the Rocky Mountains. In fact, all eastern regions experienced a net decrease (Table 6.2), most notably the Midwest (about 2.2F [1.2C]) and the Southeast (roughly 1.5F [0.8C]). The decreases in the eastern half of Nation, particularly in the Great Plains, are mainly tied to the unprecedented summer heat of the 1930s Dust Bowl era, which was exacerbated by land-surface feedbacks driven by springtime precipitation deficits and land mismanagement.”
barry says:
January 3, 2018 at 3:23 AM
But dont look at the data?
Oh! The average temperatures? Yes if you average up the winter minimums and the summer maximums you can claim that the Dust Bowl days weren’t as warm as the present. Did you read my earlier comment about averages and how they lose important information?
Here’s a summer Maximum and Winter Minimum comparison from NOAA’s Climate at a Glance:
http://oi66.tinypic.com/bbjue.jpg
Here’s the EPA’s heat wave index:
https://www.epa.gov/sites/production/files/styles/large/public/2016-07/high-low-temps-figure1-2016.png
Summer in the US is June to August, isn’t it?
Winter is December to January?
I see that summer maximum temps have no trend for certain lengthy periods.Would I be correct in thinking that you believe that maximum temps should be favoured, then, above minimum or maximum temps?
And you posted just upthread that the surface records are manipulated. Yet here you are now relying on them to make a positive point.
This opportunistic thumb-down/thumbs-up on sources whenever it suits the argument of the day smells pretty off to me.
Fixing: Would I be correct in thinking that you believe that maximum temps should be favoured, then, above minimum or average temps?
barry says:
January 3, 2018 at 8:08 AM
Fixing: Would I be correct in thinking that you believe that maximum temps should be favoured, then, above minimum or average temps?
If you really wanted to fix it, you would have said, “Would it be correct to say that maximum temps and minimum temps should be favored, above average temps?”
Considering that the average person has one breast and one testicle, yes that would be a good idea.
I favour average temps for reason outlined below. Not max or min.
barry says: at 8:07 AM
Summer in the US is June to August, isnt it?
Winter is December to January?
Dividing the year into four distinct seasons with equal lengths is a convention that doesn’t fit the calendar all that well. I originally looked at summer as June – September i.e., I wanted to include the solstice and equinox. But then doing the same for winter leaves out two shorter periods. Didn’t make a lot of sense. May-Oct and Nov-Apr divides the year neatly into two six month segments, one warm and one cold. Another convention? Sue me.
I see that summer maximum temps have no trend for certain lengthy periods. Would I be correct in thinking that you believe that maximum temps should be favoured, then, above minimum or maximum temps?
Other than it was originally called “Global Warming” I have no idea where you come up with that.
And you posted just upthread that the surface records are manipulated. Yet here you are now relying on them to make a positive point.
And I just posted that I have to use something. The raw data just isn’t available to me in a easily useable form
I just don’t see any integrity in calling the data rubbish one day and then trying to make some serious point that relies on it the next.
Either the data is good enough to use or it isn’t. It can’t be both.
+1
Did you read my earlier comment about averages and how they lose important information?
Yep, you said that averages lose important information, and then demonstrated how that might apply to the degree of variability.
Do you remember that Anthony Watts’ paper Fall et al 2011 corroborated the US temp record for average temps? So does CONUS for the period it has run (since 2005). Watts and co thought the min/max US temps were biased.
barry says:
January 3, 2018 at 8:30 AM
Something doesn’t add up. Any look at the historical fact of the dust bowl shows that the summers were horrendous. But it doesn’t seem to show in the official charts put out by the government funded scientists except for the EPA chart of heat waves:
https://www.epa.gov/sites/production/files/styles/large/public/2016-07/high-low-temps-figure1-2016.png
Steve
You apparently think there is a government conspiracy to hide dust bowl temperatures. Funny that It took less than 20 seconds to find this:
https://www.weather.gov/arx/heat_jul36
What I said was:
“But it doesnt seem to show in the official charts ”
Maybe I should have said “Official Temperature Charts”
Maybe if the official temperature charts showed the Min and Max temperatures the horrendous dust bowl would show.
The results of your 20 second search isn’t what the “Main Stream” media reports. It’s not what they are given in the press releases from the various government agencies involved in climate studies and if it is, it’s ignored.
Steve
I am not a fan of biased reporting, and it works both ways. Cliff Mass, a University of Washington meteorologist, often makes the claim on his blog that the Pacific Northwest has little or no long term warming trend. He does this by only showing daily highs, leaving out daily minimums or averages. Here’s an example:
“One can only make a case for global warming based on trends over an extended period, not one extreme event. So why don’t we look at the long-term (1900-2016) trend of average November maximum temperature over the Puget Sound lowlands for a period of more than a century (this is from the NOAA/NWS climate division data)? Not much trend there!”
May 1934 and July 1936 are still record months for the N.O.A.A.’s USA48 dataset. On the other hand, February 1936 is still the coldest February in their records.
The warmest three decades for USA48 are the last three decades, in order, 2000s, 1990s, 1980s.
Something doesnt add up. Any look at the historical fact of the dust bowl shows that the summers were horrendous. But it doesnt seem to show in the official charts put out by the government funded scientists except for the EPA chart of heat waves
It’s at your finger-tips, Steve and its in the official temp records.
https://tinyurl.com/y8mqd6xs
Maximum temperatures in Summer in the US were hottest in the 1930s. Data adjustments haven’t erased that.
But Winter, autumn and Spring have also become warmer, such that annual temps recently are warmer than back then.
https://tinyurl.com/yd7ej963
I don’t see a conspiracy here.
barry
Averages can work to find an overall trend but they do not indicate human misery factor or how many real people will die based upon the maximum and minimum temperatures.
As David Appell pointed out, the summer heat was intense and miserable for those living in the affected areas. Then a super bitter cold February also caused misery but you could have an average annual temperture that does not reflect the misery.
Sure, you select the data for the purpose, checking that you’re not being fooled by it, or that you’ve under or over-selected. Steve and I are not discussing human misery.
barry says:
January 3, 2018 at 5:25 PM
…Its at your finger-tips…
https://tinyurl.com/y8mqd6xs
…
https://tinyurl.com/yd7ej963
…
I dont see a conspiracy here.
Earlier I put up similar charts from the same website:
http://oi66.tinypic.com/bbjue.jpg
as I recall you didn’t like the May-Oct & Nov-Apr time frames that I used.
You are the one who brought up the terms conspiracy and fraud. Mostly I post factual stuff with links to where I got it from.
Steve,
You said:
Something doesnt add up. Any look at the historical fact of the dust bowl shows that the summers were horrendous. But it doesnt seem to show in the official charts put out by the government funded scientists except
I just showed you Summertime Max temps for the US were warmest in the 1930s using the data made by “government funded scientists.”
Did you mean to change the subject, or are you going to comment on that?
You are the one who brought up the terms conspiracy and fraud.
Have you changed your mind about that? I took it from “government funded scientists” that it was still on your mind.
From Fall et al 2011, Anthony Watts’ paper:
Temperature trend estimates vary according to site classification, with poor siting leading to an overestimate of minimum temperature trends and an underestimate of maximum temperature trends
http://www.landsurface.org/publications-protected/J108.pdf
It also says:
Homogeneity adjustments are necessary and tend to reduce the trend differences, but statistically significant differences remain for all but average temperature trends.
Max/min trends are biased (max too cold, min too hot), but the mean trend cancels the biases no matter which class of station is used.
That’s what Anthony Watts reckons, anyway.
I can’t tell what you reckon because you slam the US temp record on one day and rely on it the next.
Wow….
My prediction of a 0.1C global TLT for December 2017 was a complete joke..
I was confident the weak La Nia would have had more of a cooling effect, but I was obviously way off…
It looks like the weak La Nia has already reached its NINO3.4 SST minimum, so well get some additional TLT global cooling over the next 3~4 months but not as much as I thought we would occur.
overall sea surface temp+.192c deviation the key to what global temperatures will be doing moving forward.
The Alarmist are those who believe we are trapped into using fossil fuels. Alternative fuels can largely replace fossil fuels with little impact on the global economy (I would include new fission reactor designs). We may still need some fossil fuels or nuclear to fill gaps in power generation, but we can realistically reduce fossil fuel use by 80 or 90 percent. Naysayers, have some faith in human ingenuity and the free market.
I’d say the business world is doing a pretty good of developing alternative energy, and gov is doing slightly well at encouraging it. The chopping and changing on energy/emissions policy isn’t good for business. They do better under stable policies.
Well said, Nealf.
The ice attacks the east coast of the US.
http://images.tinypic.pl/i/00953/d1bkd3pf1wj8.png
Moving average has blipped up again. Not that it means that much, but what was I saying last month?
It’s blipped down a little bit as predicted.
http://www.drroyspencer.com/wp-content/uploads/UAH_LT_1979_thru_December_2017_v6.jpg
Oops, you got me that time. My bad. Should have put my glasses on.
Well, it’s hard to see without blowing up the chart.
David Appell says:
Dont you care about the world you leave for todays children and young people?
Dave I have read your comments on these threads for a long time now. Do you have any idea how ignorant you come off when you spew comments like this? Your camp is no where near the moral high ground you seem to think you have. For perspective call me a luke-warmer, and I am more worried about RIGHT NOW.
In the name of stopping a 2 degree warmer world which cant be done anyway and we can easily adapt to. The world is turning food into fuel. There are over a billion people with no power, and your pampered ass is part of the reason they die of respiratory illnesses (from having to burn wood and dung) and malnutrition in their millions. We could improve their situation. But in the name of CAGW for which there is absolutely no empirical evidence we do not.
So before you talk this crap again I say You first. Prove your resolve. Take nothing what-so-ever that was derived from fossil fuels and walk out into the wilderness and just live.
In Minecraft parlance, strip down naked, walk into the woods and punch a tree. I dont even give you 24 hours.
“But in the name of CAGW for which there is absolutely no empirical evidence we do not.”
Citation required. Specific instance of an improvement and empirical evidence showing that its non-use is specifically traceable to belief in “CAGW”, using exactly that term, please.
Or you could just admit that you are making it up and save a lengthy squabble requiring many subject-changes to try and draw attention from your original dishonesty.
Well that was a nice deflection. We all know that it is a fact that the alarmists don’t want the developing countries to develop. It would mean a whole bunch of CO2. It is a fact that we are perfectly capable of developing those countries. Is is a fact that developing a country – people having power as well as all the other things you take for granted – saves lives. You only need to look at life expectancy prior to and after the industrial revolution. It is sad that you can’t handle having actual facts to argue against and so this lame attempt at a rebuttal was the best you could do. What’s next? Going to attack my grammar or something like that I expect.
So where do you live Elliott? Do you have access to electricity and clean running water? I’m guessing you do, being able to post your stupidity on this blog and all.
You wouldn’t last an hour.
And, exactly as expected, you start with the empty bluster and can actually provide no support whatsoever for your claims. As if we would expect anything different!
Of course I have electricity and fresh water. I am only a couple of hundred metres down the mountain from the hypdroelectric plant which powers my village and most of the administrative region, and from which the water comes. You seem to forget that a lot of European countries are ALREADY quite successfully getting their electricity much of the time without using fossil fuels.
And that is why those countries pay the most for power. Germany and South Australia. Leading the world in over charging people for power.
The most for power, and the least for burying people who die from the effects of producing it. Correct. The overall upshot being the greatest life-expectancies and the highest quality of life for the population as a whole based on a normal working income. But thanks for acknowledging that you have to move the goalposts when it turns out that your attempts to muddy the waters have backfired.
“We all know that it is a fact that the alarmists dont want the developing countries to develop.”
Citation required. Once again, with no real expectation that you can actually support the bilge you spout.
Anyway, a lot of them are developing just fine using renewables. One bulb and a solar panel can light a house in Africa for schoolwork, and increasingly often does, and Morocco in particular is playing for the export of solar energy to Southern Europe.
“so this lame attempt at a rebuttal”
It was a demand for support. Perfectly admissible. It’s only your failure to provide any that makes it into a rebuttal.
“It would mean a whole bunch of CO2”
As they are now cheaper, it will actually mean a whole bunch of renewables. And there is nothing you can do to stop it.
“As they are now cheaper”
You are living in a fantasy world Elliott. Those countries “leading the way” in “renewables” have the highest electricity costs.
It took me 5 seconds to find this with the help of google.
https://www.ovoenergy.com/guides/energy-guides/average-electricity-prices-kwh.html
So that was just a plain old lie.
You expect the poorest people to use the most expensive power sources.
Idiocy.
“Those countries leading the way in renewables have the highest electricity costs.”
Which, of course, is a completely separate claim. Yet again.
EB
Nope.
There is in fact nothing you (and one) can do to curb seriously world fossil fuel use. We will most likely burn all the fossil fuels available because we can by now hardly do anything else.
I agree with Bob White. Nothing but idiocy.
Please get a trip to Africa and look at what it means to live without an electric grid and clean running water, modern tools and machines to grow, raise and transport the food, build the houses, wash the clothes etc etc etc. No time left to study science, slavery as in Europe, 5 centuries ago, when we were indeed already on 100 % renewables.
And it is a plain lie to state that in Europe wind and solar makes already a really sizable (in terms of climate) contribution to the grid. Ironically up to now the installed wind and solar power has led to an overall increase in CO2 emissions.
http://www.drroyspencer.com/2018/01/uah-global-temperature-update-for-december-2017-0-41-deg-c/#comment-278837
http://www.drroyspencer.com/2018/01/uah-global-temperature-update-for-december-2017-0-41-deg-c/#comment-278909
It is extremely difficult to stop the forces of a free market. The market will take any opening it is given. So long as fossil fuels are cheaper and legal they will be used. ( Even if illegal some people will use them. )
For example Ontario Canada jacked up the electricity rates so more people started converting to gas heating.
Fossil fuels are not a free market. They are heavily subsidised. And the subsidies and investment are now falling off. So, given that fossil fuels can only become MORE expensive from now on as their cost of extraction continues to rise, and given that African villages had not adopted them when they were cheaper, which way do you think it’s going to go?
Anyway, a lot of African cities have already jumped straight to renewables, and villages are increasingly able to get renewable power without the expense of grid connection.
It’s BEING curbed. You lost.
EU emissions have fallen in aggregate and per capita since 1990, despite steady growth. Renewables are quite often now providing ALL the power on the grid at regional and even national levels. The same goes for parts of Africa, by the way.
Once again, you have walled yourselves off from reality.
http://edgar.jrc.ec.europa.eu/overview.php?v=CO2andGHG1970-2016&dst=CO2gdp
EU emissions have fallen in aggregate and per capita since 1990, despite steady growth. Renewables are quite often now providing ALL the power on the grid at regional and even national levels. The same goes for parts of Africa, by the way.
Yet again, you have walled yourselves off from reality.
http://edgar.jrc.ec.europa.eu/overview.php?v=CO2andGHG1970-2016&dst=CO2gdp
gamma
“Now the practical and much more likely and realistic way to maintain (or rather rebuild) civilization in future is to drastically reduce global population level by at least one or two orders of magnitude.
Thats the real inconvenient truth.”
I agree 100%. Too bad we are such a minority.
That kind of thinking was also part of the pesduoscience of the early 20th century… Careful what you wish for..
“Please get a trip to Africa and look at what it means to live without an electric grid and clean running water, modern tools and machines to grow, raise and transport the food, build the houses, wash the clothes etc etc etc”
Again the connection between all these problems and renewables is found where? What research?
Actually many African countries have lower retail electricity prices than does the US ($120/MWh):
https://www.statista.com/statistics/503727/retail-electricity-prices-in-africa-by-select-country/
But of course Africans have much lower incomes.
Bullshit. I can’t see what I might win or lose, no horse in the race.
What matters in terms of climate is of course global (and not EU) fossil fuel consumption in the world !
And this has by no means been curbed.. It is still increasing !!!!!!
Sheer hypocrisy and, sorry, plain idiocy to trumpet EU has curbed its emissions while it imports and buys its tee-shirts, solar panels, smartphones etc etc etc made in China or Asia with power generated there by means of coal plants.
“What matters in terms of climate is of course global (and not EU) fossil fuel consumption in the world !”
And where the EU has led, the world is following.
“And this has by no means been curbed.. It is still increasing !!!!!! ”
False dichotomy. Curb means “to control or limit”. It does not mean “reduce”. The rate of growth of emissions per capita and per unit GDP has clearly reduced. In recent years, in fact, emissions were briefly constant while economic and demographic growth continued – the deniers were extremely vocal about it, in fact, as usual claiming that as action was apparently averting the problem they were right all along that there was not problem requiring action. But that’s denial in a nutshell.
By any reasonable definition, emissions have been and continue to be curbed. They will eventually be reduced, as well,
“Sheer hypocrisy and, sorry, plain idiocy to trumpet EU has curbed its emissions while it imports and buys its tee-shirts, solar panels, smartphones etc etc etc made in China or Asia with power generated there by means of coal plants.”
China is committed to an even more radical Energiewende and is already installing enormous renewable capacity. It will also be this century’s economic giant as it will now dominate renewables technology, leaving Europe in second place and the USA as an irrelevance. One might as well pretend that US denialism is “hypocrisy” because China is reducing your emissions for you whether you like it ot not.
And by the way, the world’s largest exporter is not China. It is the EU. Most of the EU’s trade is internal, and most of its goods produced in the EU. It is a net exporter. It is, therefore, not outsourcing its emissions to producers but outsourcing its renewables technology to consumers, overall.
You can check the US position in the list of net exporters here: https://en.wikipedia.org/wiki/List_of_countries_by_net_exports
Arf.
Much wishful thinking, lies and delusion.
I maintain exactly what I said. Never before has the coal consumed/capita worldwide been as high as it is today. Never.
For your info I’m a French (EU) citizen and certainly not a US (or AGW) “denier”. Funny !
And for sure a large part of the CO2 emissions needed to support the way of life in the US presently take places in China and Asia. As well as for the EU.
Finally there are various kinds of “deniers”.
There is even your kind, namely those like yourself who merely deny basic laws of Physics and all the inconvenient facts of presently available technology. You know those people who claim that the Energiewende in Germany is yet a success and saved CO2 emissions. Those people who pretend that a rapid switch to a low carbon world economy is readily possible and just a matter of appropriate politics (not one of Physics and immature technology) to be easily emulated everywhere, were it not for the naughty AGW deniers.
You know those people who tout the delusion of 100% “green” renewable energies.
Ok gammacrux wants us all to just throw up our hands and admit there is nothing to be done.
“Never before has the coal consumed/capita worldwide been as high as it is today. Never.”
As I said: False dichotomy. Are you hard of reading comprehension, perchance?
“those like yourself who merely deny basic laws of Physics”
That would have to include the host of this blog, then, as Dr. Roy also acknowledges that anthropogenic warming is happening. Which pretty-much requires that his understanding of physics be a compatible superset of my own. So you can go whistle.
“You know those people who tout the delusion of 100% green renewable energies.”
As if there can be anything else by definition in the long run. Any technology for which there is a long run is BY DEFINITION sustainable, bcasse.
L’arf.
It’s not as if one even requires the laws of physics, of course. The laws of arithmetic will do just fine.
Say the Greeks were producing 1 cubic metre of CO2 in the year 500BC. Posit a 2% per annum growth rate. What would be their yearly production today?
It’s about 3 times the volume of the Earth.
Emissions growth SHALL stall, whether you like it or not.
“World Coal Production Just Had Its Biggest Drop on Record,” Bloomberg, 6/13/17.
https://www.bloomberg.com/news/articles/2017-06-13/coal-s-era-starts-to-wane-as-world-shifts-to-cleaner-energy
(about 2016)
“World coal production fell by 6.2%, or 231 million tonnes of oil equivalent (mtoe) in 2016, the largest decline on record,” BP
https://www.bp.com/en/global/corporate/energy-economics/statistical-review-of-world-energy/coal/coal-production.html
gammacrux says:
“I maintain exactly what I said. Never before has the coal consumed/capita worldwide been as high as it is today. Never.”
BP says world coal consumption peaked in 2014:
https://www.bp.com/content/dam/bp/en/corporate/pdf/energy-economics/statistical-review-2017/bp-statistical-review-of-world-energy-2017-coal.pdf
Per capita it peaked in 2011. (my calculation)
Since then it’s dropped by over 7%.
“Bob White says:
January 3, 2018 at 10:02 AM
It took me 5 seconds to find this with the help of google.
https://www.ovoenergy.com/guides/energy-guides/average-electricity-prices-kwh.html”
It took me 3 seconds to load that page and see that it was 2011 data…. but today it’s 2018. I wouldn’t dispute the fact that renewables remain more expensive in pure $/kw terms than fossil based carbon sources, but Elliott’s point was that they are getting cheaper. How about providing us with some up to date charts showing costs of renewables over time as a better rebuttal of his claim?
Where did you get the ridiculous idea that I don’t acknowledge that AGW takes place ?
Again for your info I’m a physicist and some of us warned about it already 60 years ago and by the way little more about the magnitude of the effect is known today in spite of expensive computer work. So funny.
https://skepticalscience.com/news.php?n=3993
So who is it who “can go whistle” ?
Hilarious !
And of course It’s not because fossil fuel use is a potential threat to climate that there must ipso facto exist a technical “solution” in terms of renewables for 7+ billions people ! Elliott Bignell and other naive people’ s wishful thinking won’t just make it appear if it’s not possible from a physical point of view. Nature is very stubborn and can’t be fooled.
So who is it who spouts false reasoning and is hard of reading comprehension ?
Hilarious !
“And of course Its not because fossil fuel use is a potential threat to climate that there must ipso facto exist a technical solution in terms of renewables for 7+ billions people”
No, as I said: It is because any solution must BY DEFINITION be sustainable. Anything that is not sustainable is not a solution; anything that is a solution must be sustainable.
In addition to which, of course, anything that draws down non-renewable resources must necessarily represent a temporary step. And anything that does not keep us within the budget of energy entering the Earth system, at least until we get satellite solar power, must equally necessarily draw down non-renewable resources.
We go renewable or we cannot renew. Not exactly rocket salad.
“Where did you get the ridiculous idea that I dont acknowledge that AGW takes place ?”
From your belief that you have your own, privileged laws of physics.
OK, Nate, upthread you talked about a straw man of mine that wasn’t really one.
Here is genuine one of your’s:
There is certainly a lot to be done towards eventually powering a future civilization without fossil fuels. But the transition, most likely, can’t be done in a forced march just because of climate and also not with essentially renewables at present population level.
In France, they already have a grid powered with low carbon sources, yet it is mostly nuclear and hydro ( 87 % ). One may hardly do much better as far as CO2 emissions are concerned.
Yet France’s weight is peanuts on a global scale and its economy would nevertheless collapse without fossil fuel supply for transport; agriculture etc. Not to talk about the risks of a
general worldwide massive implementation of nuclear fission.
DA, you (rightly) tell day after day the deniers here not to confuse weather and climate.
Same holds for short term fluctuations in coal consumption.
Please, look at overall trend in the first graph shown in the following article ( in French, sorry).
https://jancovici.com/transition-energetique/l-energie-et-nous/lenergie-de-quoi-sagit-il-exactement/
As can be seen historically coal use / capita steadily increased (positive trend) and even if it were to stay constant or mildly decrease, overall coal consumption augmented. Same for other energies and historically different sources essentially add and do not really just replace one an other.. Future may (perhaps) be different but uncertainty is total.
We went already through many transitions, the first one occurred some 500 000 years ago when our ancestors began to routinely use fire.
Gamma
IMO you are looking at the problem as all or nothing type of thing. If not ALL then it is pointless. Makes no sense.
France is large country and is an example for others of an approach. Denmark, Texas, ND have another approach.
You keep talking about ‘present technology’ as if it is static, and nothing changes.
Example: 30 y ago, solar was 100 x more expensive than today, LED lighting did not exist, natural gas was ramping up. 30 y before that hydro was ramping, nuclear was 0.
The only thing static is that technology change is the norm.
Nate,
1) Marginal changes won’t have any effect on climate.
Rapid major changes are needed according to the climate scientists.
2) Of course technology and science evolve but at their own pace.
And physical laws put major constraints on the possible evolution.
3) I do not claim that we won’t phase out of fossils in future. We will necessarily do it of course.
My point is just it is highly doubtful that we can do such a difficult thing rapidly because of climate.
gammacrux,
Your chart says exactly what I wrote: world coal consumption peaked in 2014.
And my calculation (yours?) shows per capita world coal consumption peaked in 2011.
Calling it a “fluctuation” isn’t good enough, because coal is now taboo and many countries are trying to get off it. The US is reducing coal use by fracking natural gas. A 7-year decline in per capita use is rather long to simply label it a fluctuation.
There are underlying reasons why coal use is declining.
In any case, your claim in bold was patently false.
DA
Well, how how can you tell for sure that It didn’t “peak” in 2012 for an observer in 2016 as it already repeatedly”peaked” in 1964 (1988) for an observer in 1968 (1992)
Because coal is now “taboo” and similar wishful thinking ?
Let’s wait and see.
EB
Sure, just a insipid salad of wishful thinking and green bullshit.
Yet more nonsense.
Sure, sustainable energy has been making big advances. Looking at the bottom line, though, I don’t see a lot to get exited about (408.55 ppm) :
https://scripps.ucsd.edu/programs/keelingcurve/wp-content/plugins/sio-bluemoon/graphs/mlo_full_record.png
gammacrux:
You made a definitive claim that world coal consumption has never been higher than it is today.
You were wrong. Admit it.
Well, how how can you tell for sure that It didnt peak in 2012 for an observer in 2016 as it already repeatedlypeaked in 1964 (1988) for an observer in 1968 (1992)
Because coal is now taboo and similar wishful thinking ?
Lets wait and see.
Again, your claim was wrong.
Decades ago the world wasn’t trying to control carbon emissions, so burning coal made (some) sense. The situation is vastly different today, with different scientific, technological, economic, and political considerations.
Why has coal use declined in the US, over 45% since 2007. (And we don’t have a price on carbon emissions.)
DA,
You are kidding. The slow decrease in 2014 means really nothing at all.
http://www.iea.org/about/faqs/coal/
Actually what you claim is as wrong as a denier who tells us that since global mean temperatures “peaked” with the 2016 Nino they are now definitely bound to steadily decrease.
Ridiculous. Admit it.
I’ll go with what the data actually say. They prove your claim wrong. I’ll repeat it here in case you forgot:
Never before has the coal consumed/capita worldwide been as high as it is today. Never.
Today.
Again, why has coal use declined in the US, over 45% since 2007. (And when we dont have a price on carbon emissions.)
I dont buy numbers like the one you quoted from the IEA, Or numbers from the EIA, because those are often made to appease industry, and so they are often just projections of business as usual and fail to foresee innovations and political necessities like from AGW.
Further to the spurious claim that respiratory illnesses are a problem whose solution is hindered by the fact of AW: The reality is that a greater proportion of pollution-related respiratory illnesses in the developing countries are attributable to combustion of fossil fuels, primarily coal-burning and transportation. Action to reduce fossil-fuel use would save lives even if AW were miraculously not real:
“The highest concentrations of population-weighted average PM 2.5 in 2015 were in North Africa and the Middle East, due mainly to high levels of windblown mineral dust. At the country level, estimates of population-weighted average concentrations in 2015 were highest in Qatar (107 μg/m 3), Saudi Arabia (106 μg/m 3), and Egypt (105 μg/m 3).
“The next highest concentrations appear in South Asia (especially northern India and Bangladesh) and Southeast Asia, eastern China, and Central and Western sub-Saharan Africa, due to combustion emissions from multiple sources, including household solid fuel use, coal-fired power plants, agricultural and other open burning, and industrial and transportation-related sources. The population-weight – ed annual average concentrations were 89 μg/m 3 in Bangladesh, 75 μg/m 3 in Nepal, and 74 μg/m 3 in India. The population-weighted average PM 2.5 concentration in China was 58 μg/m 3, with substantial variation in concentrations among provinces (1979 μg/m 3).
“In 2016, HEI published a report on the major sources of PM 2.5 related to human activity in China, a result of HEIs Global Burden of Disease from Major Air Pollution Sources (GBD MAPS) project. It found that coal-burning by industry, power plants, and households accounted for nearly 40% of population-weighted PM 2.5 concentra – tions in China overall (see the textbox Understanding the Major Sources of PM 2.5 : The GBD MAPS Project on page 7).
“Estimates for annual average population-weighted PM 2.5 concenrations were lowest ( ≤ 8 μg/m 3) in Brunei, Sweden, Greenland, New Zealand, Australia, Finland, Canada, and several Pacific and Carib – bean island nations.”
https://www.stateofglobalair.org/sites/default/files/SOGA2017_report.pdf
Elliott – Your argument, while excellent spin, does not make any sense. We are talking about people without power and running water. How EXACTLY does fossil fuel pollution affect a person who does not have access to fossil fuel power?
I’m all for clean energy, I think every sane person is. We should use all resources at our disposal to bring everyone into the light.
Again I say, if you don’t want people without power to GET power, please lead by example. Maybe go straight to the source and move to Africa. I bet they would share their food with you. In the meantime you should be ashamed of yourself.
“How EXACTLY does fossil fuel pollution affect a person who does not have access to fossil fuel power? ”
I’m glad you asked, especially as it is hilarious to meet someone who can’t work it out for himself: They have to breathe.
“Again I say, if you dont want people without power to GET power”
Again, and not for the last time, I am sure: Citation required.
If you are simply going to openly lie to their faces, so to speak, about what people have said expect to be called on it. Do you seriously believe they are not going to notice?
So you are perfectly fine with 2000 new coal fired power plants in Africa? Let’s say I’m a multi-billionaire and I just want to donate them. I will also buy and ship all the coal there.
I dare you to answer that question honestly.
That’s my citation.
“Thats my citation.”
Exactly: You never had one. As usual, you were just lying.
“So you are perfectly fine with 2000 new coal fired power plants in Africa?”
Of course not. That would kill them with particulate pollution, and from the effects of climate change, to which Africa is especially vulnerable. I am perfectly fine with them having the same generating capacity in renewables, and will happily pay more taxes to pay for the development.
On the east coast of the US, the weather is like a movie about the ice age. Powerful precipitation from the Atlantic is changing over land into an icy rain.
Sorry.
In the northeast, there can be record snowfall.
Why did not anyone predict this storm?
https://www.accuweather.com/en/us/georgia/weather-radar
Butterfly effect. SPECIFIC storms are not predictable beyond and extremely short time-horizon, even in principle and with perfect and complete data. Only frequencies and overall average energies and intensities are susceptible to forecast beyond a few days.
The next wave of the Arctic air will reach the Great Lakes at night.
Cold AND dark, then? Phew, good thing it’s only the yanks.
Speaking of feeling ashamed of yourself, and since you clearly don’t object to changes of subject, how do you feel about the fact that I, as a European, am contributing more than you are in overseas development aid to Africa and elsewhere?
We are paying for more African electricity than you are, and we are not trying to keep them to 19th-Century technologies. Doesnt that make you sick?
Elliott
“Doesn’t that make you sick?”
I think you will find the US is the largest single donor to the poorest on the planet. Mind you Obama/Clinton probably bombed the crap out of them first.
thoughts from down under
Also thanks to Ren always check you blogs
Regards
Harry
Not relative to our wealth. Not by a long shot.
https://en.m.wikipedia.org/wiki/List_of_development_aid_country_donors#Net_official_development_assistance_by_country_as_a_percentage_of_gross_national_income_in_2015
“our wealth”?
davie, did you forget again? You don’t have any wealth. You must be talking about someone else’s money?
Why no mention of Ws bombs?
“I think you will find the US is the largest single donor to the poorest on the planet.”
The largest SINGLE donor is probably Bill Gates. The US is the largest donor by country. The average US citizen is WAY down the list: The UK and Germany both provide more than half the US national contribution to overseas development aid with 20% and 25% of the US population, respectively. The UK and Germany alone contribute about 12% more together than the USA.
Ren they can’t forecast a day or two out much less the climate.
Global temperature changes occur within certain limits. The local temperature is not constant.
https://www.tropicaltidbits.com/analysis/ocean/nino34.png
If La Nińa does not weaken in January, Europe will be frozen.
Let them worry about another global warming after the next 60 years.
http://pics.tinypic.pl/i/00954/evwa3irp3a6q.jpg
Curry has a post on a book by Bernie Lewin regarding the IPCC.
https://judithcurry.com/2018/01/03/manufacturing-consensus-the-early-history-of-the-ipcc/
It is a long post and the book is probably long too.
Could any of the resident anti-human climate alarmists please provide a quick character assassination of Bernie Lewin so I don’t have to bother reading the post or the book?
Much appreciated.
Laura, thanks for the “anti-human” invitation.
No , I will not do a “character assassination” other than to note:
“Bernie Lewin describes himself as a historian of science from Melbourne, Australia, and the author of climate disinformation blog, Enthusiasm, Scepticism, Science. The blog starts from the premise that there is insufficient evidence to make the claim that CO2 emissions are causing catastrophic global warming.
Lewin has a bachelors degree in social science, and a graduate diploma in information management, according to his LinkedIn profile. On his blogs About page, he confesses that he is not an academic.
Just for the record, in my opinion anyone who claims “there is insufficient evidence to make the claim that CO2 emissions are causing catastrophic global warming cannot be taken seriously. You cannot dismiss decades of observations and research by thousands of eminently qualified scientists with such an arrogant statement from a confessed non-academic.
I hope this is useful to you and that you don’t waste time your time on him.
professorP
One point I would like you to articulate :”Just for the record, in my opinion anyone who claims there is insufficient evidence to make the claim that CO2 emissions are causing catastrophic global warming cannot be taken seriously.”
You need to come up with a very solid definition of catastrophic global warming and what this would entail.
I would agree that there is NOT sufficient evidence to make the claim. I can see it will produce some warming. I would hate to join the anti-science group that frequently peddle their made up version of reality but I would not support the opposing extreme view either. I like to keep this Climate Science and stay away from Climate Religion (belief without needing to provide any supporting evidence).
I can already tell you computer models are not a valid source for hard science. They are the fuzzy soft science that gives some general idea but are far from conclusive. Case of point. Roy Spencer had a thread a showing how computer weather models predicted a huge snow storm for New Year’s. It never took place but a storm is taking place farther North in Maine.
Here is a quote from that earlier thread: “Historically, the most accurate weather forecast model is the ECMWF. Here is the latest ECMWF snow depth forecast for ball-drop time on New Years Eve, courtesy of Weatherbell.com. It shows two feet of snow depth at midnight New Years Eve in New York City. Most of that snow is forecast to fall in the 24 hours prior to ball-drop time:”
Looks like the actual amount is zero inches at this time.
http://www.weatherstreet.com/weather-forecast/new-york-snow-cover.htm
I will not put my faith in a computer model of something as complex and involved as weather or climate.
“You need to come up with a very solid definition of catastrophic global warming and what this would entail.”
Norman, lets start with the assumption that global average warming could be about +2 deg by the end of the century. You can forget computer models if you like since such a number can be estimated by consideration of the climate sensitivity to various forcings. You may like to assign a low probability to this, but you cannot honestly say the probability is zero.
Next consider how this warming could be distributed. It is unlikely to be uniform and more likely to be less than +2 near the equator and more than +2 (maybe +4?) towards the poles.
In such a situation the Arctic sea ice would effectively disappear. A catastrophe ? Maybe yes, maybe not.
The oceans get warmer, Greenland melt rates would increase dramatically, Antarctic melt rates the same leading to increased sea levels. A catastrophe ? More likely yes for some people.
Ocean acidification? The same.
Heat stress? Think about shifting your local climate to one which is +2 or +3 or +4 deg warmer on average. A catastrophe ? Maybe yes, maybe not.
etc etc.
You can also assign a low probability to any of these events taking place but, again, you cannot state that the probability is zero. Many people assign high probabilities and they are not all stupid as deniers like to claim.
Finally, while we are talking about the year 2100, what about 2200 if CO2 keeps increasing?
The potential for catastrophe increases even further.
Most recent empirically-based estimates of transient climate response for CO2 X 2 are around 1.5C and going lower.
http://notrickszone.com/wp-content/uploads/2017/10/Climate-Sensitivity-Value-Estimates-Update.jpg
There has been no net warming at the Antarctic since records began during the International Geophysical year in 1957.
The rational policy response to any future climate related harm is to prepare for it analogous to the way the Japanese prepare for earthquakes, not by destroying wealth with crazy alternative energy projects.
Christopher, thanks – those are interesting and relevant estimates. I need to digest them before commenting further.
I rely on the IPCC Fifth Assessment Report which stated:
“Equilibrium climate sensitivity is likely in the range 1.5 C to 4.5 C (high confidence), extremely unlikely less than 1 C (high confidence), and very unlikely greater than 6 C (medium confidence).”
Christopher, re Antarctic warming we must disagree.
“The continent-wide average surface temperature trend of Antarctica is positive and significant at >0.05 C/decade since 1957. The West Antarctic ice sheet has warmed by more than 0.1 C/decade in the last 50 years, with most of the warming occurring in winter and spring. This is somewhat offset by cooling in East Antarctica during the fall. This effect is restricted to the 1980s and 1990s.
Research published in 2009 found that overall the continent had become warmer since the 1950s, a finding consistent with the influence of man-made climate change:
“We can’t pin it down, but it certainly is consistent with the influence of greenhouse gases from fossil fuels”, said NASA scientist Drew Shindell, another study co-author.”
Chris, the image you post comes from some publication by Nicola Scafetti ?
If so, I refer you to this publication:
M. Rypdal and K. Rypdal. Testing Hypotheses about Sun-Climate Complexity Linking. Physical Review Letters 104, 128501 (2010). DOI:10.1103/PhysRevLett.104.128501
“”The theory of anthropogenic global warming consists of a set of logically interconnected and consistent hypotheses, Martin Rypdal said. This means that if a cornerstone hypothesis is proven to be false, the entire theory fails. A corresponding theory of global warming of solar origin does not exist. What does exist is a set of disconnected, mutually inconsistent, ad hoc hypotheses. If one of these is proven to be false, the typical proponent of solar warming will pull another ad hoc hypothesis out of the hat. This has been the strategy of Scafetta and West over the years
Good quote. Willie Soon does much the same, but about more than the Sun.
Too bad the data disagrees:
http://www.climate4you.com/images/70-90S MonthlyAnomaly Since1957.gif
http://notrickszone.com/wp-content/uploads/2017/03/Antarctica-UAH-1979-2016.jpg
Professor Humlum at climate4you gives two reasons why the Antarctic temperature trend is not consistent with enhanced greenhouse warming at high latitudes.
As for being consistent with greenhouse warming that quote betrays confirmation bias, besides the issue is not whether greenhouse gas emissions have or have not played a role in the global temperature trend since ~1945, but how much and what if anything to do about it.
I’ve read in various places that the Antarctic is relatively thermally isolated from the rest of the globe (circumpolar gyre/ocean current], and that global warming would be slow to affect the Antarctic.
I’d go the distance and supply links, but that only comes these days if the intitial commenter has led with such courtesy.
I agree that ‘catastrophic’ is a pretty vague term.
Curbing AGW is a risk management exercise. Ascertain the risks – they’re not definite, but it would be imprudent to ignore worst case scenarios. Plan against the worst happening, adjust strategies as necessary.
I’m a bit more optimistic that the world is heading in the prudent direction, albeit slowly, than I was a few years ago. Nothing is definite, especially the future. Accepting the range of possibilities and acting in a responsible fashion with that knowledge is good enough. No time for one-eyed pollyannas or doomsayers. They beat tin drums and polarise. There is enough information to figure that mitigation, the sooner the better, is a sensible option.
Mitigation in the US is imaginary. There may be quite a bit of natural/regenerative energy capacity produced – solar, wind, geothermal etc, but we’re making no headway, not even trying, to avoid natural flooding issues which would occur in low lying areas if the Greenland ice cap were to melt.
Seriously, are we building dikes to keep out the Atlantic in Miami? Of course not. It’d ruin the beach. On the advice of Dick Cheney, who said not to rebuild New Orleans after Katrina, the left cried out in horror against the idea. Those some ideologues who are saying do something about AGW.
Follow the money, that is the only trail. Al Gore will show the way.
When the money leaves Miami and New Orleans, the rest will follow.
Sorry, you lose me with the binary left/right thing. US politics is polarised. That’s about all the interest I have.
Hasn’t US CO2 emissions dropped slightly over the last few years while the population has increased or is that imaginary?
Barry: Yes. US emissions peaked in 2007 at 6.05 Gt.
2016 was 13% lower, at 5.19 Gt.
Building sea walls is extremely expensive, and unless they are quite long they won’t work. Nobody would fund such a thing, especially Republicans.
My understanding is that sea walls won’t work in Florida because the underlying earth is very porous, and the water will find a way inland regardless of a sea wall.
Bob White says:
“And that is why those countries pay the most for power. Germany and South Australia. Leading the world in over charging people for power.”
Hypothetically, if a country produces it’s own energy, then who does it pay?
Note, also, that there is no pretense at considering what the proper price of energy should be; more is simply presented as unfair without justification. In fact, energy production more than most other enterprises imposes external costs. If the consumer pays only for the cost of actually creating the energy then he is cheating others who pick up the external costs. So Germany and South Australia, for all we know, may lead the world in reducing the cheating of those who use less power and those with the cheapest electricity may be perpetrating a leading fraud. In fact, this is probably closer to the truth.
We have concrete experience of this in Britain with the pea-soupers and Clean Air Act: We regulated to return the costs of pollution to the polluters, making heating more expensive but preventing people actually being killed by pollution that those using heating did not have to pay for. China is going the same way right now.
Elliot, “We regulated to return the costs of pollution to the polluters, making heating more expensive ,,,”
This is the nature of the evolution of industrialization. We begin by dumping as many externals into the environment as possible. As we get richer, we begin to account for that waste/pollution whichever. Cleaning our dumps and stopping the dumping. Next, the regulators go overboard. Then we adjust to a more reasonable amount of regulation. (which is where the US is now)
It, as you indirectly noted, is a matter of self preservation.
The visitors to this blog argue the over/not enough regulation bit often. CO2 is considered by some to be a pollutant. Others, not so much – I belong with those others. Curious, to me, that something so vital to life on earth could be possibly considered a pollutant.
But that is only a reflection of political/religious views of some.
May you live long and prosper!
Thanks be to Trump!
etc.
The EU provides the more mature examples of industrial evolution. The Revolution started in Europe, after all. I am not a fan of historicism, however – more a fan of Popper – and I don’t believe that any simple model of begin/overcompensate/reconcile fits all. With our tendency to recognise some problems after they emerge and then try to regulate them back, you have what from a systems-engineering viewpoint is delayed negative feedback. The general expectation of this would be that any output signal will oscillate, perhaps settling towards a long-term stable state. Different countries would not necessarily oscillate in synchrony unless they are linked, say by trade. As we have now seen several cycles of free trade, globalisation and then an authoritarian backlash, this may be the case. I do not see any “final” state here, only a dynamic.
A systematic collapse would naturally bring a sort of final state, as might an end to growth. The tendency to overshoot inherent in delayed feedback makes a collapse plausible, but one of the two MUST eventually occur, or something between them, so we should be seeking an end to growth at some point. Endless growth is not physically possible, and some of our systems, such as pollution sinks, are clearly already close to their limits. To avert collapse, we must seek a stable state in terms of outputs to such sinks.
elliott…”Endless growth is not physically possible, and some of our systems, such as pollution sinks, are clearly already close to their limits. To avert collapse, we must seek a stable state in terms of outputs to such”
People will be reading your words 100 years from now and laughing hysterically.
Some of them clearly are now. Who cares about a few hysterics? It’s been well over 100 years since Tyndall and Arrhenius and anyone laughing at them today belongs in a padded cell. Or in politics.
Lewis wrote:
“CO2 is considered by some to be a pollutant.”
HUMAN emitted CO2 is the pollutant. Not natural CO2.
Hilarious.
Why? Arsenic is a naturally occurring substance. Increased levels due to human activity are classified as a pollutant.
Another good example is Cadmium, the chief anthropogenic source of which is phosphate fertiliser. It’s not a “pollutant” until we change its position. Then it is.
David Appell says:
January 3, 2018 at 5:05 PM
Steve Case says:
One has to wonder why that is.
Yes. And one can read about why.
Understanding Adjustments to Temperature Data, BEST
http://berkeleyearth.org/understanding-adjustments-temperature-data/
Thorough, not thoroughly fabricated: The truth about global temperature data: How thermometer and satellite data is adjusted and why it *must* be done, Scott K Johnson, Ars Technica 1/21/16.
http://arstechnica.com/science/2016/01/thorough-not-thoroughly-fabricated-the-truth-about-global-temperature-data/
Understanding Time of Observation Bias, Zeke Hausfather, 2/22/15.
https://judithcurry.com/2015/02/22/understanding-time-of-observation-bias/
Out of 77 editions that I have of the GISS Land-Ocean Temperature index, the entry for January 1880 was changed 27 times since 2005.
Can you tell me why?
How many times must adjustments be made for:
Time of observation bias?
Station movement?
Instrument change?
Urban heat effect?
Station homogenization?
Exactly what is going on?
To learn, why not read the documents I suggested?
It looks like Grayson (sorry, Roy) will move right over a wierdly warm blob of ocean. It’s an area I’ve been curious about for a couple months now (dark spot just off New England coast – upper right hand corner of chart).
http://www.cpc.ncep.noaa.gov/products/analysis_monitoring/ocean/weeklyenso_clim_81-10/wksl_anm.gif
Dr. Spencer
Have you noticed that warm blob? I can’t find anything about it on the internet.
The anomaly is subsurface, so maybe it’s no big deal.
Probably this causes the Gulf Stream.
http://pics.tinypic.pl/i/00954/xkv6kpyqmnqe.png
That is why the storm in the Northeast will intensify.
http://www.lightningwizard.com/maps/North_America/gfs_cape_usa12.png
Talk about back to the future. So it’s almost as warm as 1998? So scary!
Looking at 5 year averages might be a good exercise for you.
Are you people seriously unable to tell the difference between climate medians and climate outliers?
Dr. Roy provides a decadal trend of 0.13C. Much more useful than your attempt to scramble your own brains by picking the most unrepresentative single data point you can find. That’s 1.3C per century, plus about 0.9C to date. Quite enough to be alarming, given that we are already seeing 100-150k excess deaths per annum due to climate change.
Does that include the people who died because they could not afford to heat their homes.as a direct result of green policies its so easy to blame CC for weather events that are neither unusual or unprecedented. I have yet to see a survey that connects any increase of death rates linked to CC.you don’t have to look very far back in history to find evidence of weather related deaths many times higher than today’s.its there for all to see if you have the time to look
“A temperature increase of less than one degree Fahrenheit over half a century raised the probability of mass heat-related deaths in India by two and a half times, a new study has found….”
https://www.nytimes.com/2017/06/08/world/asia/india-heat-deaths-climate.html?_r=0
“…we further show that the increase in summer mean temperatures in India over this period corresponds to a 146% increase in the probability of heat-related mortality events of more than 100 people….”
http://advances.sciencemag.org/content/3/6/e1700066.full
“Deaths from Climate Change,” World Health Organization
http://www.who.int/heli/risks/climate/climatechange/en/
http://www.who.int/publications/cra/chapters/volume2/1543-1650.pdf?ua=1
“Does that include the people who died because they could not afford to heat their homes.as a direct result of green policies”
Name one, and show a link to the green policy in question.
As David has already supported, the most comprehensive global surveys from bodies tasked with investigating the question, such as the WHO, already estimate a current rate of 100-150k excess deaths per year due to the effects of AW. I very much doubt you could demonstrate a single case of someone who cannot heat their house “because of green policies”. I’ll be impressed if you can even identify one such death in any country that HAS a “green policy”. let alone demonstrate causation.
Although I firmly expect you to show that you do not understand the difference.
LMAO. How does it feel to be so gullible?
The UAH graph you are referring to is of the ‘lower troposphere’ not of global land temperatures. The troposphere averages 11 – 12 miles high, so you’re talking about temperatures 6 miles above the surface on average. The global land surface, not measured by UAH lower trop, is warming faster.
Do you mean kms instead of miles?
TLT measurements are weighted strongest at about 4km altitude.
Barry, you’re still talking about 2 & 1/2 miles above the surface of the planet, about half way up Mt Everest. Not a lot of people live in that strata. And there is still a big difference in global surface temps than global troposphere temperatures. UAH remains a measurement of the upper atmosphere where few people or animals can survive. It is not an equivalent measure to surface temperatures.
Sure. Why are you telling me this?
A nice comedy of errors from the Deniers here: https://www.theguardian.com/environment/planet-oz/2017/dec/19/checkmate-how-do-climate-science-deniers-predictions-stack-up
A few bets lost!
The global sea surface temperature drops markedly in December.
https://www.tropicaltidbits.com/analysis/ocean/global.png
Where would one find longer term SST graphs?
I’ve asked for a comparison to SSTs from previous La Ninas, but they never produce. Clearly they know what we’ll see.
Characteristic denialist obfusc where natural variation is concerned: Keep talking about the monthly dips, ignore the monthly jumps and refuse to acknowlege the existence of decadal trends.
Hadley SSTs, from 1850 to present:
http://www.metoffice.gov.uk/hadobs/hadsst3/data/HadSST.3.1.1.0/diagnostics/HadSST.3.1.1.0_monthly_globe_ts.txt
Do you mean such a guy, lewis?
http://www.data.jma.go.jp/gmd/kaiyou/english/long_term_sst_global/glb_warm_e.html
Here: https://bobtisdale.wordpress.com/2012/09/10/august-2012-sea-surface-temperature-sst-anomaly-update/
http://woodfortrees.org/plot/hadsst3gl/from:1979/plot/hadsst3gl/from:1979/trend
The SST is starting to drop below the trend line (+0.14 C per decade) since 1979. Don’t know if I would be making any claims about imminent massive drops in UAH temperatures based on that, unless you have an over-active imagination.
No imagination whatsoever, I. I reckon it’ll still be about 0.14C per decade in ten years’ time.
http://woodfortrees.org/plot/hadsst3gl/from:1979/plot/hadsst3gl/from:1979/trend/plot/uah6/from:1979/plot/uah6/from:1979/trend
Land surface temps and tropospheric temps over land are not co-operating with SSTs as yet.
Barry,
“I dont know how anyone can say when the LIA ended. Some people say its still ending. Always seems like pure assertion to me. And it is, because they never explain why they think this. They just seem to like it as an explanation for recent warming.”
The evidence the LIA is still ending is Exit Glacier in Seward, Ak. It’s receding over spruce trees dated from the MWP. For its ice to melt and reveal the last and re establish would take several 100 years if not more. The last could even be under the Harding Ice Field. That likely means the MWP was at least as warm and for longer.
Thanks. Do you have a link for this?
2 questions immediately arise
1) Could the MWP warmth in this area have been anomalously warm even in the context of the MWP?
2) Is this consistent across multiple glaciers or just this one? EG, does this represent a global phenomenon or strictly local?
This was the first study I came across with a quick google: not about Exit glacier, but glaciers in the N Atlantic area.
https://www.ncbi.nlm.nih.gov/pmc/articles/PMC4673052/
We use cosmogenic beryllium-10 dating to develop a moraine chronology with century-scale resolution over the last millennium and show that alpine glaciers in Baffin Island and western Greenland were at or near their maximum LIA configurations during the proposed general timing of the MWP. Complimentary paleoclimate proxy data suggest that the western North Atlantic region remained cool, whereas the eastern North Atlantic region was comparatively warmer during the MWPa dipole pattern compatible with a persistent positive phase of the North Atlantic Oscillation. These results demonstrate that over the last millennium, glaciers approached their eventual LIA maxima before what is considered the classic LIA in the Northern Hemisphere.
One glacier doesn’t prove anything about a wide ranging phenomenon like the LIA, without considering local influences.
Darwin continued here:
http://www.drroyspencer.com/2018/01/uah-global-temperature-update-for-december-2017-0-41-deg-c/#comment-279397
Thanks Svante. I replied above but it went down thread because I’m on my iPhone. I’ve had so many writings disappear while I look for links. Very frustrating. But then just a hobby for me. I laugh when I see folks debating such far afield topics when there are so many agw theory ending things out there. That it’s been as warm or warmer than now and for longer just in the last few warming periods just one of so many. Supposedly Alaska the canary. Obviously the case back in 1170 too… Thanks again for posting my reply. Such a nice guy.
The storm becomes dangerous.
http://www.ssd.noaa.gov/goes/east/eaus/flash-ir4.html
blizzard is here
I would say the little ice age ended in 1830,and this warm period is ending in year 2018
Why?
Salvatore, but previously you said the warming ended in 2002:
“Your conclusions are in a word wrong, and that will be proven over the coming years, as the temperatures of earth will start a more significant decline (which started in year 2002 by the way)….”
– Salvatore del Prete, Reply to article: IC Joanna Haigh – Declining solar activity linked to recent warming, 10/8/2010
http://climaterealists.com/index.php?id=6428
“I will be proven correct along with many in my camp that predict this will be the decade of global cooling and a large part of that cooling will be due to LOW solar activity. Mark my words.”
You wrote this in 2010, Sal. I’ve marked your words.
At the same link Salvatore also wrote
“Your study, the CO2 man made global warming hoax, don’t mean anything because in the next few years we will know ,who is right and who is wrong.”
It’s now been a “few years,” and we now who was right and who was wrong.
I admire your rigour, both of you. I can’t generally remember deniers’ names a day after I disconnect from a discussion, and here you are keeping track of their drivel over years. Glad someone is keeping track!
Thanks Elliott. And I’m enjoying reading your comments, which are science-based and insightful.
because that is when the solar Dalton Minimum ended .
I meant, why 2018?
You vastly overestimate the sun’s influence on climate change. The science puts it as less than 0.1 C per W/m2.
What do folks think of this new study which estimates 0.1 degree warming of oceans over last 50 years ? What are re there error bars on this estimate ? could this number be low due to ocean lagging atmosphere temperature?
https://wattsupwiththat.com/2018/01/04/an-instant-global-ocean-thermometer-from-antarctic-ice-cores/
I think I’ll stay on the japanese met agency’s conservative line for a while… because their surface time series is the ‘coolest’ among all.
http://www.data.jma.go.jp/gmd/kaiyou/english/long_term_sst_global/glb_warm_e.html
Oooops! Wrong chart here!
http://www.data.jma.go.jp/gmd/kaiyou/english/ohc/ohc_global_en.html
But how to convert from these petajoules in Celsius? No se!
To convert heat changes to temperature changes, use the definition of specific heat:
delta(Q) = mc*delta(T)
where Q is heat, m is mass and c is specific heat.
From the Scripps press release:
“Our precision is about 0.2 C (0.4 F) now, and the warming of the past 50 years is only about 0.1 C,” he said….”
Thanks. I looked to find where error was coming from.
They say advanced equipment can provide more precise measurements
I take this to mean that they lack really good equipment.
Maybe. Or maybe there wanted to first demonstrate proof-of-principle before going all out.
Difficult to tell much without reading the paper. Lack of error bars doesn’t inspire confidence. It’s a new technique, so take the first attempt with a grain of salt. The result isn’t out of the ordinary, but that doesn’t mean it’s sound.
The paper is loaded with error bars.
https://www.nature.com/articles/nature25152
Nature wouldn’t publish it without them.
Ah yes, there is one error bar. How do you know it is ‘loaded’ with them? Have you read it?
Skimmed it so far. But their main figure, Figure 2, has vertical error bars on all of the hundreds of data points.
Did you find a free copy? I couldn’t.
No, I get free access to Nature since I’m a science writer. I can send it to you if you email me. My email address is on my Web site, http://www.davidappell.com
Science writer?? LMAO. That’s a good one.
0.1 C for whole ocean, what does that mean for total energy total per m^2 of surface?
What is average ocean depth?
I would expect most of deep ocean has ~ 0 warming given that it takes 1000 y to turn over.
“What is average ocean depth?”
3700 m IIRC.
Average ocean depth is about 4000 m.
For a mean temperature change of the entire ocean of 0.1 C, you’d need an input heat of 1.6 GJ/m2 (= 430 kWh/m2).
Let’s say AGW has been happening for 50 years (since about 1970). Then this heat input would correspond to an average power input of 1.0 W/m2 over that time.
That’s reasonably close to the calculated planetary energy imbalance of 0.78 W/m2 for the entire ocean for 2005-2015 given in Johnson+ 2016:
Improving estimates of Earth’s energy imbalance,
Johnson, G.C., J.M. Lyman, and N.G. Loeb
Nature Clim. Change, 6, 639640, doi: 10.1038/nclimate3043 (2016)
http://www.nature.com/nclimate/journal/v6/n7/full/nclimate3043.html
And, actually, 50 years was the period of time used in this new paper. Should have looked that up first.
https://scripps.ucsd.edu/news/new-study-identifies-thermometer-past-global-ocean
And…. the study shows the ocean warmed by 0.1 C over 50 years.
A little late to the party.
I fear there is something egregiously wrong with the data being gathered by whoever gathers data. I don’t blame UAH for this in the least but I have asked the question as to how much access NOAA has to the satellite data before UAH receives it.
There is no apparent reason for temperatures remaining consistently high following the 2106 El Nino. The remaining warming far exceeds anything CO2 could produce in a century.
Either there are processes in nature of which we are not aware or NOAA has found a way to infiltrate the satellite data before it reaches UAH.
What bull. The data say something you don’t like, and instead of re-examining your understanding and beliefs you take the lazy way out and accuse someone, anyone, somewhere, anywhere of fraud.
The worst of denier behavior.
Of course el Ninos and la Ninas are not the only things affecting short-term global temps. And a long-term background warming would explain recent relatively warm temps post el Nino well enough.
But if you dig really hard you might be able to argue that there is no global warming without resorting to childish conspiracy theories.
I fear there is something egregiously wrong with the data being gathered by whoever gathers data…
There is no apparent reason for temperatures remaining consistently high following the 2106 El Nino.
A great example of someone who starts with a conclusion and bends all inquiry to maintain it. Next up, Gordon scours the net to find natural causes explaining recent temps, proving no AGW. Or maybe he’ll just monitor WUWT and wait for some other contrarian to do the cherry-picking for him.
Gordon translated:
“Things did not turn out as I predicted, which means that someone else has done something wrong. It couldn’t possibly be me.”
Perfect.
It’s easy enough to check the ENSO monitoring sites and trawl up historical data for the cycle state. It clearly does NOT always switch cleanly from one state to its opposite. There have been a few instances in the past when both positive and negative states have wandered back to neutral and then back to the prior polarity before eventually switching.
No reason, therefore, to assume that anything unusual is at work if it dithers a bit this year, as well.
It’s also a mistake to pin temperature fluctuations on ENSO events and nothing else. The last few months anomalies are only surprising if one expects global temps to follow ENSO events exactly, and perhaps under the belief that the world is not warming.
It seems to me that skeptics are disappointed the so-called pause did not return after the 2016 el Nino finished. Some go as far as to claim the data has been manipulated – just because their expectation has not been met.
lou maytrees…”The UAH graph you are referring to is of the lower troposphere not of global land temperatures. The troposphere averages 11 12 miles high, so youre talking about temperatures 6 miles above the surface on average. The global land surface, not measured by UAH lower trop, is warming faster”.
All surface temperatures are recorded in enclosures in the troposphere ranging in height from several feet and greater. The notion that sat measurements of the troposphere come from 6 miles high is nonsense. Sats can detect temperatures right to the surface.
“Sats can detect temperatures right to the surface.”
Show us your source
Gordon Robertson wrote:
“Sats can detect temperatures right to the surface”
Then answer, why is no one doing this, anywhere in the world?
Sats can detect temperatures right to the surface.
Oh dear, how utterly wrong. We’ve even cited UAH and RSS documents saying that this is not so, and verifying that the TLT temp profile is derived from the whole troposphere, weighted at about 4km altitude.
It’s hard to fathom such pig-headedness in the face of information coming from source. But the lesson is clear: GR has no idea.
Do you have a source for this grand misconception, Gordon? Anything at all? Please don’t waste time with further assertions, just give a link or something.
Satellites detect surface “radiances”, and from these they compute surface temps:
http://www.remss.com/measurements/sea-surface-temperature/
https://tinyurl.com/yaylrvkp
We’re talking global temps. They can only do that with SSTs, not land surface, and this is not included in the UAH TLT product. For UAH TLT, radiance measurements of the troposphere to 8km height, weighted at 4km is what is used, including over the oceans.
Read both links, barry. Not just the first one. MODIS does the land temps, although only in clear-sky conditions (IR only, not MW). CERES provides a satellite-based global sfc temp product (MOA), on which they base their global EBAF Sfc LW_up data product:
https://ceres-tool.larc.nasa.gov/ord-tool/jsp/SYN1degEd4Selection.jsp (Parameters > Initial Meteorological Parameters > Skin Temperature)
https://ceres-tool.larc.nasa.gov/ord-tool/jsp/EBAFSFC4Selection.jsp (Parameters > Surface Fluxes > Longwave Flux Up)
barry says, January 4, 2018 at 9:53 PM:
http://www.drroyspencer.com/wp-content/uploads/MSU2-vs-LT23-vs-LT.gif
They retrieve tropospheric MW radiances all the way from the surface air layer up to the tropopause layer, but weight them all to center just below 4 km, yes.
Thanks, I didn’t see it was 2 links.
Satellite land surface temperature estimates are also affected by atmospheric radiance through the troposphere. There is no satellite sensor that can retrieve land surface temps directly (or for the 2 meter altitude) as Gordon seems to believe.
https://tinyurl.com/ycayfroe
They retrieve tropospheric MW radiances all the way from the surface air layer up to the tropopause layer, but weight them all to center just below 4 km, yes.
Yes, for TLT, each channel yields radiance measurements through kilometers of altitude of atmosphere. There is no sensor that isolates radiance measurements to within a couple of meters, or even 1 kilometer over land.
barry says, January 5, 2018 at 1:44 AM:
Sure. But as you’ve seen, satellites are able to isolate radiances from the actual surface, both on land and sea.
barry says, January 5, 2018 at 1:44 AM:
This is true.
But as youve seen, satellites are able to isolate radiances from the actual surface, both on land and sea.
Satellites “isolate” ST? Not for land as far as I have read and following your links further.
Unfortunately, direct observations of surface irradiance are currently available only over a limited number of ground sites over land, and a handful of offshore and island locations. Therefore, a global estimate of the surface radiation budget must be determined indirectly through radiative transfer model calculations initialized using satellite-derived cloud and aerosol properties and meteorological data from assimilation models…
The surface irradiance estimated in the Clouds and the Earth’s Radiant Energy System (CERES) project relies on Moderate Resolution Imaging Spectrometer (MODIS) derived cloud and aerosol properties and also uses CERES-derived top-of-atmosphere (TOA) irradiance as a constraint [Charlock et al., 2006]. Despite the relative success in using such data sets, the accuracies of surface radiation estimates are constrained by the limitations in accurately retrieving all of the necessary cloud parameters needed for the radiative transfer models.
http://onlinelibrary.wiley.com/doi/10.1029/2011JD016050/full
Any case, none of this has to do with what Gordon is talking about.
barry says, January 5, 2018 at 4:14 AM:
Come on, barry. Don’t make this so hard. Not ST. Surface “radiances”. Here’s what is said:
“DESCRIPTION
Here we offer daily composites and monthly means of the land surface temperature as derived from infrared radiances measured with the MODIS-TERRA sensor at its channels 31 and 32. From radiances obtained under clear-sky conditions the land surface temperature is obtained using a split window technique. This data set is the final product of a product chain.”
Sensor channels 31 and 32 detect IR radiation inside the main infrared atmospheric window, which, in clear-sky conditions, for all intents and purposes means thermal radiation straight from the surface:
https://tinyurl.com/yaagr2mg
This, BTW, is the same technique as used by the orbiting satellites around Mars to determine its gl ST:
http://gemelli.spacescience.org/jbandfield/publications/bandfield_mcs_tes.pdf (Table 2, Figure 6)
Okay.
In clear sky conditions….
But about half the sky isn’t clear. This is why no one is compiling a time series of surface temperatures measured by satellite.
DA…”But about half the sky isnt clear. This is why no one is compiling a time series of surface temperatures measured by satellite”.
So you are claiming that high frequency EM cannot penetrate an overcast sky. Guess I’d better stop using my cell phone when it’s cloudy since it obviously doesn’t work. And I was deluded watching all those TV programs on old-fashioned antennas on cloudy days.
Gordon Robertson says:
“So you are claiming that high frequency EM cannot penetrate an overcast sky.”
They’re not “high frequencies,” they’re low frequencies — microwaves. About 100,000 times lower than infrared radiation.
Cell phones use frequencies of about 700-2600 MHz (microwaves are roughly 300 MHz), but the transmission is short range so they don’t have to deal with clouds.
http://www.drroyspencer.com/2018/01/uah-global-temperature-update-for-december-2017-0-41-deg-c/#comment-279247
It’s not a terrible feeling to find something to agree on.
Indeed.
barry…”There is no satellite sensor that can retrieve land surface temps directly (or for the 2 meter altitude) as Gordon seems to believe”.
Who is talking about the land surface? Do surface thermometers measure land surface temps? Do they stick them in the soil and measure the soil temps?
Satellites gather microwave radiation from oxygen molecules. There is nothing to stop them gathering that data from near surface, as in right above the surface. The notion of sat telemetry being limited to 6 miles of altitude is ludicrous.
Please note, sats do not gather temperature data from CO2 molecules. I wonder why? [/sarc off].
Gordon Robertson says:
“Satellites gather microwave radiation from oxygen molecules. There is nothing to stop them gathering that data from near surface, as in right above the surface.”
And how would they know if oxygen microwaves they receive are from near the surface or higher in the atmosphere?
Satellites gather microwave radiation from oxygen molecules. There is nothing to stop them gathering that data from near surface, as in right above the surface
The satellite instruments used for UAH global temps cannot isolate radiance measurements of molecules near the surface from the rest of the troposphere.
If the sensors could do that, then UAH would be able to provide a direct analog for surface temps. That would be incredibly useful, but they simply can’t do it with the microwave sensors they use, which ‘see’ through clouds. You can derive surface radiance using IR sensors (with much post-measurement processing), but they can’t see through clouds.
It’s hard to believe you don’t know this after all the time you’ve spent on this blog.
And how would they know if oxygen microwaves they receive are from near the surface or higher in the atmosphere?
Good question.
DAppell..”Lewis wrote:
CO2 is considered by some to be a pollutant.”
HUMAN emitted CO2 is the pollutant. Not natural CO2″.
How convenient and how idiotic. So the elements C and O when combined become a pollutant if humans emit them but not a pollutant if the oceans, forests, and swamps emit them naturally.
Why do you alarmists hate human beings so much?
Yes, manmade CO2 is a pollutant — an unwanted substance with deleterious effects.
Legally, it’s a pollutant in the US.
—
You comment about hate is a sign of desperation and frustration. It doesn’t deserve the dignity of a reply.
Desperation and frustration are symptoms associated with a sore loser.
Gordon knows deep down he has been deluded all these years.
profp…”Gordon knows deep down he has been deluded all these years”.
I am still trying to understand why you’re type don’t understand basic chemistry. The amount of heat contributed by each gas in the atmosphere is directly proportional to it’s concentration. That’s the Ideal Gas Law and Dalton’s law of partial pressures.
I am not interested in the ravings of climate modelers who have arbitrarily assigned CO2 a heating factor of 9% to 25%, depending on humidity. They have also assigned a positive feedback to back-radiation from ACO2 which is a direct contravention of the 2nd law.
Either the present maintenance of a global average around 0.4C above the baseline is due to corruption from NOAA or something is going on that no one understands.
John Christy of UAH has been eminently humble about that possibility, claiming he is humbled by the complexity of the atmosphere. Maybe if alarmists like you had more humility you’d get it that you are the deluded party.
Gordon Robertson says:
“The amount of heat contributed by each gas in the atmosphere is directly proportional to its concentration. Thats the Ideal Gas Law and Daltons law of partial pressures.”
And radiative transfer. Which, for some reason, you routinely ignore.
Cognitive dissonance can be an ugly disease.
Gordon Robertson wrote:
“I am not interested in the ravings of climate modelers who have arbitrarily assigned CO2 a heating factor of 9% to 25%, depending on humidity. They have also assigned a positive feedback to back-radiation from ACO2 which is a direct contravention of the 2nd law.”
These numbers are calculated, as you well know.
And they do not violate the 2nd law, as you know also.
Your lack of interest is precisely your problem — you need to pretend that you are always right and the rest of the world is always wrong. Just like Donald Trump.
davie, with the booming economy, even you should be able to get a job.
How many job applications did you complete this week?
“So the elements C and O when combined become a pollutant if humans emit them but not a pollutant if the oceans, forests, and swamps emit them naturally.”
Of course. Water is a pollutant in a fuel tank; fuel is a pollutant in a river. What constitutes a pollutant is context-sensitive.
elliott…”Of course. Water is a pollutant in a fuel tank; fuel is a pollutant in a river. What constitutes a pollutant is context-sensitive”.
AGW in the mind is also a pollutant. CO2 in the atmosphere is not. Maybe coal soot and SO2 but not CO2, an odourless gas that stimulates life in plants, trees, etc.
CO2 also causes higher temperatures. To ignore this effect while only citing plant fertilization is dishonest.
“Unfortunately, the simple idea that global warming could provide at least some benefits to humanity by increasing plant production is complicated by a number of factors. It is true that fertilizing plants with CO2 and giving them warmer temperatures increases growth under some conditions, but there are trade-offs. While global warming can increase plant growth in areas that are near the lower limits of temperature (e.g., large swaths of Canada and Russia), it can make it too hot for plant growth in areas that are near their upper limits (e.g., the tropics). In addition, plant productivity is determined by many things (e.g., sunlight, temperature, nutrients, and precipitation), several of which are influenced by climate change and interact with one another.”
“Does a Warmer World Mean a Greener World? Not Likely!,” Jonathan Chase, PLOS Biology, June 10, 2015.
http://journals.plos.org/plosbiology/article?id=info:doi/10.1371/journal.pbio.1002166
davie spouts his pseudoscience: “CO2 also causes higher temperatures.”
davie, where is your “evidence” of such nonsense.
Valid physics only, not “bird-cage liners”. Show us the equations.
I love CO2! I could do with more! Makes my plants grow. Love the bubbles of wines fermenting and olives too.
Gotta get me a poster and T-shirt. I luv CO2; without it u r dead. Double the dose for perfect health!
tony: if CO2 is so good for plants, why are there no plants on Venus (atmo CO2 = 96%)?
davie, are you seriously that clueless?
DA: As usual Davie, you are clueless on science or the implications. Here I am in total agreement with G*
You go around trolling and promoting junk science and junk scientists. I clearly caught you out on this before on a number of occasions.
CO2, in the conditions pertinent to earth, could not increase to dramatic levels as a result of humans. We also could never get 90+ atm of CO2 on earth due to humans no matter how much you fart. Unicorn farts won’t do it either. Do you grasp the significance. I did say “double the dose” but even a bit more would be beneficial.
Mars has nearly 100% CO2 and is mighty cold even adjusting for insolation differences.
I luv CO2; please more of it! Double the dose for perfect health!
RSS December anomaly is out also recording a tick up from last month. Here’s the monthly anomalies from Jan 2016, same period as Roy’s table in the article.
2016 1 0.8444
2016 2 1.1666
2016 3 1.0400
2016 4 0.9434
2016 5 0.6855
2016 6 0.6273
2016 7 0.6449
2016 8 0.6363
2016 9 0.7619
2016 10 0.6056
2016 11 0.5801
2016 12 0.4020
2017 1 0.5857
2017 2 0.6693
2017 3 0.5709
2017 4 0.5500
2017 5 0.6325
2017 6 0.4906
2017 7 0.5995
2017 8 0.7183
2017 9 0.8472
2017 10 0.8060
2017 11 0.5501
2017 12 0.5892
Monthly anomalies for both data sets usually but not always change in the same direction. Remember, they have different baselines, so the values aren’t directly comparable.
barry
RSS3.3 is considered deprecated by Mears and Wentz but is still active (UAH5.6 is no longer, shut down last year in july).
Thus please mention 4.0 when you publish.
Moreover it would be nice to give the link, as for example the data I download slightly differs:
http://data.remss.com/msu/monthly_time_series/RSS_Monthly_MSU_AMSU_Channel_TLT_Anomalies_Land_and_Ocean_v04_0.txt
Thanks in advance.
This is the link I use (v4):
http://images.remss.com/data/msu/graphics/TLT_v40/time_series/RSS_TS_channel_TLT_Global_Land_And_Sea_v04_0.txt
I found myself locked out of other links when RSS began asking for a login to get their data.
Are they different? I wonder why.
Somewhere on RSS’s site you can apply for a login & password to their data pages….
Did that and forgot the password.
barry, always use the word “password” for your password. Then you won’t forget it.
☺
Well hell, not always, but yes, for a non-sensitive account that’s a good idea.
Well, they’re not different numerically, just that the link you’ve got has 3 decimal places instead of 4, and they are rounded.
This new year has opened up with more fun times following the hilarious end to last year; green plates in the sky and moon spin.
The importance of being ernest takes centre stage with microscopic detailed calculations of the T rate increase a whopping 1.3C per century.
I could have sworn that the start of the satellite series was just when the Great PDO shift took place in the late 70’s. after a drop in T from the mid 1940’s The end point reflects the highest T evah given the el Nino events.
So we start low and end with a high to get 1.3C per century. Dire, real dire! If I had chosen the opposite I would be told I was cherry picking but it seems that this is good methodology for warmers.
FAR predicted 3C per century. Hilarious!
NB for Appell: the word used is PREDICTED, got it?
While all the noise in this forum is about this supposed 1.3C doom rate of T change there is the ever popular Monkton at WUWT giving his version which mocks what is said here.
Perhaps we should start a list of prophecies and note their success or fail. Let’s not leave out the chief scientist Al Gore! His assistant was of course James Hansen the father of modern climastrology.
I leave it to others to fill in the details but Hansen is colourful. On his prediction I visualized office workers in Manhattan dropping fishing lines out of their windows to catch the fish for lunch and dinner. Before the last Presidential elections he was pressing for the direct extraction of CO2 from the atmosphere as a matter of urgency such was the danger. Shortly after the election he stated it was not so urgent. The moon does spin on its axis too!
Wow TonyM!
Do I read right? Has ‘ever popular’ become a valuable attribute for you?
Despite the somewhat hilarious 3 C you mentioned above, if I have to choose as source between the ‘ever popular’ third viscount Monckton of Brenchley (journalist) and the IPCC info selection staff, I’ll take the latter.
Your choice, Tony!
Bindidon:
It is of no interest to me what you read into it. I think I am usually clear on what I say but if you don’t grasp it then it is a simple thing to ask me to clarify. Usually this would include quoting me and I would try to clarify.
As for Monkton my reference is clearly a comparison with the comments on this site (not by Dr Roy) and on this topic. You are perfectly free to take the failed predictions of the IPCC. It is a body established to promote only the supposed human influence on CAGW, climate change or whatever other euphamism is the flavour of the moment. Hence it is a prejudged outcome and cannot be classified as science which must always be open to questioning.
Consensus science is the science we have when there is no science. Otherwise we would point to the testable hypothesis and experiments which support it. So please do that for me instead of hiding behind the IPCC.
Tonym:
Climate science isn’t an experimental science, it’s an observational science.
But it does apply different parts of different sciences that HAVE been experimentally verified: the Planck law, Kirchoff’s law, the laws of thermodynamics, the physics of fluid flow, etc.
davie rambles: “But it does apply different parts of different sciences..”
No davie, “climate science” misapplies science. That’s why you end up with nonsense like the Sun can heat the Earth to 800,000K. Or, CO2 can warm the planet.
dT = dQ/mc
dQ/dt = 1.22e17 J/s (given) => dQ = 3.85e33 J over 1 Gyrs.
m = mass of Earth = 6.0e24 kg
c = specific heat of Earth = about 850 J/kgK (Table 2.6, http://link.springer.com/chapter/10.1007%2F978-3-642-34023-9_2) for both mantle and outer core (together they comprise over 99% of the Earths volume).
=> dT = 760,000 K
QED
davie demonstrates, AGAIN, his inability to understand quantum physics, radiative heat transfer, and the Laws of Thermodynamics.
It’s fun to watch.
Tonym wrote:
“Consensus science is the science we have when there is no science.”
NASA used consensus science to get to the moon. You depend on consensus science every time you start your car. You’re depending on it right now as you use your computer.
David APPELL,
You obviously find it hard to grasp consensus due to scientific testing and consensus due to waffling.
All of these fields are applied science. All have been subjected to rigorous testing. Other than space flight all pass with flying colours. Heavens, I test my car every time I start it. My only failure was when I flattened the battery! Similarly with my computer; almost invariably a pass.
Yeah, there have been failures with space flight. Some should have been found before flight but sadly, ce la vie.
In all these fields we can point to the success rate of experimental tests. This is what subsequently gives the consensus.
Now show me the success rates in climastrology. You would be scraping the bottom of the barrel as they say. Did anything turn up?
Consensus science is the science we have when there is no science.
Tony, climate science is not an experimental science. Do you understand why? (Short answer: there is no Earth 2 to use as a control.)
Experiments also can’t be done for the sciences of geology, astronomy, medicine, economics. But we have learned a great deal from them.
So stop harping about experiments — it just shows you don’t understand what an experiment is and when they’re possible or not possible.
tony, climate science uses many of the same tools used in weather prediction models. Lots of testing every day! Prediction way better than when I was a kid.
Consensus has developed about what works in weather modeling. That consensus is taught in meteorology courses. Next generation improves it. That’s how science/tech progresses.
David,
As I thought, you scraped the bottom of the barrel and found nothing. Zip! Total failure. So much for science.
I give you a more detailed response at the start of a new thread as this has become unwieldy.
Nate:
I commented in a new comment thread similar to DA.
tonym says: “So we start low and end with a high to get 1.3C per century. Dire, real dire! ”
Good point, tonym.
And yes, the “blue/green plates” and “moon/spin” were especially entertaining.
The “plates” problem involves understanding physics, which is not a common background here. But, how some tried to manipulate the pseudoscience was amazing. The imaginary concept of a “black body” is “defined” to act as a perfect absorber/emitter, or insulator, or heat source, as needed to support the agenda.
Hilarious.
The “moon” does not require any background to understand. It can easily be verified on a kitchen table with any spherical object, by a 12-year-old with an open mind. So, the effort to somehow re-define “axis of rotation” was amusing.
My prediction is 2018 will be even more fun, as the pseudoscience continues to be exposed, and the desperation increases.
g*r…”The imaginary concept of a black body is defined to act as a perfect absorber/emitter, or insulator, or heat source, as needed to support the agenda”.
Not really a perfect emitter. The theoretical BB absorbs all frequencies but emits lower frequency below a certain cutoff point.
For example, treating the Earth as a BB means it absorbs all frequencies of EM from the Sun but only emits frequencies in the low end of the infrared spectrum.
Can’t imagine how the Sun behaves as a BB since I cannot imagine it absorbing all frequencies of EM.
Gordon erroneously states: “The theoretical BB absorbs all frequencies but emits lower frequency below a certain cutoff point.”
Sorry Gordon, but a “theoretical BB emits based on its temperature, a perfect Planck spectrum. There is no meaningful “cutoff point”.
And, I’m not sure where you are going with the Earth/Sun. The quote from my comment was about the blue/green plate problem.
Gordon Robertson says:
“The theoretical BB absorbs all frequencies but emits lower frequency below a certain cutoff point.”
No Gordon. A blackbody absorbs all frequencies and emits all frequencies.
https://en.wikipedia.org/wiki/Black_body#/media/File:Black_body.svg
“The plates problem involves understanding physics, which is not a common background here. But, how some tried to manipulate the pseudoscience was amazing. The imaginary concept of a black body is defined to act as a perfect absorber/emitter, or insulator, or heat source, as needed to support the agenda.”
G* continues to live in bass-ackward world, where up is down, unequal is equal, no one understands physics-but he does, energy is created from nothing, heat flows from hot to hot, charcoal is a mirror, and ordinary facts are hilarious.
flat tires, probably no one understands your disconnected rambling.
But, that’s okay, you’re nevertheless desperately hilarious.
G* reading comprehension is a useful skill to develop.
tonym wrote:
“So we start low and end with a high to get 1.3C per century. Dire, real dire!”
1) You’re assuming the trend will remain linear for a century, which isn’t a good assumption, because of feedbacks coming to the fore.
2) Even at your rate, we’d take 4 centuries to get the same warming that the Earth had in about 100 centuries coming out of the last icy period. We’re warming 25-30 times as fast.
BTW, do you understand the difference between a prediction and a projection?
davie, the chance of your “feedbacks” happening is even less that your chance of getting a 6-figure annual income.
Can you say “wee”?
DA…”Were warming 25-30 times as fast”.
From a mini ice age. Temps during the Little Ice Age were 1C to 2C below normal. What else would you expect from a planet that is re-warming?
Temps got back to pre LIA levels a hundred years ago, didn’t they?
Yes Barry. Gordon is again wrong.
Gordon Robertson says:
“Temps during the Little Ice Age were 1C to 2C below normal.”
No, there were less than 0.5 C below those of 1000-1200 CE.
D Appell:
I am not assuming anything but reflecting the comments made earlier by commenters including yourself. Do look!!
Barry:
1.3C warming in a century would be the fastest rate of global change since the ice ages.
http://www.drroyspencer.com/2018/01/uah-global-temperature-update-for-december-2017-0-41-deg-c/#comment-278768
You, DA, adds:
Warming is now about 30 times faster than the average rate of warming coming out of the Last Glacial Maximum.
You now double down on this.
DA this is your hallmark of sensationalism and trolling. I have had to admonish you when u cited Marcott’s work as confirming the current status as being unprecedented. You are forever the troll when Marcott himself stated that modern instrumental records could not be compared with centennial and bicentennial proxies used in his paper.
Indeed short term to long period comparisons themselves are invalid for obvious reasons.
That goes for Barry’s comment too! No, I don’t include him in the “troll” descriptor; that is your flag!
BTW David, do you understand the meaning of the word “prediction?” Go to FAR!
Our current rate of warming is about 30 times faster than the average after the last ice age (glacial period) ended.
From Shakun et al Nature 2012 Figure 2a:
http://www.nature.com/nature/journal/v484/n7392/full/nature10915.html
global temperature anomaly in year -18,000 is -3.4 C
global temperature anomaly in year -11,000 is +0.0 C
so the average temperature change is 3.4 C in 7000 years, or ~ +0.005 C/decade, compared to NOAAs current 30-year trend of +0.17 C/decade
So that’s a factor of 32 now compared to then.
http://davidappell.blogspot.com/2015/06/current-warming-30-times-faster-than.html
I still don’t see any evidence you know the difference between a prediction and a projection.
davie, let me see if I can help you.
I PROJECT that you will continue to wallow in your pseudoscience another year. That PROJECTION is based on observations here.
I PREDICT that you will continue to wallow in your pseudoscience another year. That PREDICTION is based on my “gut feeling”.
Does that help?
D Appell:
I can’t help what you see or don’t see nor your persistent myopia or troll virtues. Go look up the dictionary for the definition of prediction.
It seems you never will learn.
The quote from the first page of the Executive Summary of the Summary for Policy Makers, FAR 1990:1
“Based on current model results, we predict:
Under the IPCC Business-as-Usual (Scenario A) emissions of greenhouse gases, a rate of increase of global mean temperature during the next century of about 0.3C per decade (with an uncertainty range of 0.2C 0.5C)” [IPCC FAR summary]
Notice the word PREDICT. We had this discussion before but I don’t recall when but it is a deja vu moment as follows:
You are the one who has said climate conjecture cannot be “tested.”
You avoid subjecting the CAGW hypothesis to testing by ignoring the abject failures of Hansen and FAR predictions put forward more than twenty years ago. Yet, you jump to attack Salvatore when he has had only five years to fulfil his predictions.
Your previous comments breach the 1st Law of T but you scurry off to hide under the bed covers.
Your are somewhat inconsistent. NO, that’s not right: you are perfectly consistent. Just what I expect from you.
David, you just keep trolling on!
Notice the word PREDICT.
A projection is a prediction IF its assumptions come to pass. Which is, of course, exactly what the projection does!
You still clearly do not understand what a projection is.
The First Climate Model Turns 50, And Predicted Global Warming Almost Perfectly, Ethan Siegel, Forbes.com, 3/15/17.
https://www.forbes.com/sites/startswithabang/2017/03/15/the-first-climate-model-turns-50-and-predicted-global-warming-almost-perfectly/#227ae5746614
“In fact, the match of observed temperature to Hansens scenario is C quite good.”
– Tamino, 3/21/14
https://tamino.wordpress.com/2014/03/21/hansens-1988-predictions/
David Appell:
Can you read or are you simply thick?
The conditions:
Under the IPCC Business-as-Usual (Scenario A) emissions of greenhouse gases etc
Do you notice the word EMISSIONS? Got it or do you wish to obfuscate and conflate again?
Similarly it applies to Hansen’s BAU predictions.
Emissions of both CO2 and CH4 have certainly more than met these conditions. Just do a quick Google.
Both Hansen and FAR fail!! Should that be period?
Yet you link to Manabe et al who did not go on the thermageddon bandwagon as Hansen and others have.
You also link to Tamino. Who is he? Some expert with a track record, a guru or what? A quick search finds that he is:
Self-described Hansen bulldog Tamino, writing at NASAs realclimate blog hosted by Hansens other bulldog (Gavin),
So we are to expect objective analysis are we? He starts off by seemingly acknowledging emissions of CO2 has actually increased but the rubbishes critics for failing to account for CH4.
He then turns to Mauna Loa measures of CH4 which are fairly static after 2000 to 2010.
Only a clot could assume that Mauna Loa measures world emissions of CH4.
So he switched away from emissions which have actually grown; they exceed business as usual!
David if we increase the size of the barn door and shift it around sufficiently you too can hit it!
David, you just keep trolling on!
Taming is a scientist who has written some important papers. Hes an expert on statistics. He writes a blog called Open Mind. Google for it.
For Gods sake, no one in the world thinks Maura Loa measures methane emissions. Where did you ever get that ridiculous notion?
David Appell:
Your response shows you to be more of a time wasting, trolling clot than I could have thought. You cite references as your ticket to authority but it becomes clear that you don’t read the detail, don’t analyze them, don’t understand them or are simply a denier of facts or combination in various degrees. Is it any wonder you were banned at WUWT.
Yet you have the audacity to demand of Ren that he desist from posting when all he does is post mostly references to data. Most of us, I feel, appreciate his efforts in part because he doesn’t foist any deliberate, distorted view in the process quite unlike yourself.
You claim Tamino is a noted expert. I could not care less if you regard him as God’s archangel; he has deliberately misled the findings by switching data in the reference you gave. You endorse this by accepting it and continuing to pretend he is correct even though it has been pointed out to you. You are a indeed a troll!
He states:
Hansen estimated future temperature based on three scenarios of possible greenhouse gas emissions, high emissions (scenario A), medium (scenario B), and low (scenario C).
NOTE
FAR and Hansen PREDICTIONS rest on EMISSIONS of scenario where A) is business as usual (BAU) which is growth of >1.5% p.a. which was exceeded.
Tamino acknowledges this claim for CO2 :
…temperature had to come closest to Hansens scenario A because CO2 increase has most closely matched Hansens scenario A
But he says CO2 is not the only man made forcing and proceeds to CH4. So far so good. Then comes the switch; the pea and thimble trick of dishonesty and shenanigans which you endorse.
He says:
Heres a comparison of the methane concentration (the 2nd-most-important man-made greenhouse gas) used in those models, to observed methane concentration since 1983 (measured at the Mauna Loa atmospheric observatory):
It turns out that methane has increased more slowly than the slowest of the scenarios.
Of course it has!!! Mauna Loa measured it! But that is not measuring EMISSIONS which actually increased at BAU!!! The pea and thimble switch!!
FAR and Hansen predictions FAIL! Man is not such a baddie! Have you found anything by scraping the bottom of that barrel yet?
TonyM
Your logic is assbackwards. The PDO turned positive around 1977. The UAH dataset did not start until Dec, 1978, almost two years later.
This is starting HIGH, not low. It remained high (positive) for most of the record’s first 20 years. We didn’t see a significantly negative PDO until 1998.
http://research.jisao.washington.edu/pdo/pdo_tsplot_jan2017.png
snake, the start of a 20 year positive would be considered starting “low”.
Your logic is, well, non-existent.
(This is going to be a GREAT year in climate comedy!)
g*
What if the first 20 years of the UAH record had featured a negative PDO rather than a positive one? Would you consider that “starting high”?
Most people that understand logic can answer that. Are you saying that you are unable to process logic, and require adult help?
G*, lecturing people about logic is funny when you yourself have very often rejected straightforward logic.
“flat tires”, that’s especially funny, knowing your tendency to project your own failings and inadequacies on others.
G* a black object, which is defined to be a strong absorber, cannot behave like a mirror, a strong reflector. Yet you reject this straightforward logic.
Snape:
I don’t know much about assbackwards logic but you might consider it for your comment. Do you suggest that the PDO operates like a light switch? That is not what the data show.
I turn to GISS (not my fav) where the anomalies are in 100ths of C:
1944: +22
1950’s and 60’s : some down to -22
1976: -13
1977: +22
1978: +6
1979: +13
1980: +29
1981: +31
So the 78 and 79 years are both lows compared to later and 1944 even though the PDO shift started in 1977 as you say.
I’m happy for Dr Roy to correct me if I am wrong and he is around.
In CO2 terms the surge started post world war 2 so that basically most of the T prior to then could not be CO2. Otherwise the 2015 to 1945 period would show exceptional CO2 sensitivity such that it would clearly falsify the CO2 claimed sensitivities subsequently. As it is the IPCC hedge their bets with nondescript terms like ‘over 50% attributable to man’ post 1950. Yeah right; clear science by sucking finger and putting in the air as opposed to elsewhere.
TonyM
I wonder how you would answer the question g* just evaded?
What if the 39 year UAH record had started around 20 years earlier, near the beginning of a negative PDO, when the anomaly was – 0.22?
Would you consider that “starting high”
snake, g* did NOT evade your question. You just did not understand it. And then, you could not answer my question.
So, YOU are the one evading, not me.
Just like a 12-year-old, you get wrapped around your axle so easily.
(It’s going to be a great year in climate comedy.)
“The study determined that the average global ocean temperature at the peak of the most recent ice age was 0.9 C (33.6 F). The modern oceans average temperature is 3.5 C (38.3 F). The incremental measurements between these data points provide an understanding of the global climate never before possible.”
https://wattsupwiththat.com/2018/01/04/an-instant-global-ocean-thermometer-from-antarctic-ice-cores/
And the blog poster, David Middleton, says:
“Color me skeptical about the claim that the ratio of argon, krypton, and xenon measured anywhere on the planet or in ice core bubbles yields the average temperature of the worlds oceans to within 0.2 C.
Their work does seem to have yielded one useful result:
Our precision is about 0.2 C (0.4 F) now, and the warming of the past 50 years is only about 0.1 C.
The warming of the past 50 years is equal to half the margin of error of the new global ocean thermometer.”
So glacial periods had average ocean of about 1 C
and .1 C increase is about .5 increase in global air.
Increase of ocean of 2.5 C is 25 times .5 = 12.5 C increase in global air temperature.
Hmm.
Average ocean temperature have higher, last interglacial was 1 to 2 C warmer. Global air 5 to 10 C higher?
I don’t think so.
And tens millions of years ago ocean have been 10 C warmer, 50 C warmer air temperature. Nope
Hmm. And doesn’t work if .1 C average ocean equals .25 C increase in global air.
I would tend to think your ice box climate is fairly sensitive to average ocean temperature changes.
And average ocean of more than say 5 C, means no permanent polar sea ice. But 5 C [3.5 + 1.5 or 15 times .5 = 7.5 C] is too high.
Let’s say 5 C ocean equals 7.5 C increase to global average surface ocean temperatures- so 17 + 7.5 = average ocean temp of 22.5 C. What does average ocean temperature of 22.5 do in terms increasing land air temperature?
It seems it have large effect upon Canada current average air temperature of about -4 C. It could make it say, 5 C, or increase average air by about 10 C. Making all of Canada almost habitable.
I think it’s probably around .1 C average ocean equals .25 C increase in global ocean surface temperatures.
And applies only to ice box climates.
And glacial periods are colder due to affects of ice caps in temperate zones.
“And glacial periods are colder due to affects of ice caps in temperate zones.”
If use .1 C ocean to .25 C ocean surface.
A 2.5 C colder ocean is -6.25 to ocean surface temperature of 17. Giving average surface temperature of 11.75 C.
Having a surface ocean temperature of 12 C rather 17 C would mean the ocean not warming land regions very much.
Or what is called greenhouse effect is mostly limited to tropical region.
Recently I had a bit of fun. I added a little method in a UAH grid object computing, for each of the about 9500 cells in Roy Spencer’s 2.5 degree grid (tinyurl.com/ybpn9zuj till tinyurl.com/yd9m2zsb) the lowest resp. highest anomaly since dec 1978, summing up their difference in a time series.
To give an example, for 1998 1823 cells had their highest anomaly in that year, and 73 their least one, giving subtracted 1750 (i.e. about 20% of all cells).
Superposed with the temperature anomalies – scaled appropriately of course, that gives the following funny chart (monthly data was averaged to years for clarity):
http://4GP.ME/bbtc/1515169305390.jpg
It was nice to compare the ENSO eventr 97/98 and 15/16: despite the latter showing a higher global average than the former, there were far more maxmins in 97/98 than in 15/16.
It might be interesting to refine the output by splitting it into UAH’s 66 active latitude bands.
Interesting.
Why not include 2017?
Because Roy Spencer’s record for december 2017 wasn’t ready yet.
Bindidon – ‘far more maxims in 97/98 than 15/16.’ but doesn’t that have to do with simple maths. The average global temperature was .4*C lower in 97/98 than in 15/16. What would your chart look like if you added that same difference of +.4*C to the 15/16 anomalies. To a layman your graph seems to show that the El Nino of 15/16 was simply not as strong, even tho it went to a higher anomaly, as the 97/98 El Nino.
But… this is exactly what I wanted to show. Not less, not more.
Simply because many people don’t believe that.
Let me add that a comparison of five ENSO indices made at the end of 2016 shows the same:
http://4GP.ME/bbtc/1515178196789.jpg
oh, okay. Misunderstood. As Roseanne Roseannadanna would say … ‘nevermind’
Yessah
Didn’t quite get what you did there, Bin.
Was it: summing the number of ‘highest ever’ anomalies over cells and summing the number of ‘lowest ever’ over cells per year?
I could see how this might produce a different result to the regular method, in that the actual value of each highest and lowest ever anomaly for each cell is ignored. Thus, 2016 could have fewer ‘highest ever’, but those that were higher were much higher than in 1998.
Did I understand it correctly?
barry on January 5, 2018 at 5:34 PM
Was it: summing the number of ‘highest ever’ anomalies over cells and summing the number of ‘lowest ever’ over cells per year?
Not quite.
1. Search for each cell its highest evah year resp. lowest evah year over the entire temperature time series.
2. Then sum up the highs resp. lows over the years.
3. The yellow bars then are for each year the difference between highest evah and lowest evah counts, just like in Appells chart somewhere in another thread (with the difference that (1) I have neither tmax nor tmin records for UAH, and (2) UAH’s tavg record is monthly and not daily.
A possible alternative would be to add for each year the cells’ highs and lows, instead of simply counting them.
LouMaytrees on January 4, 2018 at 4:54 PM
The UAH graph you are referring to is of the ‘lower troposphere’ not of global land temperatures. The troposphere averages 11 12 miles high, so you ‘re talking about temperatures 6 miles above the surface on average. The global land surface, not measured by UAH lower trop, is warming faster.
There is indeed no reason at all to pretend that tropospheric temperature measurements would be by definition relevant for surface. Who pretends that is a troll.
A way to tell us all where UAH’s LT temperature average measurement takes place is to consider UAH’s absolute temperatures and the lapse rate alltogether.
The average absolute temperature valid for a year in any of the 4 atmospheric layers surveyed can be reconstructed out of UAH’s climatology file of that layer, e.g. for LT:
https://www.nsstc.uah.edu/data/msu/v6.0/tlt/tltmonacg_6.0
Actually, the LT average absolute temperature is around 264K, 24 K below the average surface temperature of about 288 C.
The lapse rate is about 6.5 K / altitude km.
That gives us an average measurement altitude of 3.7 km, i.e. about 650 hPa atmospheric pressure.
A comparison of UAH6.0 LT and RSS4.0 LT with e.g. the RATPAC B radiosondes measurement at resp. 700 and 500 hPa gives a good match when looking at their 36 month running means:
http://4GP.ME/bbtc/1515198288889.jpg
Nota bene: it is of course mandatory to compare not only surfaces but also RATPAC B with the land-masked TLT measurements because the RATPAC set has 70% land-based units, the remaining 30% being based on little islands.
As you can see, though linear estimates vary by quite a lot (RSS4.0 LT land is by far highest, especially due to very low anomalies in the 1980’s), the 36 month running means show us far better what differs and what is similar.
*
But for many people it might be a big surprise that a similar comparison of UAH and RSS with GISS (land)
http://4GP.ME/bbtc/1515198348218.jpg
gives such similar results. Maybe this is due to the fact that they are more or less victims of a manipulation.
The graphs presented here are no fake; they are an exact representation of data publicly available.
*
Nevertheless, though showing here and there similar, surface and lower troposphere are and keep two very different entities.
That we see even better when comparing land and ocean alltogether instead of land only.
Of course the 2nd 700 hPa in the title of the first graph should read 500 hPa instead.
binny…”The troposphere averages 11 12 miles high, so you re talking about temperatures 6 miles above the surface on average”.
Nonsense. I have just detailed below how channel 5 on satellite AMSU units measures at an altitude of 2000 metres peak with it’s bandwidth ranging right to the surface. If your interest is science you should refrain from making unsubstantiated claims about satellite telemetry.
binny…”There is indeed no reason at all to pretend that tropospheric temperature measurements would be by definition relevant for surface. Who pretends that is a troll”.
So, you’re claiming Roy is a troll???
http://www.barrettbellamyclimate.com/page55.htm
It’s plain from his description of the AMSU capabilities that channel 5 measures it’s peak at 2000 metres, not 6 miles.
You are becoming more of an idiot every day.
Gordon, do you actually read and understand the material that you link to. Obviously not.
The Bellamy reference is obsolete in one major respect, the aqua satellite channel 5 failed in 2013 and has not been used for UAH calculations of temperatures for several years.
Anyway channel 5 of aqua satellite measured predominantly from an altitude 4.25 km, not 2 km as you claimed,
see https://ghrc.nsstc.nasa.gov/amsutemps/.
Irrespective of this, UAH TLT v6 measures some radiation from the surface but measures more from the troposphere than the surface up till 7.5 km. It also has contributions up till 14 km, see
http://www.drroyspencer.com/wp-content/uploads/MSU2-vs-LT23-vs-LT.gif
The figure often quoted, I seem to recall, for the UAH v6 TLT average height is about 4.5 km.
As Gordon claims he has mathematical expertise with regards to weighting, he should be able to calculate the percentage of the radiation emitted from the surface as compared to that from the troposphere.
Hint, integral calculus may be required.
miker…”Gordon, do you actually read and understand the material that you link to. Obviously not”.
I might ask the same question of you. The article at Bellamy is by Roy Spencer and it’s not obsolete.
I have studied bandwidth extensively with regard to amplifiers and communications circuits. The weighting graph makes it obvious that different channels cover different altitudes. The peak of channel 5 corresponds to 2000 metres, not 4 KM.
The atmosphere obviously has a gradient of temperatures based on the related gas pressure. The oxygen molecules at each level of the gradient would be expected to emit radiation frequencies based at the expected temperatures at those altitudes.
If you wanted to detect surface temperatures, where would you go looking and what type of receiver would you use to detect the weak microwave radiation from oxygen? If you set your receiver to detect oxygen radiation at 4 km you’d get nothing.
Gordon,
Despite my link to UAH site above where it explicitly gives a figure of 4 km height for channel 5, you still think that the figure is actually 2 km. Let Roy Spencer know that he has got it wrong.
Elsewhere you can find the following,
Channel 5: Over land, this channel is sensitive to the average air temperature in a deep layer from the surface to about 11 km. in altitude (with most air sensitivity at about 4 km. altitude), and to a much lesser extent, surface temperature.
from
http://www.lmd.jussieu.fr/~falmd/TP/results_interpret_AMSU/ans_interp_AMSU.pdf
Also the maximum for channel 5 is between 3 to 4 km definitely not 2 km see figure 1 at the following –
http://journals.ametsoc.org/doi/full/10.1175/JTECH-D-13-00134.1
However even if you believe (evidence free) that the peak is at 2 km then the assumption that the weighted average corresponds to the peak is only true if the weights are symmetrical around the peak.
Gordon, as a self-professed expert on weighting, you do understand this, I hope?
By the way the Bellamy link hat you referred shows that channel 5 has a peak at 600 to 700 mbar (corresponding to about 4 km). Again I have to assume you cannot read or have very poor eyesight.
As for detecting surface emission you would use channels 1,2 and 25 as they are not oxygen emission sensitive channels. Unfortunately using these channels appears to not be practical because the emissivity assumptions required for different terrains, vegetation and snow cover etc.. .
This is also explained in the Bellamy article (just below the figure showing the weighting profiles).
Gordon , remember Golden Rule number 1 – Read the article before you link to it .
You Robertson troll name me (and others) an idiot (you even named me an ass hole (but were to much a coward to write the word explicitly).
But you are simply unable to read documents.
If you were able to, you would have easily detected that my comment was an answer to somebody, and consisted of two parts:
– the one beginning with
LouMaytrees on January 4, 2018 at 4:54 PM
and written in italic font was a copy of the comment I answered to;
– the rest being mine.
Your are manifestly not intelligent enough to discover even such a simple difference.
Everybody writing here hopes one day you will retire from this site, thus his/her comments stopping to be wasted by your dumb nonsense.
But above that difference, you are so unexperienced with all the stuff discussed here that you weren’t able to understand my comment’s central point concerning the estimation of UAH’s reading altitude.
barry…”Weve even cited UAH and RSS documents saying that this is not so, and verifying that the TLT temp profile is derived from the whole troposphere, weighted at about 4km altitude.
Its hard to fathom such pig-headedness in the face of information coming from source. But the lesson is clear: GR has no idea”.
More abject ignorance from Down Under.
I have provided you with 2 direct quotes after you have called me a liar, When my quotes directly contradicted you, rather than having the class to apologize, you flew off on a tangent with your reply having nothing to do with your error.
Here you are in error again. Direct from Roy:
http://www.barrettbellamyclimate.com/page55.htm
It is apparent from Roy’s description of satellite telemetry, that Channel 5 not only measures to the surface, it actually measures microwave radiation from the surface.
Just as you have no idea how to apply statistics rather than using base number crunching, you fail to understand the concept of weighting. That’s because you have no idea about bandwidth or how instruments measure bandwidth.
It’s obvious from Roy’s graph on weighting that channel 5 measures it’s range of frequencies best at around 800 hPa. Note that sea level is indicated as 1000 hPa and since 1hPa = 100 Pascals, that’s 100000 Pascals, or 100 kPa. Average sea level pressure is 101.325 kPa.
800 hPa = 80,000 Pascals or 80 kPa. That corresponds to an altitude of 2000 metres, not 4 miles or km. Bandwidth is normally calculated at 0.707 of the peak value, so channel 5 intercepts the surface well within it’s bandwidth, and as Roy points out, it also intercepts direct microwave radiation from the surface.
You can see that several channels intercept the bandwidth of channel 5 therefore the amount they add to the signal needs to be filtered out, or compensated for. That’s where you weighting comes in. It has nothing to do with pegging the temperatures measured to 4 km.
This all comes down to how atoms emit and absorb energy (EM). The frequency they radiate is proportional to the temperature of the atom. All the frequencies they can radiate, and the related intensities forms a bandwidth with a related bell curve shaped graph.
Of course you spent countless hours engaging in a pointless discussion of blue plates and green plates put forward by Eli Rabbett, who fails to grasp how atoms work vis a vis their ability to emit and absorb EM. He actually thinks the IR emitted is heat. He was corrected by two scientists who specialize in thermodynamics yet he still fails to grasp the very basic concept that EM is not heat.
You’re wrong Gordon; see what Roy wrote here about measuring surface temperatures by satellite:
http://www.drroyspencer.com/2018/01/uah-global-temperature-update-for-december-2017-0-41-deg-c/#comment-279417
I short, surface emissivity varies too much to make the calculation possible.
(Thanks Bindidon.)
DA…”see what Roy wrote here about measuring surface temperatures by satellite:”
I have no interest in the measurement of ground surface temps only the average atmospheric temps above the surface, which the sats pick up on channel 5.
is just an example of the tremendous confusion in above post !
1) What is measured is the intensity (technically the radiance) of microwaves at a specific frequency (channel) selected in the band around 60 Gz that is emitted by the oxygen molecule as opposed to atom.
2) What is proportional to temperature is the intensity (radiance) of the radiation emitted at a specific frequency (or in a specific channel) and of course by no means the frequency itself which is independent of temperature.
3) All the microwave frequencies emitted by O2 form actually a complex band whose shape is depicted here:
https://mobile.twitter.com/monkeybrainsnet/status/766018248655503360
4) The shape of this complex band is not to be confused with the weight functions of different channels. The former is the specific absorp-tion coefficient of O2 versus frequency and the latter are the weight of atmospheric layer temperature sampled at a given frequency (channel) versus pressure or altitude. Weight function is determined by the magnitude of the absorp-tion coefficient and optical depth at a specific frequency (channel).
https://infogalactic.com/info/Satellite_temperature_measurements#Tropospheric_and_stratospheric_measurements
gamma…”What is measured is the intensity (technically the radiance) of microwaves at a specific frequency (channel) selected in the band around 60 Gz that is emitted by the oxygen molecule as opposed to atom”.
A molecule as opposed to an atom??? What exactly do you think constitutes a molecule? A molecule is two or more atoms joined by bonds. The bonds are electrons, or due to electrons (ionic bonds) therefore molecules are an aggregation of protons and electrons.
Did you not study this in physics or chemistry? Any emission of a molecule is due to the same emission in an atom, the electron. Only electrons can emit electromagnetic energy, which includes IR. Electrons have a negative charge and that means they carry an electric field. An electric field in motion generates a perpendicular magnetic field.
EM = an electric field perpendicular to a magnetic field. Are there any lights going on???
Whether you are talking a vibrational molecular source of the EM, a rotational source, or translational source, the emission is all based on electrons. The electrons cause the vibration, rotation, or translation in conjunction with the positively charged proton in the atomic nucleus. The electrons cause any dipole distortion because the dipole is the electron(s).
The frequency of the EM radiation is directly proportional to the temperature of the atom which in turn is proportional to the energy level through which an electron drops to the next lower energy level. Read Neils Bohr!!!
It’s little wonder you alarmists are so thoroughly confused about basic physics.
Gordon wrote:
“Any emission of a molecule is due to the same emission in an atom, the electron.”
Wrong. You’d know this if you ever studied quantum mechanics.
PS: The Bohr Model is not QM.
DA…”Gordon wrote:
Any emission of a molecule is due to the same emission in an atom, the electron.
Wrong. Youd know this if you ever studied quantum mechanics.
PS: The Bohr Model is not QM”.
************
The Bohr model was corroborated for hydrogen by Schrodinger who is considered the father of quantum theory per se. Bohr went on to take Schrodinger’s theories into the nether world, divorcing himself from Einstein and Scrodinger. Bohr is now considered the instigator of modern quantum theory.
Quantum theory is all about the Bohr model. The basis of quantum theory is the wave equation as applied by Schrodinger. He applied it to the Bohr model of hydrogen.
However, Schrodinger remained true to Newtonian physics from whence came the wave equation. He maintained there has to be a reality represented by QM. Bohr did not agree.
The basis of QM is that electrons orbit a nucleus with harmonic motion based on the electron charge. That’s why Schrodinger was able to apply the wave equation, which requires harmonic motion.
Whatever did you think QM was about?
Gordon Robertson wrote:
“Quantum theory is all about the Bohr model.”
Wrong wrong wrong wrong wrong.
The Bohr model is wrong. It makes incorrect predictions (like for the angular momentum of the electron):
https://quantummechanics.ucsd.edu/ph130a/130_notes/node52.html
The Bohr model also doesn’t explain the hyperfine spectrum of hydrogen — because it has no concept of spin. For that you need real quantum mechanics.
The Bohr model was a great and necessary first step, but it was/is wrong and just the beginning of quantum theory. If it is the sum total of your knowledge (and it seems to be), you know practically nothing about atoms and molecules.
And it shows.
Sorry Gordon, so I think you did not verify the Bohr model for hydrogen. The Bohr model does not get the angular momentum of hydrogens ground state electron correct; the Schrodinger equation does.
gamma…it is not helpful at the atomic level to think of molecules as separate entities.
Consider, for example, a single hydrogen atom with one electron orbiting 1 proton in the nucleus. I am not claiming the Bohr model is correct, no one really knows if electrons are particles orbiting a positively charged nucleus. However, this model is presented in chemistry as representing atoms.
Bohr presented the model with electrons confined to certain orbitals, not to show a physical representation of an atom but to account for Planck’s quantum energy states. The only way he saw electrons orbiting a nucleus was with them restricted to certain energy orbitals. Some scientists like Einstein could not accept electrons jumping from one energy level to another without going through a transition state with a time element.
If you now bond two hydrogen atoms together, the electrons theoretically begin orbiting both atoms. Of course, the orbits will become more irrational the more protons you have in the nucleus and the more electrons orbiting the nucleus as you have in different elements.
Supposing in a more complex arrangement of atoms in a molecule one of the orbiting electrons absorbs a quantum of energy and rises to a higher orbital state. Suppose that electron is part of a dipole arrangement in CO2, with C at the centre and an O on either end.
O====C====O
Those dashed lines are electrons bonding the Os to the C. The Os can vibrate along the linear axis in two ways. Both Os can expand and contract together or one O can go out as the other moves in. In the latter case, you can have EM emission capabilities. You can also have emission if the Os tend to rotate about the C (a moment).
All of this depends on the electron charge. That’s a molecule I drew above and as you can see it involves the +ve proton charges on the O and C nuclei and the -ve charges on the bonding electrons.
Only the electron can emit EM since it is the only charge that moves significantly. Furthermore, the electron has a charge and an electric and magnetic field associated with it. When the electron jumps down an energy level, or more, somehow it emits EM and cools.
That’s what the Stefan-Bolzmann equation measures, the cooling of atoms. The associated temperature in the emitting body is due to the state of electron energy levels in general.
The energy of molecules is quantized. The molecule can absorb or emailed energy by transitioning from one quantum state to another. That need not have anything to do with electrons a change in angle between three molecules will do it, achange in the vibrational state will do it etc.
You clearly never studie quantum mechanics, and wont even read a Wikipedia page. Youre beyond hopeless, and have no shame with lying. You are excellent example of the Dunning Kruger effect, The best time ever encountered.
DA…”That need not have anything to do with electrons a change in angle between three molecules will do it, achange in the vibrational state will do it etc.”
So where does the EM emission come from just because of a change in angle? Still don’t get it do you…from electrons?
The bond angle is due to repulsion between electrons.
Atoms and molecules are arrangements of +vely charged protons on the nucleus and -vely charged electrons orbiting the nucleii. All bond angles and linear arrangements are due to electron charge or electronegativity. Some are due to lesser forces like van der Waal forces but even those are dependent on the -ve charges from the electrons.
You can’t get away from it DA, electrons are responsible for all EM in the universe.
Gordon Robertson wrote:
So where does the EM emission come from just because of a change in angle?
It comes from a change in the molecular energy level.
The energy levels are quantized. A transition from one quantum level to a lower one leads to the emission of a photon.
Einstein certainly accepted the idea of quantum energy transitions. In fact, his A and B coefficients were important additions to their understanding.
Still wrong, Gordon. Actually, electrons in and atom dont move, they exist in a probability distribution about the nucleus. But in molecules like CO2, the oxygen atoms really do vibrate relative to the carbon atom. The molecule also rotates. These vibrations and rotations are quantized, and a transition from one state to another involves absorbing or emitting photons.
There sure is a lot you dont understand about quantum mechanics. Nothing, really, after the Bohr atom.
Gordon Robertson wrote:
The frequency of the EM radiation is directly proportional to the temperature of the atom which in turn is proportional to the energy level through which an electron drops to the next lower energy level.
Also wrong. (And Niels Bohr never said this.)
Temperature is the average kinetic energy of a gas of molecules, independent of the molecules’ internal structure.
I’d like to see you tell us the quantitative relationship between EM radiation and an atom’s “temperature.”
(What is an atom’s temperature, anyway? Define it.)
Some trolls will never learn more than they were able to do decades ago. The brain says:
Stop boring me with that new stuff! I swallowed enough.
https://en.wikipedia.org/wiki/Emission_spectrum#Radiation_from_molecules
http://tinyurl.com/yd9j79rj
etc etc etc
binny…from your wiki link…”Radiation from molecules
As well as the electronic transitions discussed above, the energy of a molecule can also change via rotational, vibrational, and vibronic (combined vibrational and electronic) transitions. These energy transitions often lead to closely spaced groups of many different spectral lines, known as spectral bands. Unresolved band spectra may appear as a spectral continuum”.
Any idiot can write a wiki article but this article is actually confirming what I have claimed. It is you and your alarmist brethern who don’t understand the structure of an atom or molecule hence have deluded yourself into thinking molecules have separate EM generators.
When you study electronics or organic chemistry you go through this elementary atomic physics. There is no point in chemistry in talking about bonds without understanding what constitutes a bond. Therefore there is no point talking about molecules as separate from atoms unless you understand that atoms are run by the +ve and -ve charges of protons and electrons and that bonds are made of electron orbitals.
The vibrational states referred to at your link are states in which the bond lengths between atoms in a molecule change in harmonic motion in a rectilinear fashion. The bonds can also vibrate in an angular manner due to difference in charge states between atoms at either end of a bond (dipole). Those charge state differences are all due to electron charges whereas the rectilinear vibration is due to the interaction of electrons in orbits with the positive charge of the protons in the nucleus.
Rotational vibration is a property of a linear molecule which has been struck by another atom/molecule in a gas that causes the molecule to rotate. Again, the emission of EM is due to the rotation of the electron charges.
Translational vibration would be due to electrons changing in the orbital energy levels. With regard to molecules that would refer to translational vibrations within a molecular structure caused by a shift in charge as the electrons loose energy and drop to a lower energy level. That translates as well to a loss of heat and the emission of a quanta of EM.
Just because two or more atoms are bonded into a molecule does not mean the atoms stop behaving like atoms. It means the orbital interactions of the electrons with the atoms becomes far more complicated.
Gordon, you’re wrong…. but a more interesting question is, where does your obstreperousness come from? What are you trying to accomplish with it?
DA…”Gordon, youre wrong. but a more interesting question is, where does your obstreperousness come from? What are you trying to accomplish with it?”
The fact that you cannot claim anything more than I am wrong suggests strongly you are in over your head. I might ask why you are in such deep denial about the basics of atomic theory.
I have studied this stuff over and over in various electronic and electrical theory courses as well as in university level electrical engineering courses. I have also studied it in chemistry courses, especially organic chemistry.
The fact you don’t know even the basics suggests you have never gone beyond pre high school physics.
Gordon Robertson
Quit pretending that you studied anything of value. You make up stuff that is all you know how to do. You read a couple words about atoms and you are the smartest man alive. You know that atoms are made of electrons, protons and neutrons. Do you want all the posters to stand up and give you a standing ovation for you super mind to know this?
Yet you are unable to understand even simple ideas about molecules and atoms. You are a dribbling moron with your idiotic notions that Mid-IR is emitted by electronic transitions. I have linked you many times to material that clearly states you are wrong. You ignore it like the pretender you are. You are almost as dumb as g*e*r*a*n but not quite there yet. If I keep reading your stupid posts on your limited understanding of IR emission I might put you at the same low IQ I know g*e*r*a*n has.
Wake up in 2018 and quit being the idiot of the blog. Read some real science and learn that you know very little and then less.
Gordon Robertson says:
The fact that you cannot claim anything more than I am wrong suggests strongly you are in over your head. I might ask why you are in such deep denial about the basics of atomic theory.
I’ve told you many times before — your ignore molecular vibrational and rotational energy transitions.
Your hero Linus Pauling would find that ridiculous.
I have studied this stuff over and over in various electronic and electrical theory courses as well as in university level electrical engineering courses. I have also studied it in chemistry courses, especially organic chemistry.
What a shame that all that studying never lead to much learning.
Read these:
https://en.wikipedia.org/wiki/Rotational%E2%80%93vibrational_spectroscopy
http://www.wag.caltech.edu/home/jang/genchem/infrared.htm
http://users.physik.fu-berlin.de/~essenber/Dateien/VersucheChemie/rotvib.pdf
The con-man is trying to ignore me, but he can’t pound out more than a few lines without mentioning me.
It’s fun to watch.
gamma…”What is measured is the intensity (technically the radiance) of microwaves at a specific frequency (channel) selected in the band around 60 Gz….”
Then why are they interested in a 60 GHz band? They are measuring brightness temperature not intensity. From wiki:
https://en.wikipedia.org/wiki/Brightness_temperature
“Brightness temperature is the temperature a black body in thermal equilibrium with its surroundings would have to be to duplicate the observed intensity of a grey body object at a frequency ν”.
It’s about frequency, not intensity. It tells you in the article that the overall microwave intensity is very weak and requires amplification.
I have not seen specific information about AMSU telemetry but I imagine from year in electronics that the channels refer to amplifiers. I saw reference to heterodyning which means the overall frequency spectrum is converted down to a manageable frequency for processing.
Modern radio receivers are called super-heteordyne converters since they take in a radio signal at a high frequency and convert it down to a manageable intermediate frequency for processing. That suggests the channels refer to amplifiers with a specific frequency response/bandwidth.
Why would they have amplifiers with a broad bandwidth if they were not detecting a range of frequencies per channel? And why would they require several channels? If it was only intensity they were measuring they could not distinguish between the frequencies received by the different channels.
gamma…”All the microwave frequencies emitted by O2 form actually a complex band whose shape is depicted here:”
yes…’complex band’ refers to a continuum of frequencies. However, the graph to which you link shows the absorp-tion of RF. Reference to a 60 GHz band, for example, means there is a continuum of radiated frequencies with the centre at 60 GHz. That’s what ‘band’ means with reference to frequencies.
gamma…”Weight function is determined by the magnitude of the absorp-tion coefficient and optical depth at a specific frequency (channel)”.
Roy describes weighting as: “The vertical profiles of each channels relative sensitivity to temperature (weighting functions) are shown in the following plot:”
It stands to reason that each channel is tuned to the expected temperature at a specific altitude. That temperature is predetermined by gravity since the pressure gradient in a system with constant volume and mass should be directly proportional to temperature.
Table 1 at this link shows the frequencies to which each channel is tuned.
https://en.wikipedia.org/wiki/Advanced_microwave_sounding_unit
Barry,
“Thanks. Do you have a link for this?”
https://www.nps.gov/kefj/learn/nature/upload/The%20Retreat%20of%20Exit%20Glacier.pdf
And from Dr. Roy: “The fact that receding glaciers in Alaska are revealing stumps from ancient forests that grew 1,000 to 2,000 years ago proves that climate varies naturally, and glaciers advance and recede without any help from humans.”
http://www.drroyspencer.com/2017/08/an-inconvenient-deception-how-al-gore-distorts-climate-science-and-energy-policy/
When the spruce turn to juniper, you’ll be getting close to the end of the lia. Then a couple hundred years at least until they re establish. Although maybe there are viable pine cones left to speed recovery along? Definately a you shall not pass moment. Do you see the size of that stump in the link? That’s a behemoth. The spruce in Seward are the biggest trees I’ve seen in AK save for the occasional poplar.
https://tinyurl.com/ycdup7fy:
“The most recent stumps emerging from the Mendenhall are between 1,400 and 1,200 years old. The oldest are around 2,350 years old.”
That’s more like the Roman warm period if you allow some time for the glacier (and forest) to grow.
The glacier is way off equilibrium, so we are likely to shoot past the RWP/MWP quickly.
Discussed here: https://tinyurl.com/ycr3sesv
And from Dr. Roy: The fact that receding glaciers in Alaska are revealing stumps from ancient forests that grew 1,000 to 2,000 years ago proves that climate varies naturally, and glaciers advance and recede without any help from humans.
That statement might be true for some local glaciers, but it is not true globally. Global glacier mass balance has been in steady decline for 50 years:
https://en.wikipedia.org/wiki/Glacier_mass_balance#/media/File:Glacier_Mass_Balance.png
Thanks for the links, Darwin.
“The fact that receding glaciers in Alaska are revealing stumps from ancient forests that grew 1,000 to 2,000 years ago proves that climate varies naturally, and glaciers advance and recede without any help from humans.”
Glaciers advance and recede without human activity helping things along? Well blow me down.
Apparently Roy (and you think some people don’t believe climate can change naturally. Where does one get such crazy ideas?
So there was a forest in 1170 in Seward and a glacier covered it afterwards until recently. Maybe Seward was warmer then than during the 20th century.
Afraid this doesn’t mean much re global warming. Highly localised areas aren’t a proxy for global.
Sorry Barry but I’ve been hearing Alaska is the canary in the coal mine forever. Now when it’s proven it’s been as warm or warmer for longer here during last warning periods its meaningless?
(Past warming) not last warning) although seeing you use the f word down thread you might be on that too.
Wait for it, wait for it…
“Alaska, of course, being the only Arctic part of the U.S. it’s often referred to as polar amplification, that climate is warming much more rapidly at high latitudes,” Thoman said. “We are the U.S.’s canary in that coal mine.”
https://www.adn.com/alaska-news/weather/2018/01/08/alaska-just-had-its-warmest-december-on-record/
And again, that glacier will not stop receding if warming stops because of its inertia.
A decisive portion of Roy Spencer’s article at Bellamy
http://www.barrettbellamyclimate.com/page55.htm
For those channels whose weighting functions intersect the surface, a portion of the total measured microwave thermal emission signal comes from the surface.
AMSU channels 1, 2, and 15 are considered ‘window’ channels because the atmosphere is essentially clear, so virtually all of the measured microwave radiation comes from the surface.
While this sounds like a good way to measure surface temperature, it turns out that the microwave ’emissivity’ of the surface (its ability to emit microwave energy) is so variable that it is difficult to accurately measure surface temperatures using such measurements.
The variable emissivity problem is the smallest for well-vegetated surfaces, and largest for snow-covered surfaces.
While the microwave emissivity of the ocean surfaces around 50 GHz is more stable, it just happens to have a temperature dependence which almost exactly cancels out any sensitivity to surface temperature.
Nice find. Thanks.
A really nice info!
Over 100 C difference between Siberia and Australia…
https://www.wetteronline.de/wetterticker?postId=post_201801067801096
A first info about OLS trends for each of the 9504 cells in the UAH 2.5 degree grid data set during 1979-2017 (in C / century)
5 Highest trends in the Northern Hemisphere
1: 80.0N-82.5N 65.0E-67.5E | 4.84
2: 80.0N-82.5N 67.5E-70.0E | 4.79
3: 80.0N-82.5N 72.5E-75.0E | 4.76
4: 80.0N-82.5N 50.0W-47.5W | 4.75
5: 80.0N-82.5N 70.0E-72.5E | 4.74
5 Lowest trends in the Northern Hemisphere
8981: 47.5N-50.0N 30.0W-27.5W | -0.47
8997: 50.0N-52.5N 30.0W-27.5W | -0.48
8999: 47.5N-50.0N 32.5W-30.0W | -0.48
9003: 50.0N-52.5N 35.0W-32.5W | -0.49
9026: 50.0N-52.5N 32.5W-30.0W | -0.52
5 Lowest trends in the Southern Hemisphere
9500: 80.0S-77.5S 157.5E-160.0E | -2.23
9501: 75.0S-72.5S 157.5E-160.0E | -2.36
9502: 75.0S-72.5S 160.0E-162.5E | -2.50
9503: 75.0S-72.5S 165.0E-167.5E | -2.63
9504: 75.0S-72.5S 162.5E-165.0E | -2.72
5 Highest trends in the Southern Hemisphere
38: 77.5S-75.0S 35.0E-37.5E | 4.45
48: 77.5S-75.0S 37.5E-40.0E | 4.36
56: 77.5S-75.0S 32.5E-35.0E | 4.31
95: 75.0S-72.5S 32.5E-35.0E | 4.14
130: 75.0S-72.5S 35.0E-37.5E | 4.01
Have some fun in discovering the locations!
In comparison with the same kind of data computed last year, the average over all 9504 cell trends experienced an increase of about 2.5 %.
Tomorrow I’ll produce a graph showing the trend repartition over all UAH latitude bands from 80.0N-82.5N to 80.0S-82.5S
Using e.g. https://www.findlatitudeandlongitude.com/
Bin, keep searching for that illusive AGW.
Maybe it’s hiding behind all the new record snows?
Hilarious.
DA: “Global glacier mass balance has been in steady decline for 50 years:”
Steady? Shouldn’t it be receding exponentially faster as aco2 goes up? Granted CO2 is below natural climate variability but we should still see vastly increased receding as opposed to steady?
I realize this is cherry picking but Exit glacier receded fastest 100 years ago and has slowed in the last 50 years. In fact, it doesn’t appear to have receded at all since I was there years ago.
“In the years between 1914 and 1917, Exit Glacier experienced its most rapid retreat. In just 3 years, the glacier retreated 908 ft”
And obviously all glaciers receded much further than now during past warming periods and without any help from human activity. It’s been as warm or warmer than now and for longer just in the current interglacial period. We have a ways to go. But get back to us when the trees (where there are currently glaciers) are full grown again okay?
aCO2 is increasing exponentially, and its forcing goes Logarithmically with CO2. The net result is a linear forcing.
But if you look at that Wikipedia graph, the decline in global glacier mass balance is faster than Linear.
davie, I hope you are not applying for jobs that require a knowledge of science.
Stick with menial jobs, like sweeping floors.
Do you know how to wash dishes?
g*r…”Do you know how to wash dishes?”
His degree in Home Economics might come in useful there. It may now be knows as family and consumer science. Then again, they probably study basic atomic theory there as well.
darwin…re glaciers…here’s a general comment on AGW from Syun Akasofu. He is a well known astronomer having pioneered studies in the solar wind. More recently he has lived in Alaska and studied local glaciers.
http://people.iarc.uaf.edu/~sakasofu/misleading.php
He has theorized that warming since 1850 is actually a re-warming from the Little Ice Age.
Another:
http://people.iarc.uaf.edu/~sakasofu/passionate_subject.php
Touches on the LIA and the Arctic:
http://www.larouchepub.com/other/interviews/2007/3419dr_akasofu.html
In this one, a journal editor resigns due to an Akasofu paper. Akasofu is a prominent scientist and such a resignation proves the bias in modern journals to skepticism.
https://wattsupwiththat.com/2013/09/09/syun-akasofus-work-provokes-journal-resignation/
So much for David Appell hounding people for peer reviewed proof. I tried to tell him peer review is rigged.
Gordon again calls fraud (“rigged”) because journals publish papers that disagree with his ideology.
It can never be that Gordon is wrong — it always has to be the entire rest of the world that is wrong (and throughout history, too).
PS: You didn’t link to anything peer reviewed.
Wow, looks like great info Gordon, thank you. Not positive but I think he was the guy who announced glaciers grew in 2008.
Some of the merry tribe like to track data. Our hilarious “science writer”, davie, likes to stalk Salvatore, for example.
So, here is the tribe (most flagrant violators of facts and logic), not in any order:
1) davie
2) Norm, the con-man
3) T-ball, aka “ball4”, aka, “trick”, aka “cabbage head”
4) miker
5) barry
6) Tim Folkerts
7) Brad
8) Skeptic Gone Wild
9) gummycrud
10) snake, aka “snape”, aka “Sir Isaac Snapelton”, aka “the 12-year-old”
11) Kristian
12) Nate, aka “flat tires”
I know I have missed some minor contributors. Please feel free to enter your name if I left you out.
Now, for the prevailing pseudoscience, going into 2018.
1) Putting on a sweater proves “cold” can warm “hot”.
2) The Sun can heat Earth to 800,000K.
3) C02 produces warming.
4) A horse running around an oval track is also rotating on its axis.
5) Cabbages glow in the dark.
6) C02 is a pollutant.
7) The Earth is warming the Sun.
8) ALL infrared is ALWAYS absorbed.
I may have forgotten some of the hilarious pseudoscience. All are welcome to add.
2018 is going to be a great year in climate comedy. Maybe Bin could keep track for us?
g*r…”Now, for the prevailing pseudoscience, going into 2018″.
You might add to the list the following:
7)atoms are not made up of electrons and protons therefore molecules are not either.
8)the Bohr atomic model has nothing to do with quantum theory.
9)heat can flow from a cold body to a warmer body. I know you covered that with the Earth warming the Sun.
10)heat is not real.
How about: throwing out 75% of your data and synthesizing the missing data in a climate model is OK. Especially, when you make sure to throw out the cold data and keep the warm data.
Good ones, Gordon.
Yes, all are welcome to contribute to the list. It should be fun to document the desperate pseudoscience.
g*e*r*a*n
It would be nice if you could quit trolling.
On your list the main names that should appear “So, here is the tribe (most flagrant violators of facts and logic), not in any order:
1) g*e*r*a*n: Well known to NEVER include actual science in any of his posts. Repeat false ideas in hope they become true to some. Does not understand even simple basic science. Fools no one but pretends he is brilliant. Master of pseudoscience and his make believe reality.
2) Gordon Robertson: Well known to accuse many scientists of lying even when he is incapable of understanding what they are saying or what they are doing. Many have tried to educate this one but his mind is a brick and delusional. Will only take in information that agrees with his delusions.
3) J Halp-less: Known to have no original thought process but will sit and listen to all the empty words vomiting out of g*e*r*a*n’s dark mind.
Now, for the prevailing proof g*e*r*a*n is an idiot with very limited reasoning ability.
1) Putting on a sweater proves cold can warm hot.
:The sweater is cold the body becomes warmer.
2) The Sun can heat Earth to 800,000K.
: IF the Earth would lose no energy. Never meant to be a real
point. Only an idiot could not understand the purpose to the
thought, oh yes I forgot we are talking about g*e*r*a*n.
3) C02 produces warming.
: No context, no meaning.
4) A horse running around an oval track is also rotating on its axis.
: If a horse did not rotate as it moves around an oval track,
rotation caused by how the horse plants its hoofs and creates
the rotation around its axis, it would run right off the
course. It must rotate to move around the track. g*e*r*a*n
demonstrates his completely idiocy with this logic. Only one
other agreed with him, his lapdog J Halp-less.
5) Cabbages glow in the dark.
: They do in the Infrared spectrum
6) C02 is a pollutant.
: Could be if the concentration is high enough
7) The Earth is warming the Sun.
8) ALL infrared is ALWAYS absorbed.
: If an object is a blackbody this would be correct. The amount
absorbed is based upon it emissivity.
You are a moron g*e*r*a*n and your list proves it.
The con-man waffles, spins, and equivocates.
Hilarious.
For 2018, here is a simple 4-step demonstration even an amoeba would understand:
1. Pierce an object with a round toothpick. Grasp the toothpick between your fingers and twirl the toothpick. What you observe is call rotation. The object is rotating or spinning about the axis of the toothpick.
2. Now take that same toothpick and object and make a a circular orbit about some point on your desk or a table (but don’t spin or twirl the toothpick in your fingers) This motion is called an orbit.
3. Now this demonstration is tricky for those sub-amoeba types who have less than one cell in their body. Perform the orbit as described above, but at the same time rotate the toothpick between your fingers. The object is doing two things (Noooooo!) It is performing an orbit, and it is rotating about its axis.
4. Now this next facet of the demonstration is almost too much to bear for s*u*b*a*m*o*e*b*a*s. Mark one side of the object and have it face the center of orbit. Perform the demonstration in step 3 above, but rotate the toothpick slowly in your fingers so the marked side of the object always faces the center of orbit while making an orbit. So the object is spinning about its own axis while making the orbit.
s*u*b*a*m*o*e*b*a*s will not perform this demonstration since their less than one cell organism might self-destruct.
Still confused about “rotating on an axis” versus “orbiting”, huh?
I still recommend the simple orange/string demonstration. But, it may be a little too high-tech for some. ..
We all agree that the Earth both orbits *and* rotates on its axis. It orbits CCW around the sun once every 365.25 times that it rotates on its axis (which it also does CCW). So I guess the people who think that completion of one CCW orbit = one CCW axial rotation (as they do for the moon) must actually think that the Earth rotates on its axis 366.25 times each year.
https://en.m.wikipedia.org/wiki/Sidereal_time
“must actually think that the Earth rotates on its axis 366.25 times each year.”
Relative to what coordinate system? This is the whole point of the article. Did you read the article?
Relative to the stars, ie our galaxy, yes, the Earth rotates on its axis 366.25 times each year.
Yes Nate, I did read the article. Thank you.
And do you agree with “Relative to the stars, ie our galaxy, yes, the Earth rotates on its axis 366.25 times each year.”?
If so, then I dont understand your agreement with G*.
I can see why some people (mostly astronomers) might find it useful to think of it that way. Besides that, I just think its pretty funny. Just comes across like people cant separate an object orbiting from an object rotating on its axis. Either when the object is doing both (as with the Earth) or when the object is doing just one (as with the moon).
“I can see why some people (mostly astronomers) might find it useful to think of it that way. ”
It useful because it is correct and it is well defined.
“Doing just one (as with moon)”
No , if you specify an astronomical reference frame (ie wrt to stars) then the moon is rotating as well as orbiting.
As an aside it seems that only when things are rotating relative to the stars, is a centrifugal force effect seen. The stars act like an absolute ref frame for rotation.
https://en.wikipedia.org/wiki/Absolute_rotation
But whats even more correct and well-defined is that there are 365.25 days in a year, and the moon doesnt rotate on its axis, because its tidally locked.
Define ‘correct’ and ‘more correct’ please.
If you agreed the Earth, rel to stars had an extra rotation per year, then you must by logical extension, agree that the moon has made one rotation per orbit of the Earth, again rel to stars.
“more correct and well defined”
If you havent stated the ref frame, then it is not well defined.
So what is the ref frame in which ‘the moon doesnt rotate on its axis”?
I said that for some people, I can understand why its useful to look at it like that. For most people, treating their day as though it only lasted 23 hours and 56 minutes would lead to disastrous results, as the year went on. They would be late for an awful lot of things. Much better to realise that those extra four minutes each day are what complete a *true* and *full* rotation of the Earth on its axis, how would you put it…rel to itself.
It only really works for astronomers in the main, since its useful for tracking the position of stars, etc. Of course they still operate on a 24 hour clock, like everybody else. Though it might be fun if some of them really committed to it.
Ok, I guess.
IMO, since we are talking about an astronomical phenomena, orbit of the moon, we ought to follow the lead of astronomers.
And if we are talking about what is rotation, a science concept, then we ought to follow what scientists do, and that is to specify ref frame. And this is a science blog.
OK, I will follow the lead of astronomers, and continue to adhere to a 24 hour clock. If any of them switch over to living their lives on sidereal time, perhaps you can follow them.
skeptic…”Perform the orbit as described above, but at the same time rotate the toothpick between your fingers”.
How about turning the table at the same time?
Gordon,
Turning the table at the same time would just confuse the issue by adding another rotating reference frame.
Imagine performing my demonstration sitting at a table placed at the center of a merry-go-round. The rotation and orbit of the object will still happen with respect to the table I am sitting at, but the motions wrt to the non rotating reference frame will be complicated.
SkepticsGoneWild
I think that was the simplest, most elegant experiment I have seen with regards to this silly debate.
What are the chances Halp or g* will give it a go?
(I think you meant a round object, not a round toothpick)
Snape,
The object can be round. But by round toothpick, I meant the kind that has a round diameter:
https://tinyurl.com/y7u4m2jj
These kind are easier to twirl in your fingers, than the flat ones that have a rectangular cross section.
Snape, I already understand what SGW is explaining. Im guessing the point I made above sailed straight over your head. Oh well, your loss.
Halp
Go back to SGW’s toothpick model. Spin the object 365 times about it’s axis while you simultaneously move it just one time around a center point on the table. That’s the situation WRT the earth, and that’s NOT the situation we’re talking about!
You’re still very confused.
Yep, definitely went over your head. Never mind.
“What are the chances Halp or g* will give it a go?”
Zero. They will not perform it because they would have to deny what the observation clearly shows. This is not some thought experiment. They are both in denial.
Sorry about misunderstanding the round vs flat toothpick….lol.
BTW, I continued the argument downthread a little bit. Used part/most of your toothpick model again. If they still can’t figure it out, they never will.
Why would I need to figure out something I already understand?
The following is dedicated to the deranged and his sidekick.
Part 1
http://scienceline.ucsb.edu/getkey.php?key=2455 (note 6 answers for the price of 1) .
http://curious.astro.cornell.edu/about-us/44-our-solar-system/the-moon/general-questions/115-does-the-moon-rotate-beginner .
Part 2
https://www.space.com/24871-does-the-moon-rotate.html .
http://discovermagazine.com/2014/dec/2-ask-discover .
Part 3
https://www.youtube.com/watch?v=OZIB_leg75Q .
https://www.youtube.com/watch?v=VGnIuqYKnTE .
https://www.universetoday.com/20524/how-long-is-a-day-on-the-moon-1/
This was via a 5 minute google search. Can you imagine if I had spent an entire 10 minutes?
Does either Halpless or the deranged one have any link to where ever they got their misinformation, or is it their own work?
Poor MikeR, he just cant help himself. He *has* to respond. And, he just *has* to be unpleasant. Its OK though, he goes away eventually.
I apologise for the tone of my comment above that offended Halp but my tolerance of fools is limited.
Notice that Halp has not responded to my request for him to provide any evidence of where he obtained his understanding of lunar dynamics. If he would reply regarding this matter I would, of course, consider being more polite.
And yes, I will endeavour to go away as my new year’s resolution still stands, but it seems more honoured in the breach than in the observance.
Nothing to apologise for, I wasnt offended.
Halp, Excellent news! I can up the ante then.
Halp , you have avoided disclosing the origins of your shared delusion with that other deranged individual.
Once again, this time with feeling. Where did either of you come up with the novel take on lunar dynamics?
I have yet to check the all the information on the web site of the flat earth society at
https://theflatearthsociety.org/home/
or its associated Facebook page.
I do not normally frequent either of these sites but a cursory look indicates that there appear to be lots of lunar theories by lunatics. Is your very own just another of these or have you guys thought this up yourselves?
Finally Halp, for your delectation –
http://scienceblogs.com/startswithabang/2010/10/07/counterclockwise-but-there-are/
Thanks for all the links, but, again: why would I need to figure out something I already understand?
Halp,
In the dogged support of your fellow lunatic, you deserve a purple heart or at least a free psych evaluation.
Not only are you guys functionally innumerate but also illiterate and you can’t cope with material aimed at a junior high school level.
However in the vain hope that you can both read and understand, I am including another pair of links.
http://curious.astro.cornell.edu/physics/44-our-solar-system/the-moon/general-questions/110-does-the-moon-rotate-are-there-other-moons-that-always-keep-one-face-toward-their-planet-intermediate
https://www.scientificamerican.com/article/is-it-just-a-coincidence/
I am still looking for an explanation appropriate for a pre-school kiddie. I will keep you posted Halp if I find one.
I already understand, MikeR.
Unfortunately after a more exhaustive search, I couldn’t find something appropriate for Halp. I have only found several more links to material that require a minimum understanding at a junior high school level
I think I will have to give up on Halp as a lost cause.
By the way Halp, you still haven’t indicated the origins of the lunar theory. Is it just your colleague’s work or did you contribute your own insights?
I already understand. Though you can keep searching for more links if it keeps you entertained.
Difficult choice there Nate,
Halp-less and g*e*r*a*n vs. Scientific American and the Cornell University astronomy department, hmm?
Thankfully, theres no choice to make.
P.S: yes, it can be hard to distinguish between Nate and MikeR, sometimes.
Halp,
As you seem unable, or extremely reluctant to provide a citation for the origin of you lunar theory, I think is it safe to conclude that it is indeed your or perhaps your colleagues own work.
I urge you to publish immediately.
Your innovative ideas, if correct, will cause a revolution in our understanding of orbital dynamics as the moon will be the only body in the solar system among all the planets, hundreds of moons and thousands of asteroids that has zero rotational angular momentum about its axis. This has profound implications for the origin of the solar system and will also result in the abandonment of theories such as tidal locking.
Also human lives are at stake. If true, your ground breaking theory will prevent future astronauts from landing (or even crashing) into a landing place that could be diametrically opposite to the one chosen by that the NASA.
I hope you are right or we might see a disaster like this occurring –
http://www.gstatic.com/tv/thumb/dvdboxart/8932517/p8932517_d_v8_aa.jpg .
However those other misguided fools at Caltech, like those at Cornell, seem to disagree –
http://www.caltech.edu/news/looking-man-moon-4187
Maybe you are right and these idiots have got it all wrong.
However, it is intriguing that physicists at Caltech have got this years Nobel Prize Nobel Prize for Physics for their verification of gravitational waves and yet, they or their colleagues, cannot understand your lunar theory?
Maybe fire off a letter to the Physics departments at Caltech and Cornell etc. and outline your theory and await a response.
Halp,
I did find something more appropriate for you and is suitable for bedtime reading –
https://www.goodreads.com/book/show/2707216-the-moon .
One of the reviewers commented that their three and a half year old understood the material in this book.
Perhaps if you are a good child , eat all your dinner and don’t stay up too late glued to the internet, then maybe your mother could read it to you.
Pass it on to g* as well.
“hard to distinguish between Nate and MikeR, sometimes.”
Yes, both are in the sensible group.
Understand I, already. You can put that in the right order.
People who have been persuaded by G* arguments to change their views:
…
… Gordon (below), we have scored a hat trick again.
Gordon,
It is apparent from Roys description of satellite telemetry, that Channel 5 not only measures to the surface, it actually measures microwave radiation from the surface.
You provide this link:
http://www.barrettbellamyclimate.com/page55.htm
Roy writes:
For AMSU channel 5 that we use for tropospheric temperature monitoring, that brightness temperature is very close to the vertically-averaged temperature through a fairly deep layer of the atmosphere. The vertical profiles of each channels relative sensitivity to temperature (weighting functions) are shown in the following plot:
The plot shows channel 5 covering an altitude of about 10km+.
http://www.barrettbellamyclimate.com/userimages/UAH4.jpg
What else does Roy say?
AMSU channel 5 is used for our middle tropospheric temperature (MT) estimate; we use a weighted difference between the various view angles of channel 5 to probe lower in the atmosphere, which a fairly sharp weighting function which is for our lower-tropospheric (LT) temperature estimate.
Channel 5 includes surface emissions but can’t isolate them from the rest of the troposphere, though by combining view angles they get a profile with weighting at about 4km height.
AMSU channels 1, 2, and 15 are considered “window” channels because the atmosphere is essentially clear, so virtually all of the measured microwave radiation comes from the surface. While this sounds like a good way to measure surface temperature, it turns out that the microwave ’emissivity’ of the surface (its ability to emit microwave energy) is so variable that it is difficult to accurately measure surface temperatures using such measurements.</b.
MSUs can’t accurately measure surface radiance.
What does Roy’s latest paper say?
Average air temperature over relatively deep atmospheric layers can be monitored, with minimum cloud contamination, using passive microwave radiometers operating in the 50-60 GHz range
http://www.drroyspencer.com/wp-content/uploads/APJAS-2016-UAH-Version-6-Global-Satellite-Temperature-Products-for-blog-post.pdf
Another Spencer and Christy paper says:
A fundamental question often asked is: what do the channel 2T anomalies represent? First, let us address the deep layer nature of the measurement. The channel 2 weighting function is vertically broad… over a layer extending from the surface to 30kPa… Therefore MSU channel 2 measurements are dominated by the vertically weighted air temperature through a deep tropospheric layer of air … the satellite can only measure deep layer temperatures”
http://journals.ametsoc.org/doi/pdf/10.1175/1520-0442(1992)005%3C0847%3APARVOS%3E2.0.CO%3B2
(P 848)
Link is provided for you to read, “the satellite can only measure deep layer temperatures”.
Do you get that? From the horses mouth. Say you acknowledge.
More from Christy and Spencer.
Here T2LT represents the lowmiddle troposphere and is derived from a linear combination of 8 of the MSU channel 2 (MSU2) 11 view angles to remove stratospheric and upper-tropospheric emissions (Spencer and Christy 1992b). Note that T2LT differs from T2 in that the temperatures of the differing view angles in T2 data are not linearly combined to remove the stratosphere emissions [see section 2a(2)]. About 90% of the emissions originate below 400 hPa
http://journals.ametsoc.org/doi/10.1175/1520-0426%282003%2920%3C613%3AEEOVOM%3E2.0.CO%3B2#s2a2
MSU cannot isolate surface emissions successfully, or vertically narrow bands of atmosphere. MSU sensors measure atmospheric radiance with vertical resolution of kilometers, not meters.
You can find links to other S&C papers at the above links all consistent with this.
From RSS page on MSUs.
Microwave Sounders
These are satellite-borne instruments that measure the radiance of Earth at microwave frequencies, which allows scientists to deduce the temperature of thick atmospheric layers.
Advantages
Global coverage at a high samplng rate
Disadvantages
Coarse vertical resolution
http://www.remss.com/measurements/upper-air-temperature/
On the same page:
Channels and Satellites used in RSS Atmospheric Temperature Products:
[List of channels/sensors]
Each product measures the mean temperature of the atmosphere in the thick layer. This brightness temperature TB measured by the satellite can be described as an integral over the height above Earth’s surface Z of the atmospheric temperature TATMOSPHERE weighted by a weighting function W(Z), plus a small contribution due to emission by Earth’s Surface τεTSURF.
When is it going to sink in?
UAH TLT is derived from brightness measurements through Earth’s troposphere weighted at about 4 km altitude.
Neither UAH or RSS have a land surface product or “2 meter altitude” product derived from satellites. If they could do that, they certainly would for a direct comparison to the surface records.
barry…”When is it going to sink in?”
I throw that back at you. Do you know anything at all about bandwidth and the meaning of channels in telemetry? Why do you think they have so many channels with each one tuned to a certain Ghz centre frequency?
Each channel represents an amplifier that is tuned to receive certain EM frequencies. Channel 5 is tuned to the expected frequencies from oxygen molecule emissions
Don’t sit there and lecture me on how microwave receivers work, I specialized in telecom featuring microwaves. You are talking through your hat, trying to interpret jargon from RSS after they claim oxygen absorbs at certain frequencies but they are measuring microwave emissions. Roy corroborated that the AMSU measures emission. If it was measuring absorp-tion you’d need an entirely different setup.
Roy also corroborated that the weighting is related to the sensitivity of the receiver to altitude. The weighting is a reference to how the sensitivity changes as the scanner moves from straight down to the horizon. Obviously channel 5 on the scanner will scan an increasing altitude as it sweeps.
Why do you think the peaks of each channel’s bandwidth is centred at different altitudes? If they were all centred at 4 km, or whatever, the graph would indicate that.
There is no point having umpteen separate channels unless each one is tuned to receive data from different altitudes. Channel 5 does overlap a considerable altitude but it is centred at 2000 metres and one of its flanks intercepts the surface.
Yes, channel 5 cannot isolate a narrow band of vertical atmosphere. None of the can. There are various ways to try to reduce/isolate different layers of the atmosphere, including combining different channels at different frequencies, or using one channel but with many viewing angles.
The best vertical resolution they can get is still of radiance measurements many kilometers deep.
You are talking through your hat, trying to interpret jargon from RSS after they claim oxygen absorbs at certain frequencies but they are measuring microwave emissions. Roy corroborated that the AMSU measures emission. If it was measuring absorp-tion youd need an entirely different setup.
What are you talking about? This is from the RSS page.
“RSS upper air temperature products are based on measurements made by microwave sounders. Microwave sounders are capable of retrieving vertical temperature profiles of the atmosphere by measuring the thermal emission from oxygen molecules at different frequencies.”
I never said they were measuring absorp-tion, and neither does RSS.
barry…”Coarse vertical resolution
http://www.remss.com/measurements/upper-air-temperature/”
************
note the title of the article at your link:
Upper Air Temperature
This includes TLT – read the whole article, rather than just the web address, eh?
barry…”This includes TLT read the whole article, rather than just the web address, eh?”
he?…fair dinkum, cobber.
I need to be honest, I include RSS with the likes of NOAA. I have no respect for them or what they have to say.
barry…”The plot shows channel 5 covering an altitude of about 10km”
It peaks at 2000 metres and is almost gone by 800 hPa. You need to learn to read graphs.
It peaks at 2000 metres and is almost gone by 800 hPa.
Yep, that’s something like what the old LT profile was, but hooray!
You are finally seeing that MSUs measure radiance through kilometers of atmosphere, and not some vertically shallow near-surface band.
Hopefully you will remember this in the future.
—————————————————————-
Handily, the chart in Spencer and Christy’s latest paper for revision 6 of the UAH data set has a weighting profile expressed in altitude, so no need to convert. The graph is near the bottom of the paper.
http://www.drroyspencer.com/wp-content/uploads/APJAS-2016-UAH-Version-6-Global-Satellite-Temperature-Products-for-blog-post.pdf
If you look at Fig. 2 (p.31), you can see the version 6 LT profile stretching from surface to about 14km, peaking at around the 4km mark.
Weighting for the previous version (5.6) peaked at around 2km, and stretched from the surface to 13km altitude.
While weighting peak is currently at 4km, there is another 10km of radiance being measured above it, and only 4km below. IOW, there is more radiance being measured above 4km than below (the profile area is greater above 4km than below it).
(For version 5.6 with peak weighting at 2km, most of the radiance measured above that to 13km – look again at the area)
MSUs cannot and do not give surface or near-surface temps. Hopefully you’re seeing that now and we don’t have to do this again.
I urge you again to look at Fig 2 in the S&C paper above, on page 31. That’s the profile in altitude for the radiance measurements made by MSUs.
And keep in mind what I quoted directly from the compilers of the UAH temperature record, as linked to one of their papers above:
“the satellite can only measure deep layer temperatures”
Surely that is as clear as it gets.
barry on January 7, 2018 at 6:14 AM
To be sure it is now definitely understood even by trolls, I add here to your excellent comment a link to Fig. 2:
http://4GP.ME/bbtc/1515330621970.jpg
People lacking experience probably interpret the 5 not as a UAH revision but as a channel number.
As I noted in an earlier comment upthread, UAH6.0’s average absolute temperature in 2015 was around 264 K giving an average measurement altitude of 3.7 km aka 640 hPa.
{ Mea culpa: I still didn’t compute the actually valid temperature! Should happen soon. }
Maybe I should take some time to inspect UAH5.6’s climatology in order to obtain the absolute baseline allowing for a recomputation of UAH5.6’s average absolute temperature for the same year as for UAH6.0, and hence of a comparable average height of its measurements.
According to Fig 2., that should be around 2 km.
The average absolute temperature for 2017 is 264.33 K, what is 0.37 K higher than the average of Roy Spencer’s 12 month climatology (263.95 K).
That 0.37 K difference is the same value as the one obtained when averaging the 12 anomalies in the head post; thus my evaluation of UAH’s climatology data seems to be correct.
UAH5.6′ climatology
https://www.nsstc.uah.edu/data/msu/t2lt/tltmonacg_5.6
gives for its 12 months a year average of 269 K, i.e. 5 K more than for UAH6.0.
Considering again the lapse rate of 6.5 K /km then gives an altitude of 2.9 km (3.7 km for UAH6.0).
Thus indeed, if all is correct, this shows that UAH5.6 not only has a higher linear trend estimate than UAH6.0 (0.16 / decade instead of 0.13); it is also a bit nearer to surface when evaluating O2’s microwave emissions.
Maybe the latter explains the former :-))
Anyway it is funny to observe that people who pretend that UAH is very well able to capture surface temperature information by microwave sounding, in fact are also exactly those who refute UAH5.6 because it is “too warm”.
Fig. 2 from the latest revision paper includes a dashed line that is the temp trends for radiosondes at different levels of the atmosphere. The near-surface trends have a slightly higher trend than most of the troposphere.
http://4gp.me/bbtc/1515330621970.jpg
barry on January 7, 2018 at 5:09 PM
The near-surface trends have a slightly higher trend than most of the troposphere.
*
barry, that’s a crude understatement…
Even the highly homogenised RATPAC radiosonde set shows, at least for recent years, far higher trends than the land surface measurements themselves:
http://4gp.me/bbtc/1515368201756.jpg
The radiosonde surface trend becomes even higher when you take for these 85 RATPAC stations the original, raw IGRA station data instead:
http://tinyurl.com/yc8nh6u7 (delta charlie)
And the average trend experiences a further increase when you take all 1500 IGRA stations into consideration; GHCN unadjusted is cool in comparison to that.
barry, thats a crude understatement
Based on Fig. 2, I’m not so sure. In any case, despite what some may believe, I prefer to be conservative with what I say.
at least for recent years, far higher trends
Short-term trends!
http://4gp.me/bbtc/1515368201756.jpg
For 1979 to present, the satellite period, the trends don’t look to be stunningly different, though near-surface RATPAC does run higher.
Wonder what my eye is like? I’m guessing a trend of 0.22 C/decade for RATPAC.
Gordon’s article is from 2010. UAH has used different channels and weighting for LT over time. The latest version uses a combination of channels that are also used for their mid troposphere and lower stratosphere products. One of the features of the new LT scheme is that there is more influence from the lower stratosphere on the radiance measurements. Surface radiance accounts for about 17% of all radiance measurements for LT.
Thank you barry; if I have understood moyhu commenter Olof R right, this is counterbalanced by integrating some little % of LS.
From
https://ghrc.nsstc.nasa.gov/amsutemps/
Altitude selection
135,000 ft 41 km 2.5 mb (ch14)
118,000 ft 36 km 5 mb (ch13)
102,000 ft 31 km 10 mb (ch12)
82,000 ft 25 km 25 mb (ch11)
68,000 ft 21 km 50 mb (ch10)
56,000 ft 17 km 90 mb (ch09)
46,000 ft 14 km 150 mb (ch08)
36,000 ft 11 km 250 mb (ch07)
25,000 ft 7.5 km 400 mb (ch06)
14,000 ft 4.25 km 600 mb (ch05)
Near Surface layer (ch04)
Is this explicit enough for Gordon?
barry…”You are finally seeing that MSUs measure radiance through kilometers of atmosphere, and not some vertically shallow near-surface band”.
Not likely, it’s much easier to remember your arrogance.
Since when did 2000 metres become ‘kilometres of atmosphere? Channel 5 is centred at 2000 metres (800 hPa) and it’s bandwidth stretches to the surface and up to about 100 hPA. However, useful bandwidth is measures at 0.707 peak which puts the useful bandwidth of channel 5 around 500 hPA, which translates to about 4500 metres.
You are in-fact quoting the upper bandwidth limit of channel 5 at 4.5 kilometres. What about the rest of the bandwidth that measures right to the surface.
You still don’t understand what bandwidth means. It means with an effective bandwidth of so many GHz, the AMSU unit on channel 5 can receive frequencies radiated by oxygen up to 4.5 km but right down to the surface as well.
If surface level oxygen is radiating at x Ghz, channel 5 will detect it. So will 4, 6, 7 and 8 to different degrees.
How UAH distinguishes radiation to altitude is a mystery to me but they must have a way of correlating expected temperature to typical altitude. I think it misses the mark to write it off as weighting features, as if a temperature is gathered at 4 km then correlated to altitude through weighting. Such a practice would render multiple detection channels superfluous.
If that’s what you think, I think you’re dead wrong.
I am hoping Roy will do an article on this one day.
Some days ago I wrote:
Bindidon on January 4, 2018 at 6:16 AM
Some food for betterknowers
https://en.wikipedia.org/wiki/Tidal_locking
It seems to me that the hint hasn’t lost any actuality yet.
Don’t ask me how it is possible that in 2017 people can stay so obstinately in denial of such things.
That people refute AGW I fully understand: despite amazingly stoopid opinions about me (expressed by some of the dumbest commenters visiting this site), I’m not at all sure enough to agree.
*
I stay since years on Roy Spencer’s line: half natural, half man-made.
That I call ‘sound skepticism’. As opposed to ‘skepticism’ as understood by people who in fact are in ‘denialism’.
*
But above that point, I see here every day that there are still people even dumb enough to believe that GHE warming as such doesn’t exist.
Probably because they think those who understand the concept would in turn believe that would be the same as the warming in real greenhouses, ha ha ha haaa, great!
More of that! Right now, afin que je puisse rire, rire et encore rire. Cela me fait tant de bien!
Oh soorry! I apologise, we are since a few days in… 2018.
Yeah Bin, learn what year it is. Then, learn about orbital motion. Then learn some thermodynamics.
The more learning, the better. You don’t want folks believing you’re ignorant.
Better you start learning… not only about tidal locking, but also about… heat transfer.
When I see your believer’s keyword ‘thermodynamics’ I remember this excellent textbook written by physics professors Lienhard Sr/Jr (Houston, MIT) within which we find this inconspicuous sentence in paragraph 1.2 on page 8:
The reader will recall that engineering thermodynamics might better be named thermostatics, because it only describes the equilibrium states on either sides of irreversible processes.
http://4GP.ME/bbtc/151536538098.jpg
One day you will start reading that book, I’m sure.
http://web.mit.edu/lienhard/www/ahtt.html
Poor Bin, he gets himself so confused. It must be the language barrier.
Bin, “tidal locking” is synonymous with NOT “rotating on an axis”. The Moon can NOT rotate on its axis because it is rigidly locked, with only one side visible from Earth.
(Maybe try google “translate”.)
g*e*r*a*n
Here is the established version of tidal locking. You can make up your own version (which you do).
https://www.spaceanswers.com/deep-space/what-is-tidal-locking/
“Tidal locking is the name given to the situation when an objects orbital period matches its rotational period. A great example of this is our own Moon. The moon takes 28 days to go around the Earth and 28 days to rotate once around its axis. This results in the same face of the Moon always facing the Earth. We see other examples of this in our solar system and universe.”
You just made up this idea that tidal locking means the Moon cannot rotate because it is rigidly locked. Make belief physics, your own fantasy. You like to do that don’t you. You make fun of Bindidon but you are the one confused that can’t understand definitions and makes up your own version of physics.
Con-man, you continue to con only yourself. You keep repeating the same nonsense, over and over, hoping it will somehow prove me wrong.
“Insanity is doing the same thing over and over, hoping for different results.”
Hilarious.
g*e*r*a*n
I already know you believe established science is nonsense.
The reason I continue to demonstrate you know nothing of science is not hoping you will change (you won’t). I saw another parroting your made up physics J Halp-less so if I see you posting one of your pseudoscience made up physics I will provide the real and valid physics. I can try to prevent your infection from spreading. With a scientifically illiterate population your unreal world may seem real to those that do not know the difference.
So tell me how you can walk around a square table without rotating on your axis?. If you don’t rotate on your axis you keep moving straight ahead.
I want anyone to notice that I am totally correct about you. I present real science and demonstrate how little you know and all you can comment is that the real science is “nonsense”. You can’t come up with any established science supporting your view.
binny…”The reader will recall that engineering thermodynamics might better be named thermostatics, because it only describes the equilibrium states on either sides of irreversible processes”.
What an utterly stupid thing to say. The author is apparently a theoretician raised on statistical mechanics rather than a student of Clausius as he should be.
And you should be defending Clausius. He was a very intelligent, great German scientist.
I have read the first few chapters of the book you reference (thanks) and the author’s description of heat is primitive and inaccurate. Heat does not flow, as claimed by the author, in radiative transfer. It can’t. Heat is a property of atoms and there are no atoms in a vacuum, through which radiation passes easily.
The author is one of those who has put forward the nonsense that heat is a mystical quantity which is more a mathematical aberration than a reality. I just hope he does not sit on a hot stove in an attempt to prove his nonsense.
Heat cannot flow through a vacuum. The author is obviously one of those who cannot distinguish between heat and electromagnetic energy. He even messes up the 2nd law by equating it to entropy.
He fails to acknowledge that Clausius wrote the 1st law, the 2nd law, and defined entropy. He obviously cannot acknowledge Clausius because what Clausius taught is not the same as the nonsense the author is trying to peddle.
Following Clausius, circa 1875, scientists like Boltzmann and Planck pursued statistical mechanics, trying to establish the 2nd law statistically. They failed, however, statistical mechanics fit the new quantum theory and has prevailed, ousting the teachings of Clausius. It does not matter to modern scientists that Clausius is right and that they cannot account for heat transfer through a vacuum by heat flow. They still push that nonsense.
Clausius defined the 2nd law with words relating to the fact heat cannot be transferred by its own means from a cooler body to a warmer body. He DID NOT equate entropy to the 2nd law, that came later from scientists who failed to get the meaning Clausius intended for the 2nd law.
Clausius was not interested in establishing the theory of entropy when he developed the 2nd law. His interest was in countering the claim by Carnot that no losses occurred in a heat engine. He proved there were losses with the work he put forward to develop 2nd law theory. If you look at those proofs, they involve detailed drawings of the processes in a heat engine involving temperature, volume, and pressure. That’s how he proved the 2nd law.
The author laments that dS cannot be used to quantify heat flow. Of course it can’t. According to Clausius, S, as entropy, is either +ve or 0. How could it be used for anything other than describing the likelihood that a process is reversible or irreversible?
Later, Planck equated entropy to probability even though from what I have read from him he never described what he meant by entropy. I mean, what is it? How can you assign a probability to something you cannot define physically? No matter, those in statistical mechanics persisted with there folly and now we are stuck with it.
Clausius described entropy in words as the integral of infinitesimal transfers of heat into or out of a body at a temperature T at which the transfers take place. The integral must be 0 in a reversible process and positive in an irreversible process. That’s all entropy can tell you, the degree of irreversibility. It has nothing to do with the 2nd law per se and Clausius introduced it as an aside AFTER he had defined the 2nd law.
There are many modern scientist like this author who just don’t get it. They persist in teaching crap that cannot be proved other than through strictly mathematical ideology.
Statistical mechanics cannot be visualized. Planck admitted that openly. So we are stuck with a ‘trust me’ mentality. I am the professor, I teach the course, and if you don’t give me the answer I expect on the exam, you flunk.
norman…”So tell me how you can walk around a square table without rotating on your axis?. If you dont rotate on your axis you keep moving straight ahead”.
A figure skater spinning, as they do, on a spot, could be claimed to be rotating around an imaginary axis. I hardly think that applies to someone walking around a square table, or to toy cars traveling in a constrained motion around a track.
An axis normally applies to a solid body rotating, like the Earth rotating around an imaginary axis. A body traveling independently by itself around a table does not lend itself to the idea of an axis.
An axis is imaginary. If those toy cars were tethered to a central axial point, like spokes on a wheel, you might have an argument.
Gordon Robertson
Here is the accepted definition of Axis of Rotation:
“Definition of axis of rotation
: the straight line through all fixed points of a rotating rigid body around which all other points of the body move in circles”
If you walk around a table your body is rigid. You have a line that goes through you that all other points of your body can rotate around. You can stand in a spot and spin and you have an axis that the rest of your body rotates around. You are doing the same thing walking around a table. You have to rotate around or you will not go around the table. Say initially your face will be pointing North, when you are half-way around your face points south. It is no different than if you stood in one spot and turned half-way around.
It does not matter the axis is an imaginary line, your body will still rotate around this axis in order to walk around a table.
If you went on the Moon and had a camera facing the fixed stars and you located one like Polaris on Earth and aimed the camera at that star, all the other stars would move around this center star.
http://scienceblogs.com/startswithabang/files/2010/09/star_trails_sept_18-9_2006_9pm-6am-600×398.jpg
Gordon I hope you are not siding with g*e*r*a*n on this issue. He is wrong about it. I don’t think you are very intelligent and you have a limited ability to learn things but you don’t seem to be this ridiculous stupid person that g*e*r*a*n presents himself as
Norman, commenter Bart wrote a nice description of the tidal mechanism last month:
http://www.drroyspencer.com/2017/12/uah-global-temperature-update-for-november-20170-36-deg-c/#comment-277412
Now, you should be able to see why, thanks to tidal locking, the moon doesnt rotate on its axis whilst it orbits. You want to consider the orbiting motion as incorporating one full rotation of the moon on its axis, with respect to inertial space, when each single orbit is complete. This is understood, but its simpler overall to see it that the moon does not rotate on its axis whilst orbiting, thanks to tidal locking, and therefore the term *synchronous rotation* is superfluous. If you have *tidal locking* already, and understand the difference between the apparent (but not actual) rotation of an object on its axis with respect to inertial space, vs true axial rotation whilst orbiting, you dont need it!
con-man asks: “So tell me how you can walk around a square table without rotating on your axis?”
Norm, you still confuse “orbiting” with “rotation on an axis”. The two are different, distinct, independent motions.
Please review lessons 1 & 2.
http://www.drroyspencer.com/2017/12/uah-global-temperature-update-for-november-20170-36-deg-c/#comment-277084
Here again is SGW’s excellent model (with a bit of editing):
1. Pierce a round object with a toothpick. Grasp the toothpick between your fingers and twirl the toothpick. What you observe is called rotation. The object is rotating or spinning about the axis of the toothpick.
2. Now take that same toothpick and object and make a a circular orbit about some point on your desk or a table (but dont spin or twirl the toothpick in your fingers) This motion is called an orbit.
3. Now perform the orbit as described above, but at the same time rotate the toothpick between your fingers. The object is now doing TWO THINGS AT ONCE. It is performing an orbit, and it is rotating about its axis.
And yes, dear nitwits, an orbit and “rotation about an axis” are definitely two separate things, even when they happen at the same time.
Snape, its not nice to refer to Norman and SGW as nitwits. Im sure if they concentrate hard enough they will understand the message you are trying to put across:
S: And yes, dear nitwits, an orbit and rotation about an axis are definitely two separate things, even when they happen at the same time.
J: You have no idea how hard its been trying to get that across to them.
Halp
Step one describes an object rotating about it’s axis while stationary.
Step two describes an orbit, minus axial rotation.
Step three puts them together. When one axial rotation (a separate motion) TAKES THE SAME AMOUNT OF TIME as one orbit, this creates an illusion: one side of the object will always face the center of orbit, and will APPEAR to not be rotating all.
You, g* and Gordon, being nitwits, are mesmerized by this illusion.
Consider the moon when viewed from earth:
If it turned 90 degrees on it’s axis for each completed orbit, we would see it spin. If it turned 180 degrees, we would see it spin. If it turned 270 degrees, we would see it spin.
But because it spins 360 degrees on it’s axis during each orbit, it appears to not spin at all.
Oh, no I wasnt talking about either SGWs example or your version of it. I was just commenting about your post at 1:31pm.
Handily, it includes a version of the 2-plate black body exercise.
g*e*r*a*n may discover that a black body absorbs all incident thermal radiation regardless of the temperature of the source of that radiation.