Home/Blog
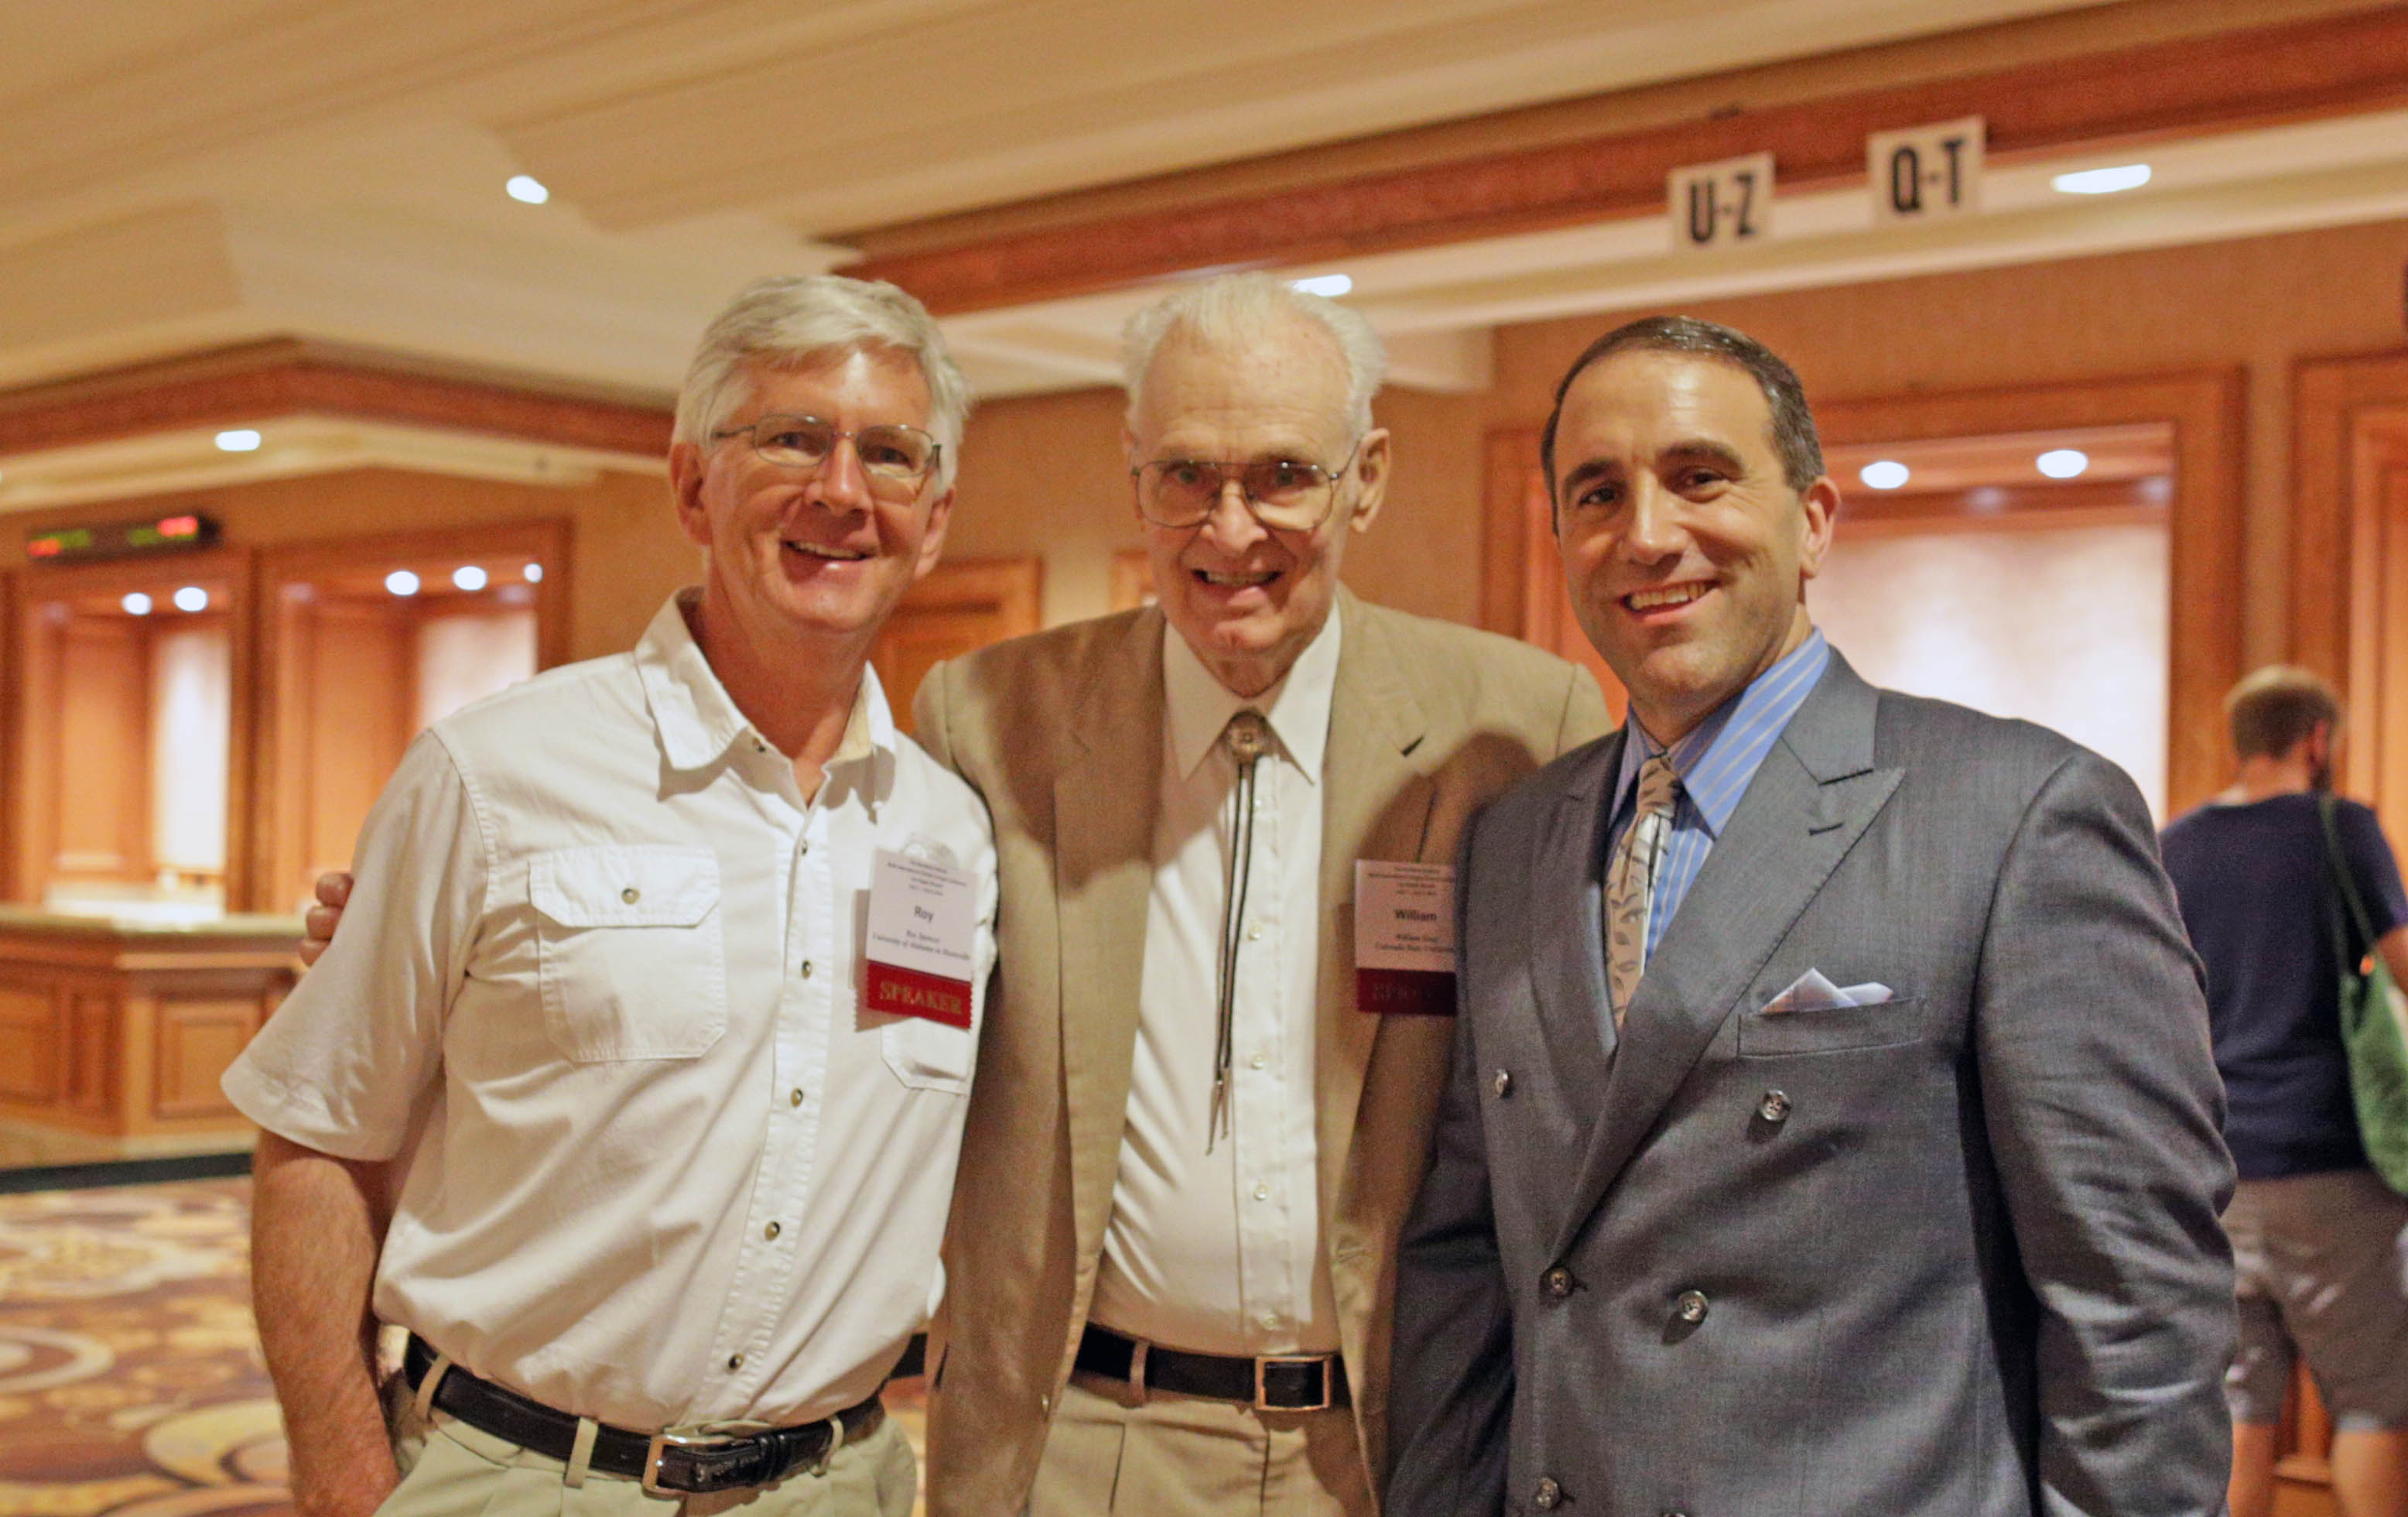
Myself, Bill Gray, and Marc Morano in Las Vegas, July, 2014.
Bill was a pioneering researcher and hurricane forecaster, as well as a skeptic of the seriousness of the manmade global warming threat.
Bill’s legacy goes well back before my time…and I’m getting to be an old guy (60). He was at most of the Heartland conferences, and he always made it a point to spend time with me. In fact, he was embarrassingly effusive with his praise. He was quite a character, and very sharp. We didn’t always agree on the science, but that’s ok.
My earliest memory of Bill was my very first scientific conference, an AMS Hurricanes and Tropical Meteorology Conference in Oklahoma, maybe around 1982. The big thing then was the mesoscale modelers were all giving papers showing that their model would take a pre-existing tropical disturbance, say an African easterly wave, and turn it into a hurricane. This indeed was an achievement.
After sitting through all of these presentations, Bill Gray, who was sitting just in front of me, stood up and asked in his Jimmy Stewart-esque way, “All you modelers keep showing your models producing a hurricane out of a disturbance…but that usually doesn’t happen…where are the model results showing that a hurricane doesn’t develop?”
I will never forget the question…it was a good one.
Goodbye, Bill. You will be missed.