Martha Stewart with her “iceberg” cocktail and the chunk of ice it presumably came from. (Martha Stewart/Instagram)
Martha Stewart, the American home-and-hospitality retail businesswoman, television personality and writer, has been on a cruise around Greenland, where she had a chunk of ice (presumably calved from the Greenland ice sheet) brought aboard to provide ice for adult beverages.
Cue the climate alarmists, who considered such an action to be tone deaf regarding the seriousness of the climate crisis.
What, you might ask, does fishing a chunk of ice out of the ocean next to the Greenland ice cap have to do with the “climate crisis”?
Well, in some people’s minds (I know because I’ve met a few of them), ice calving off of the Greenland ice sheet is due to global warming.
Wrong.
The Antarctic and Greenland ice sheets are locations which are so cold for so much of the year, with enough snowfall, that come summer not all of the snowfall melts. This leads to a net accumulation of ice over the centuries and millennia. That’s what causes a “glacier” to form.
As the ice sheet deepens over the centuries, gravity starts to make the ice flow downhill, like very thick molasses. It then breaks off when it reaches the coast, floating away, and melting.
Everything I described above has nothing to do with global warming. Most scientists believe it has been going on for millions of years.
So, along comes Martha Stewart, at 82 years old just trying to enjoy life, and she gets global backlash for plucking a chunk of ice out of the ocean to cool her drink down.
What are they teaching kids in school these days???
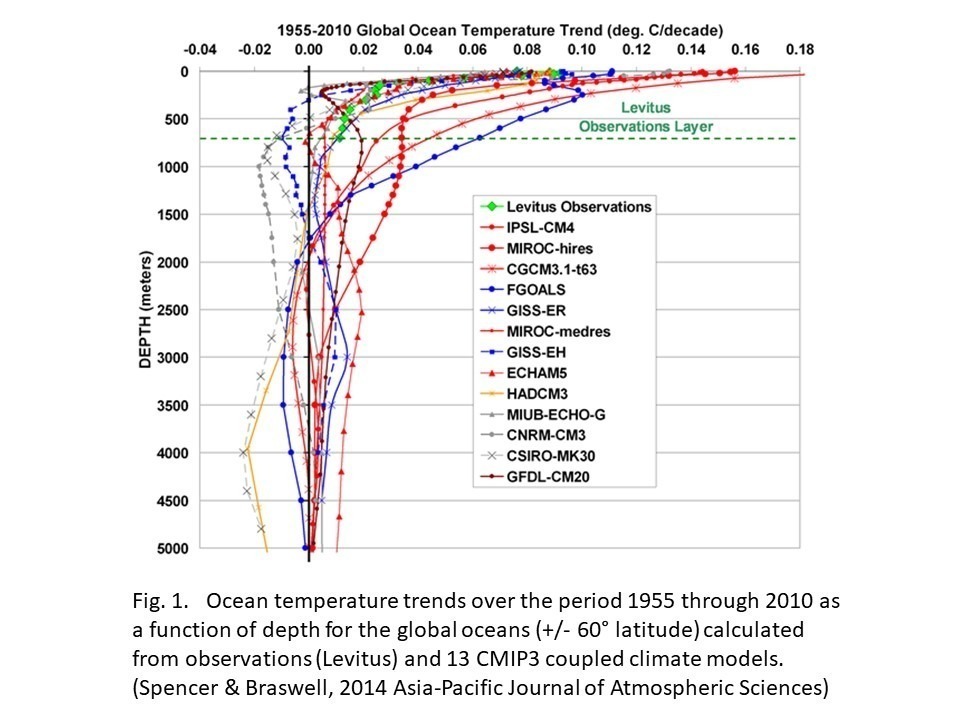
One of the most fundamental requirements of any physics-based model of climate change is that it must conserve mass and energy. This is partly why I (along with Danny Braswell and John Christy) have been using simple 1-dimensional climate models that have simplified calculations and where conservation is not a problem.
Changes in the global energy budget associated with increasing atmospheric CO2 are small, roughly 1% of the average radiative energy fluxes in and out of the climate system. So, you would think that climate models are sufficiently carefully constructed so that, without any global radiative energy imbalance imposed on them (no “external forcing”), that they would not produce any temperature change.
It turns out, this isn’t true.
Back in 2014 our 1D model paper showed evidence that CMIP3 models don’t conserve energy, as evidenced by the wide range of deep-ocean warming (and even cooling) that occurred in those models despite the imposed positive energy imbalance the models were forced with to mimic the effects of increasing atmospheric CO2.
Now, I just stumbled upon a paper from 2021 (Irving et al., A Mass and Energy Conservation Analysis of Drift in the CMIP6 Ensemble) which describes significant problems in the latest (CMIP5 and CMIP6) models regarding not only energy conservation in the ocean but also at the top-of-atmosphere (TOA, thus affecting global warming rates) and even the water vapor budget of the atmosphere (which represents the largest component of the global greenhouse effect).
These represent potentially serious problems when it comes to our reliance on climate models to guide energy policy. It boggles my mind that conservation of mass and energy were not requirements of all models before their results were released decades ago.
One possible source of problems are the model “numerics”… the mathematical formulas (often “finite-difference” formulas) used to compute changes in all quantities between gridpoints in the horizontal, levels in the vertical, and from one time step to the next. Miniscule errors in these calculations can accumulate over time, especially if physically impossible negative mass values are set to zero, causing “leakage” of mass. We don’t worry about such things in weather forecast models that are run for only days or weeks. But climate models are run for decades or hundreds of years of model time, and tiny errors (if they don’t average out to zero) can accumulate over time.
The 2021 paper describes one of the CMIP6 models where one of the surface energy flux calculations was found to have missing terms (essentially, a programming error). When that was found and corrected, the spurious ocean temperature drift was removed. The authors suggest that, given the number of models (over 30 now) and number of model processes being involved, it would take a huge effort to track down and correct these model deficiencies.
I will close with some quotes from the 2021 J. of Climate paper in question.
“Our analysis suggests that when it comes to globally integrated OHC (ocean heat content), there has been little improvement from CMIP5 to CMIP6 (fewer outliers, but a similar ensemble median magnitude). This indicates that model drift still represents a nonnegligible fraction of historical forced trends in global, depth-integrated quantities…”
“We find that drift in OHC is typically much smaller than in time-integrated netTOA, indicating a leakage of energy in the simulated climate system. Most of this energy leakage occurs somewhere between the TOA and ocean surface and has improved (i.e., it has a reduced ensemble median magnitude) from CMIP5 to CMIP6 due to reduced drift in time-integrated netTOA. To put these drifts and leaks into perspective, the time-integrated netTOA and systemwide energy leakage approaches or exceeds the estimated current planetary imbalance for a number of models.“
“While drift in the global mass of atmospheric water vapor is negligible relative to estimated current trends, the drift in time-integrated moisture flux into the atmosphere (i.e., evaporation minus precipitation) and the consequent nonclosure of the atmospheric moisture budget is relatively large (and worse for CMIP6), approaching/exceeding the magnitude of current trends for many models.”
This is to remind folks about commenting controls here that might very well impact YOU…
I have quite a few banned terms that will get your comment ignored. These are meant to minimize bullying, although your use of such terms might not involve bullying at all.
Comments posted with an unrecognized name or email address will go to moderation, and depending upon how busy I am, I might not get to it for days. This means if you fat-finger either your name or your e-mail address (or, like me, accidentally include my middle name), the comment goes to moderation. Yes, I just had to approve my own comment.
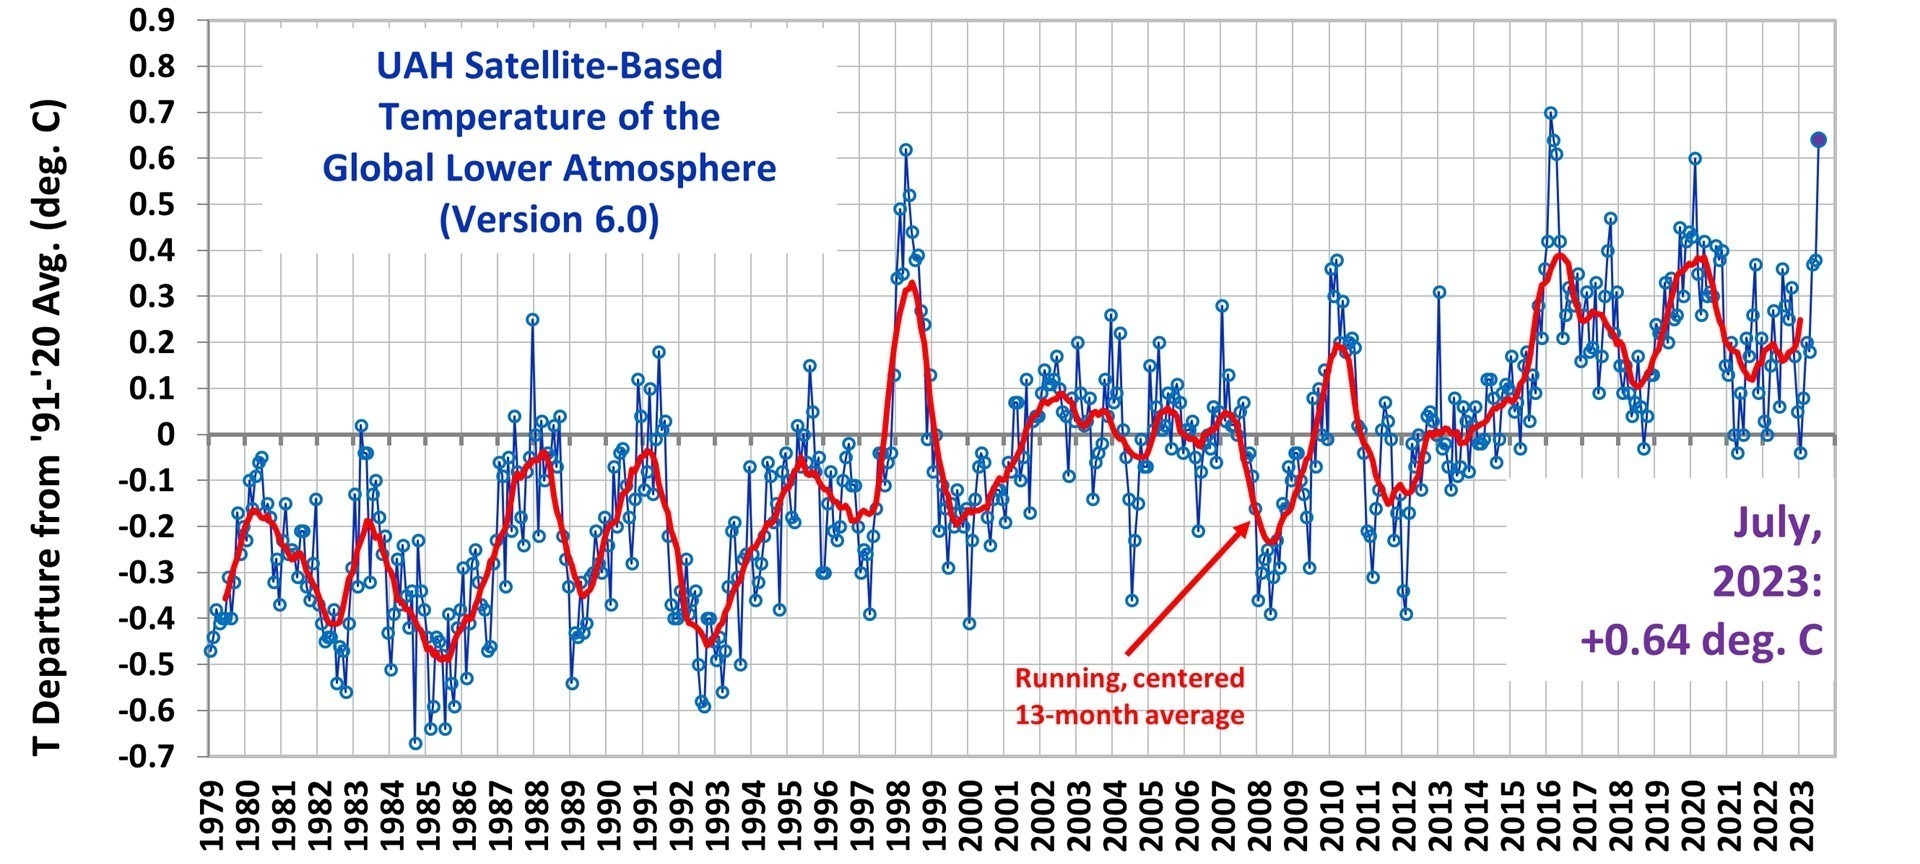
July 2023 was an unusual month, with sudden warmth and a few record or near-record high temperatures.
Since the satellite record began in 1979, July 2023 was:
warmest July on record (global average)
warmest absolute temperature (since July is climatologically the warmest month)
tied with March 2016 for the 2nd warmest monthly anomaly (departure from normal for any month)
warmest Southern Hemisphere land anomaly
warmest July for tropical land (by a wide margin, +1.03 deg. C vs. +0.44 deg. C in 2017)
These results suggest something peculiar is going on. It’s too early for the developing El Nino in the Pacific to have much effect on the tropospheric temperature record. The Hunga Tonga sub-surface ocean volcano eruption and its “unprecedented” production of extra stratospheric water vapor could be to blame. There might be other record high temperatures regionally in the satellite data, but I don’t have time right now to investigate that.
Now, back to our regularly scheduled programming…
The Version 6 global average lower tropospheric temperature (LT) anomaly for July 2023 was +0.64 deg. C departure from the 1991-2020 mean. This is well above the June 2023 anomaly of +0.38 deg. C.
The linear warming trend since January, 1979 now stands at +0.14 C/decade (+0.12 C/decade over the global-averaged oceans, and +0.18 C/decade over global-averaged land).
Various regional LT departures from the 30-year (1991-2020) average for the last 19 months are:
YEAR
MO
GLOBE
NHEM.
SHEM.
TROPIC
USA48
ARCTIC
AUST
2022
Jan
+0.03
+0.06
-0.00
-0.23
-0.12
+0.68
+0.10
2022
Feb
-0.00
+0.01
-0.01
-0.24
-0.04
-0.30
-0.50
2022
Mar
+0.15
+0.28
+0.03
-0.07
+0.22
+0.74
+0.02
2022
Apr
+0.27
+0.35
+0.18
-0.04
-0.25
+0.45
+0.61
2022
May
+0.17
+0.25
+0.10
+0.01
+0.60
+0.23
+0.20
2022
Jun
+0.06
+0.08
+0.05
-0.36
+0.46
+0.33
+0.11
2022
Jul
+0.36
+0.37
+0.35
+0.13
+0.84
+0.56
+0.65
2022
Aug
+0.28
+0.32
+0.24
-0.03
+0.60
+0.50
-0.00
2022
Sep
+0.24
+0.43
+0.06
+0.03
+0.88
+0.69
-0.28
2022
Oct
+0.32
+0.43
+0.21
+0.04
+0.16
+0.93
+0.04
2022
Nov
+0.17
+0.21
+0.13
-0.16
-0.51
+0.51
-0.56
2022
Dec
+0.05
+0.13
-0.03
-0.35
-0.21
+0.80
-0.38
2023
Jan
-0.04
+0.05
-0.14
-0.38
+0.12
-0.12
-0.50
2023
Feb
+0.08
+0.17
0.00
-0.11
+0.68
-0.24
-0.12
2023
Mar
+0.20
+0.24
+0.16
-0.13
-1.44
+0.17
+0.40
2023
Apr
+0.18
+0.11
+0.25
-0.03
-0.38
+0.53
+0.21
2023
May
+0.37
+0.30
+0.44
+0.39
+0.57
+0.66
-0.09
2023
June
+0.38
+0.47
+0.29
+0.55
-0.35
+0.45
+0.06
2023
July
+0.64
+0.73
+0.56
+0.87
+0.53
+0.91
+1.43
The full UAH Global Temperature Report, along with the LT global gridpoint anomaly image for July, 2023 and a more detailed analysis by John Christy of the unusual July conditions, should be available within the next several days here.
The global and regional monthly anomalies for the various atmospheric layers we monitor should be available in the next few days at the following locations:

 Home/Blog