Archive for March, 2014

Hey, IPCC, quit misusing the term “risk”

Monday, March 31st, 2014

Noah-fleeing-global-warming
The latest report of Working Group II of the IPCC, entitled Climate Change 2014: Impacts, Adaptation and Vulnerability, was approved yesterday. In it, the concept of the “risks” posed by human-induced climate change figures prominently.

Now, I can understand using terms like “possibilities” when it comes to anthropogenic global warming (AGW). It’s theoretically possible that the average warming of the last 50+ years was mostly human-caused, and it’s possible that the slight sea level rise over this time was more human-caused than natural (sea level was rising naturally anyway). But we really don’t know.

And the idea that severe weather, snowstorms, droughts, or floods have gotten worse due to the atmosphere now having 4 parts per 10,000 CO2, rather than 3 parts per 10,000, is even more sketchy. Mostly because there is little or no objective evidence that these events have experienced any long-term increase that is commensurate with warming. (It’s possible they are worse with globally cool conditions…we really don’t know).

But the main point of my article is that the IPCC has bastardized the use of the term “risk”. Talking “possibilities” is one thing, because just about anything is possible in science. But “risk” refers to the known tendency of bad things to happen as a result of some causal mechanism.

Walking across the street raises your risk of being hit by a car. We know this, because it has happened many thousands of times.

Cigarette smoking raises your risk of lung cancer. We know this because it has happened millions of times (and is consistent with other medical evidence that human tissue exposed to repeated injury, anywhere in your body, can result in the formation of cancerous tissue).

But when it comes to climate change, there is no demonstrated causal connection between (A) an extra 1 CO2 molecule per 10,000 molecules of air, and (B) any resulting observed change in weather or climate.

There are theories of how the former might impact the latter. But that’s all.

You cannot use the term “risk” to describe these theoretical possibilities.

The fact that the IPCC has chosen to do so further demonstrates it is an organization that was political in its intended purpose, with the ultimate mission of regulating CO2 emissions, and operates within an echo chamber of like-minded individuals who are chosen based upon their political support of the IPCC’s goals.

Now, you might ask, “Dr. Roy, are you telling me there are NO known risks to adding more CO2 to the atmosphere?”

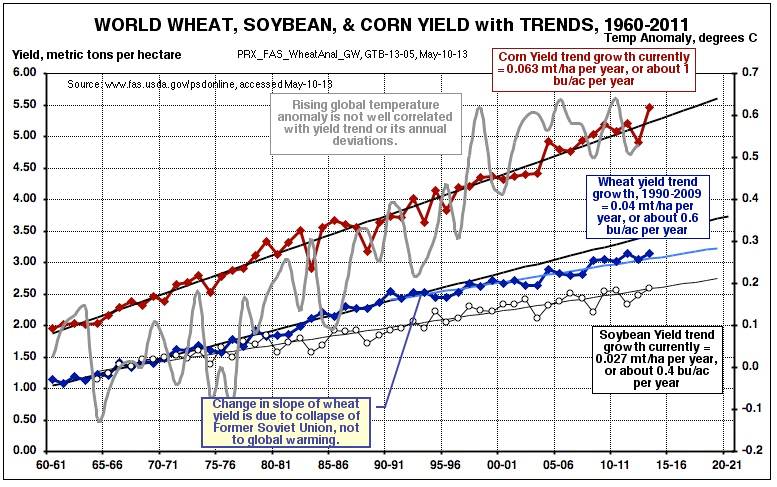
Well, I can only think of one. There are abundant controlled scientific studies which suggest that more CO2 will cause most vegetation to grow better, with more drought tolerance and more efficient use of water.

If you want to call that a “risk”, fine. But it doesn’t sound like such a bad thing to me, especially given the life-enhancing benefits of access to abundant, low cost forms of energy.

Did global warming take down Flight 370?

Thursday, March 20th, 2014

Sure, why not? I can’t believe this explanation wasn’t near the top of the list from the beginning.

If CNN can entertain the possibility that an errant black hole did it, why not global warming?

Look at all the evidence we had from the TV series Lost…but there never was a good explanation for what happened to that flight, right?
Lost-meme

How might global warming be involved? Well, let’s see. There are those mysterious megacryometeors (falls of giant pieces of ice, even out of a blue sky), which Jesus Martinez-Frias, a planetary geologist at the Center for Astrobiology in Madrid, Spain, tried to tell me are due to climate change. Maybe one of those smacked the plane.

Or, what about a rogue jet stream, disrupted by global warming, suddenly arising and causing so much tail wind that the jet loses lift and drops out of the sky?

C’mon folks, lets’ use our imaginations! Surely we can do better than black holes!

The Next Great Famine…or Age of Abundance?

Tuesday, March 18th, 2014

One of the most annoying things about climate forecasts is the apparent need to predict catastrophe.

Of course, it makes good press, like the latest from Bryan Walsh at Time, Climate Change Could Cause the Next Great Famine.

While such theories can always find a home with some learned academics, for those who ‘do’ rather than ‘teach’, the world is a very different place.

For the last 4 years, I have spoken at a Kansas City conference of grain growing and investment interests organized by The ProExporter Network, a company which tracks and predicts both U.S. and international grain markets and growing conditions, especially for corn, soybeans, and wheat.

I was with these folks again last week, and from what I hear, there have been no negative climate-related changes which have been identified. If they do exist, they are swamped by technological improvements…and maybe even the positive effects of CO2 fertilization (which has somewhat conflicting research results for maize).

Here in the U.S, as well as globally, grain production as well as yields (in bushels per acre) have been on an upward linear trend for at least 50 years, primarily due to improvements in varieties (e.g. with greater drought tolerance) and growing practices:
global-grain-yields

Most year-to-year interruptions in normal growing weather are due to heat waves and droughts, or less frequently, floods. High corn yields are favored by a warm spring with dry planting weather, a not-too-hot summer with sufficient rain (the most important growing period), and a warm, dry fall.

If we examine observed summer (June/July/August) temperatures over the corn belt, we see no obvious warming in the USHCN data. This is in stark
contrast to the average of 42 climate models available through the KNMI Climate Explorer for approximately the same region as the corn belt:

Corn-belt-CMIP5-models-vs-USHCN-temps

Needless to say, the average model expectation of warming has not materialized in the corn belt. The corresponding average precipitation change in the models (not shown) has a near-zero trend for the corn belt, while there has been maybe a 10% increase in observed precipitation over the last 100 years, largely due to the Dust Bowl days early in the record.

The IPCC claims there is a negative impact of global warming on corn, but the experts I have talked to say there is no way to get that out of the data. You would have to have accurate quantitative knowledge of the technological trend, which you don’t.

In other words, without an accurate removal of the factors leading to the huge increase in corn yield (which is not possible), you can’t back out of the data any kind of climate-related signal. (If anything, the face-value evidence is that warming leads to higher yields, not lower.)

And without that accurate quantitative knowledge (and no evidence of observed corn belt climate change anyway), they tell me there is little reason to depart from a forecast of slowly increasing corn yields in the coming years.

So, unless you are an academic who is trying to remain relevant to the real world by forecasting doom and asking for government grants to support your Malthusian view of the world (wherein population increases exponentially and food production remains more constant), the real world scenario is that population will level off in the next 50 years, while grain production and yields will likely continue to grow, at least for the foreseeable future.

Re Missing Flight MH370: Smoke from North Sentinel Island

Friday, March 14th, 2014

Most days I check out the global MODIS imagery at the NASA Worldview website, and today I zoomed in on North Sentinel Island, in the Bay of Bengal. Looking through recent days, I noticed a plume of smoke starting on the afternoon of Saturday, March 8. Ever since then, there has been smoke evident on most of the days, through yesterday, and it seems to emanate from the north side of the island:

Smoke streaming southward from North Sentinel Island on 13 March, 2014.

Smoke streaming southward from North Sentinel Island on 13 March, 2014.

The MODIS spatial resolution (250 m) is nowhere near good enough to observe something as small as an airplane, but it routinely sees smoke plumes. Now, it might well be that the natives on this (very primitive and hostile) island have burnings during this time of year. There are thought to be less than 100 inhabitants of the island, and they do not like visitors.

But, I looked through all of the days in March of last year (2013), and saw no obvious evidence of smoke. Nor was there smoke earlier this month before the plane disappeared.

I believe this is one of the many islands that is being targeted for investigation.

Interestingly, the island was raised 1 to 2 meters after the 2004 Indian Ocean earthquake, exposing many of the coral reefs surrounding the island.

I doubt that there is a connection to the missing flight, which would be a real shot in the dark. But it is a strange coincidence.

At a minimum, this is a plug for the NASA Worldview website, which I’ve been wanting to mention anyway.

UAH Global Temperature Update for February 2014: +0.17 deg. C

Wednesday, March 5th, 2014

The Version 5.6 global average lower tropospheric temperature (LT) anomaly for February, 2014 is +0.17 deg. C, down 0.12 deg C from January (click for full size version):
UAH_LT_1979_thru_February_2014_v5

The global, hemispheric, and tropical LT anomalies from the 30-year (1981-2010) average for the last 14 months are:

YR MON GLOBAL NH SH TROPICS
2013 1 +0.497 +0.517 +0.478 +0.386
2013 2 +0.203 +0.372 +0.033 +0.195
2013 3 +0.200 +0.333 +0.067 +0.243
2013 4 +0.114 +0.128 +0.101 +0.165
2013 5 +0.082 +0.180 -0.015 +0.112
2013 6 +0.295 +0.335 +0.255 +0.220
2013 7 +0.173 +0.134 +0.211 +0.074
2013 8 +0.158 +0.111 +0.206 +0.009
2013 9 +0.365 +0.339 +0.390 +0.190
2013 10 +0.290 +0.331 +0.249 +0.031
2013 11 +0.193 +0.160 +0.226 +0.020
2013 12 +0.266 +0.272 +0.260 +0.057
2014 1 +0.291 +0.387 +0.194 -0.028
2014 2 +0.172 +0.325 +0.019 -0.102

Note that most of the cooling was in the tropics and Southern Hemisphere, less in the Northern Hemisphere.

The global image for February should be available in the next day or so here.

Popular monthly data files (these might take a few days to update):

uahncdc_lt_5.6.txt (Lower Troposphere)
uahncdc_mt_5.6.txt (Mid-Troposphere)
uahncdc_ls_5.6.txt (Lower Stratosphere)

Christy & Emanuel have A Conversation on Climate Change

Tuesday, March 4th, 2014

“A Conversation on Climate Change” was held in the UAH Chan Auditorium last evening in front of a standing room only audience. UAH professor John Christy (aka “my boss”) and Prof. Kerry Emanuel (MIT) answered questions posed by the moderator, noted economist Russ Roberts. The event was hosted by the UAH College of Business Administration.

Kerry Emanuel, Russ Roberts, and John Christy have A Conversation on Climate Change, March 3, 2014.

Kerry Emanuel, Russ Roberts, and John Christy have A Conversation on Climate Change, March 3, 2014.


The discussion focused on how much the world has warmed, whether severe weather has gotten worse, how much consensus exists in the climate community, and what should be done about the problem.

John Christy emphasized that all of the 100+ climate models have over-predicted warming in the tropical troposphere, by at least a factor of 2, and this was supposed to be the most obvious manifestation of global warming as predicted by climate models.

Kerry Emanuel emphasized the strong consensus in the climate community that adding CO2 to the atmosphere will cause warming, that the details of that warming remains uncertain (much of the heating has gone into the ocean), and that at least the possibility of catastrophic climate change compels us to act through energy policy.

Christy’s view was that we have the moral obligation to allow access to inexpensive energy by the world’s poor, a view which Emanuel also supported.

The “debate” was very well received by the audience. It will appear in a week or two as an EconTalk podcast, part of a series that Russ Roberts hosts.

2nd Coldest U.S. Winter in 35 Years

Monday, March 3rd, 2014

The primary winter months of December, January, and February averaged over the contiguous 48 United States were the 2rd coldest winter in the last 35 years. The average temperature of 32.2 deg. F was barely edged out by the slightly colder winter (32.0 deg. F) of 2009-2010 (click for large version):
DecJanFeb-USA48-temps-1973-2014

The analysis is based upon ~350 NOAA/NWS stations that measure temperatures every 6 hours (or more frequently), many located at airports. The data I use are adjusted for average spurious urban heat island (UHI) warming that increases with population density around the thermometer site. That relationship is shown at the end of this article.

The analysis starts in only 1973 since that is the first year with a large amount of quality-controlled 6-hourly temperature data archived at NOAA. The official NOAA temperature product (not yet announced) in contrast depends upon stations which generally don’t report hourly temperatures (mostly daily max/min temperatures), and which require large (and controversial) adjustments for varying time of observation.

Note also that 6 of the last 8 winters have been below the 41-year average.