Archive for September, 2013

The Global Warming They Fear is NOT Based upon Physical First Principles

Monday, September 30th, 2013

Prof. Lindzen critiques climate model calculations.

Prof. Lindzen critiques climate model calculations.

We are expected to swoon over the fact that climate models, which are run on supercomputers, are state-of-the-art achievements in science. But “state-of-the-art” does not always mean accurate, or even useful, if the art is still in its infancy.

It is sometimes said that climate models are built upon physical first principles, as immutable as the force of gravity or conservation of energy (which are, indeed, included in the models). But this is a half-truth, at best, spoken by people who either don’t know any better or are outright lying.

The most physically sound portion of global warming predictions is that adding CO2 to the atmosphere causes about a 1% energy imbalance in the system (energy imbalances are what cause temperature to change), and if nothing else but the temperature changes, there would only be about a 1 deg. C warming response to a doubling of atmospheric CO2 (we aren’t even 50% of the way to doubling).

But this is where the reasonably sound, physical first principles end (if you can even call them that since the 1 deg estimate is a theoretical calculation, anyway).

Most of the model-predicted warming people are worried about is not due to this 1 deg., which would likely be benign or even beneficial. It’s the additional 2 deg. or more of warming many models produce, which originates from highly uncertain positive feedbacks: how clouds, water vapor, and other features of the climate system change with warming, which then further amplify the warming.

Cloud Feedback

These positive feedbacks, if they even exist, are in effect what scare the wits out of people. You could “dial in” positive feedback just by (for example) making the average amount of low cloud in a model decrease slightly as the average temperature warms.

It’s not this simple, of course, but my point is that ‘worrisome warming’ is caused in the models by highly parameterized (i.e. simplified) and uncertain components buried deep amongst the models’ real physical principles. The physics involved in cloud formation are, for the most part, not included in climate models. Even cloud resolving models, which do “grow” clouds, depend upon uncertain parameterizations (e.g. the autoconversion threshhold).

So, what are the feedbacks in the real climate system? Unfortunately, they are notoriously hard to measure.

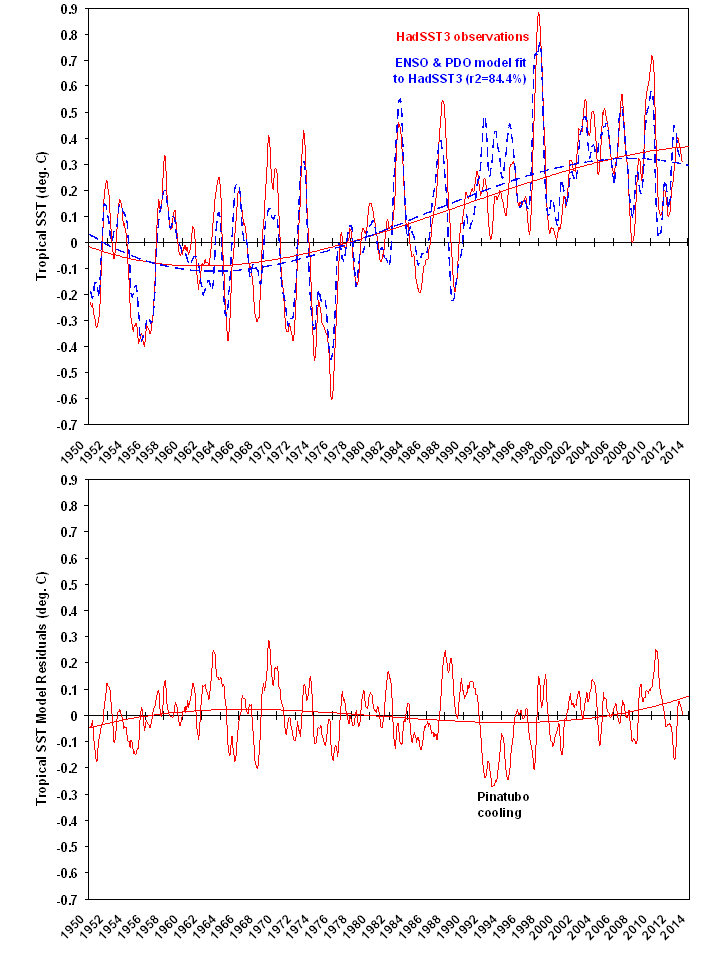
The main reason, I believe, is related to cause and effect. When we observe that natural warming events (say from El Nino) are typically associated with (say) fewer clouds, we don’t know whether the fewer clouds were caused by the warming (positive cloud feedback), or whether the fewer clouds are the cause of some of the warming, and negative feedback actually exists.

We have demonstrated that if fewer clouds cause warming, and then the warming causes more clouds (negative feedback), the net result still “looks like” positive cloud feedback. Dick Lindzen and co-authors have also published various results substantiating this view. Evidence for this is revealed by phase space analysis of the data, which goes beyond simple scatter plots which typically reveal very low correlations.

This is important because it shows that what climate modelers think is observational evidence for positive cloud feedback in the real climate system (which they then program into their climate models) is simply the result of sloppy and overly simplistic data analysis techniques.

Water Vapor Feedback

The other major feedback is water vapor, which approximately doubles the 1 deg of first principles warming in the models. Here the modelers believe they are on firmer ground than for cloud feedbacks, since there is plenty of observational evidence that warming is associated with more atmospheric water vapor, on average, in the lower troposphere, due to increased surface evaporation caused by warmer temperatures.

But even in the case of water vapor feedback, the situation might not be as simple as they believe. By far the biggest impact of water vapor on the Earth’s ability to cool itself is in the middle and upper troposphere, where it is precipitation processes – not surface evaporation — that determine the water vapor content.

Most of the air at these altitudes was detrained out of precipitation systems, which removed most of the vapor as precipitation. This is why the water vapor content at those altitudes is so low.

So, what determines the efficiency of precipitation systems? If warming increases their efficiency at removing vapor, there could be a slight drying of the middle and upper troposphere at the same time that the lower troposphere becomes more humid. The net result would be negative water vapor feedback, even though the total absolute amount of water vapor in the troposphere has increased (because a tiny decrease in upper tropospheric vapor causes more cooling than a large increase in lower tropospheric vapor causes warming).

This possibility is nothing new; it’s been known for decades (see an extended water vapor feedback discussion here). Long-term weather balloon data we have extending back to the 1950s actually shows lower tropospheric moistening and mid-tropospheric drying, at least suggesting the possibility that multi-decadal climate change involves negative, not positive, water vapor feedback. Miskolczi’s (2010) results of a constant greenhouse effect were basically due to the observed decrease in upper tropospheric water vapor exactly offsetting the greenhouse enhancement of increasing CO2 in the last 50 years.

The trouble is that we have very little knowledge of how the efficiency of precipitation systems changes with warming, and so climate models can’t even begin to address the physical principles involved.

Conclusion

These are just a few of the uncertainties involved in climate models’ predictions of non-trivial warming. Only the first 1 deg. of warming they produce can be considered to be from first principles, and even that is based upon a theoretical calculation.

Warming in excess of 1 deg., which is what people worry most about, is due to highly uncertain feedbacks. To the extent that the models agree on these feedbacks is probably more a reflection of group think on the part of the modelers, and the pressure they are under (political, financial, career, world-view, etc.) to produce results which support global warming as being a more than just a trivial concern for humanity.

One aspect of feedbacks I have been wondering about for years is related to their possible time-scale dependence. By way of analogy, we see positive feedbacks in the formation of weather systems, sometimes culminating in hurricanes or tornadoes. But these are ‘dissipational structures’, which concentrate energy only briefly as part of an overall process that ends up dissipating energy on longer time scales.

Might it be that some feedbacks in the climate system are indeed positive for short term (e.g. year-to-year) variability, but the long-term feedbacks end up being negative, as suggested (for example) by the decrease in upper tropospheric water vapor since the 1950s? If that is the case, the models should not be built to have long-term feedbacks based upon short-term data.

Ultimately, the question we have to answer is this: Do we really believe that nature amplifies any temperature influence humans have on the climate system, or minimizes it? For now, the IPCC is betting on amplification.

But when you are asked to believe the IPCC’s pronouncements about the serious threat of climate change, understand that the greater the model warming they point to, the more suspect is the underlying evidence. This ‘dubious’ component of model-predicted warming is caused by relative few lines of computer code –- the weak link in the chain — buried among thousands of lines of code which might otherwise be performing very realistically.

[NOTE for engineers: In climate parlance, positive feedbacks never overcome the climate stabilizing influence of the direct increase in infrared radiative cooling with temperature, called the Stefan-Boltzmann or Planck effect. So, in traditional engineering ‘feedback’ terms, even the IPCC’s climate models are stabilized by net negative feedback…the Planck effect just isn’t called a “feedback” by climate people. Sorry for the confusion…I didn’t make the rules.]

It’s Baaack. EcoEnquirer Interviews World’s Turtles First! Director

Sunday, September 29th, 2013

flying-turtlesMost people are not aware of the devastating impact global warming is having on the world’s turtles. In this exclusive EcoEnquirer interview, World’s Turtles First! Director Helga Chen discusses the latest IPCC report and WTF!‘s tireless efforts to help our short-legged friends.

IPCC: “We don’t need no stinking climate sensitivity!”

Friday, September 27th, 2013

stinking-climate-sensitivitty

IPCC Chairman Pachauri: “We don’t need no stinking climate sensitivity.”

The newly-released Summary for Policymakers of the IPCC’s Working Group I for the AR5 report reveals a dogged attempt to salvage the IPCC’s credibility amidst mounting evidence that it has gone overboard in its attempts to scare the global public over the last quarter century.

The recent ~15 year lull in warming is hardly mentioned at all (nothing to see here, move along).

A best estimate for climate sensitivity — unarguably THE most important climate change variable — is no longer provided, due to mounting contradictory evidence on whether the climate system really cares very much about whether there are 2, or 3, or 4, parts of CO2 per 10,000 parts atmosphere.

YET…the IPCC claims their confidence has DOUBLED (uncertainty reduced from 10% that 5%) regarding their claim that humans are most of the cause behind the warming trend in the last 50 years or so:

“It is extremely likely that human influence on climate caused more than half of the observed increase in global average surface temperature from 1951-2010.”

Let’s examine that last claim for a minute. For the sake of argument, let’s say that 60% of the surface warming (and increase in ocean heat content, as revealed by supposed warming of hundredths of a degree) is indeed due to increased CO2. What would that say about the sensitivity of the climate system?

One would think that this question would be addressed by the IPCC, since it doesn’t require a full-blown 3D climate model to answer.

But I suspect that they know the answer is: “very low climate sensitivity” (we will reveal more on this issue in a few weeks). Even if humans are responsible for 60% of the ocean heating in the last 60 years, it suggests a level of future warming well below what this report implies will happen.

I say “implies” because the new report is worded in such a way that the IPCC can be technically correct, and still convey a maximum amount of alarm (which has been the IPCC’s modus operandi for the last 20+ years). They still leave the door open to a climate sensitivity below 1 deg. C, since they could claim “we didn’t say we were 100% certain…only 95%”.

And probably the biggest omission of the report continues to be the almost total neglect of natural forcing mechanisms of climate change. The climate system is likely at least a little chaotic, with natural variations due to inherent system nonlinearities and time lags (courtesy of the ocean). As I keep harping on, the observed increase in ocean heat content over the last 60 years (if we can believe hundredths of a degree warming is accurate) equates to a global energy imbalance of only 1 part in 1,000. To believe that Mother Nature is incapable of causing such small imbalances, as the IPCC implicitly believes, is not based upon observations but upon assumptions.

What this means is that, without knowing just how much of recent warming is natural, there is no way to know how much is anthropogenic *nor* how sensitive the climate system is. This is a glaring source of uncertainty that the IPCC continues to gloss over, sweep under the rug, …pick your metaphor.

ENSO and PDO Explain Tropical Average SSTs during 1950-2013

Thursday, September 26th, 2013

As most of you are aware, the dominant mode of tropical climate variability is the El Nino Southern Oscillation (ENSO), comprised of El Nino (warm ENSO phase) and La Nina (cool ENSO phase) activity.

The IPCC has traditionally maintained that El Nino and La Nina activity effectively cancel each other out over time and so ENSO can’t cause multi-decadal time scale warming or cooling. Some of us think this is nonsense, since we know that there are ~30 year periods when El Ninos are stronger, then ~30 year periods when La Nina is stronger.

So, what does 30 year natural climate change have to do with long-term anthropogenic global warming? Well, AGW is can only explain warming over the last 60 years or so, because there weren’t appreciable greenhouse gas emissions before then. And it just so happens that the last 60 years was comprised of 30 years of stronger La Ninas (cool conditions) followed by 30 years of stronger El Ninos (warm conditions). So, it is only “natural” that some recent papers have (finally!) begun to explore the potential role of natural climate fluctuations in explaining at least some of recent warming (or lack thereof).

While our forthcoming paper will address this in a more physically consistent manner, here I will continue this theme by showing just how easy it is to statistically explain tropical sea surface temperature (SST) variations since 1950 with natural modes of climate variability. This is not an entirely new or novel idea, and if someone else has done something very close to the following, consider this independent verification of their calculations. 😉

You can use statistical linear regression (I did it within Excel, the spreadsheet is here) to explain 5-month running average tropical HadSST3 variations as a linear combination of the Multivariate ENSO Index (MEI), the cumulative MEI index since 1950, and the cumulative Pacific Decadal Oscillation (PDO) index since 1950. The original HadSST3 data, and the model fit are shown in the first panel of the following figure, and the model residuals are shown in the second panel (click for larger version; fitted curves are 3rd order polynomials):
HadSST3-tropics-vs-reg-model

Note the largest excursion in the model residuals (variations the model can’t explain, 2nd panel) is the cooling caused by the Mt. Pinatubo eruption. The linear trends in the observed and model-fitted SSTs are essentially identical.

Of course, the most important (and controversial) aspect of this exercise is explaining the warming trend in terms of the time-accumulation of the MEI index, which would be more than just a statistical artifact *if* persistent La Nina’s early in the record are associated with a net loss of deep-layer ocean thermal energy, and persistent El Nino’s later in the record are associated with a net gain of heat by the ocean. Our paper published next month will show the evidence that this, indeed, happens. The third term in the model equation (time accumulated PDO index) has a smaller influence than the accumulated MEI term, by about a factor of 2.3.

Of course, being a statistical exercise, the above results are far from proof that nature explains everything. From a theoretical perspective, I would expect that increasing CO2 should have some non-zero warming influence.

But as I have mentioned before, the rate of rise in ocean heat content since the 1950s corresponds to only a 1 in 1,000 imbalance in the radiative energy budget of the Earth (~0.25 W/m2 out of ~240 W/m2).

The IPCC’s belief that nature keeps the climate system energy-stabilized to better than 1 part in 1,000 is a matter of faith, not of physical “first principles”.

On Changing ENSO Conditions: The View from SSM/I

Tuesday, September 24th, 2013

Yesterday I posted time series since 1987 of global average oceanic water vapor, surface wind speed, cloud water, and rain rate from the SSM/I and SSMIS instruments. Those plots show the global-average influence of El Nino and La Nina activity.

Today I will show the gridpoint linear trends from those products for the period July 1987 through last Saturday (21 September 2013). The first one (upper left corner) is similar to the one Frank Wentz has at the Remote Sensing Systems website, and shows gridpoint trends in vertically integrated vapor since July 1987 (click for large version):
SSMI-ocean-product-trends-1987-2013

The major patterns shown in these plots are classic La Nina-type patterns, with atmospheric moisture being pushed more towards the western Pacific basin in recent years. The trends reflect the change from stronger El Nino activity over the first ~2/3 of the SSM/I period of record to more La Nina type activity recently.

The recent change from stronger El Nino to stronger La Nina conditions is revealed in monthly Multivariate ENSO Index (MEI) data since 1950…which is also related to the Pacific Decadal Oscillation (PDO, some researchers consider the PDO to be a low-frequency modulation of El Nino and La Nina activity):
MEI-1950-2013
The second panel in the above plot shows the time-cumulative values of MEI since 1950, which is good for seeing the ~30 year periods when one or the other regime persists. (This is nothing new…I and others have pointed this out before).

Of significance to the current ‘global warming hiatus’ issue is the observation that we might have now entered into a new La Nina-dominant phase. In the previous plot, imagine if we repeat the 1950s-1970s period…such a scenario could well lead to a 25- or 30-year period of no warming — or even cooling — just as was experienced up until the 1970s.

But what is different now is the radiative forcing from more CO2 in the atmosphere. Depending upon how sensitive the climate system is, the long-term warming trend from extra CO2 will be superimposed upon the cooling influence of stronger La Nina activity. If the IPCC has overestimated climate sensitivity (which I believe they have), then very weak warming or even flat temperatures could prevail for the next 25-30 years. (Yes, I know I seldom mention solar activity, which I still consider very speculative. But I admit to being under-informed on the issue, so you can probably ignore my opinions on it.)

The fact that it has taken so long for the mainstream climate research community to ‘discover’ the importance of ENSO to multi-decadal climate is very troubling to me. There is no other explanation for them not seeing what was staring them in the face, except the political influence the IPCC and its supporters in government have had on the climate research community, in effect paying them to downplay the role of natural climate variations until nature could no longer be ignored.

Global SSM/I Ocean Product Suite Since 1987

Monday, September 23rd, 2013

Our satellite passive microwave radiometer assets have really advanced since the launch of the first Special Sensor Microwave/Imager (SSM/I) in 1987. The SSM/I and SSMIS have been providing global oceanic measurements of surface wind speed, total atmospheric water vapor, total cloud water, and rain rates, since mid-1987.

Frank Wentz and his homies at Remote Sensing Systems have produced intercalibrated ocean products from these sensors and post those products (in binary form, not for the weak of heart) at their ftp server. I’ve downloaded the archive of weekly averages from the separate satellites (you can also get daily and monthly), combined the separate satellites when more than one is operating, and computed weekly anomalies.

Here are the average annual cycles for the 4 products. Note there is little seasonal variations when the oceans are globally averaged:
SSMI-weekly-ocean-products-cycles

Next are the global anomaly time series since July 1987 (departures from the 27-year average weekly cycle, in percent) through Saturday, September 21, 2013.

WATER VAPOR: The vertically-integrated water vapor variations follow sea surface temperature variations rather closely, including moistening during El Nino and drying during La Nina, and support other datasets showing warming until the 1998-2002 time period, then leveling off:
SSMI-weekly-ocean-products-vapor-2013-38

WIND SPEED: Wind speeds tend to decrease during El Nino events and increase during La Nina. I’ll leave it to you to determine whether there has been a recent increase in wind speed which might support Trenberth’s view that increased surface winds have increased ocean mixing and thereby increased the rate of heat storage in the deep ocean:
SSMI-weekly-ocean-products-wind-2013-38

CLOUD WATER:Cloud water tends to increase during El Nino and decrease during La Nina. Also, I’ve previously found from AMSR-E cloud water retrievals that these anomalies correlate positively with CERES reflected sunlight anomalies, so positive values should suggest a cooling influence compared to average:
SSMI-weekly-ocean-products-cloud-2013-38

RAIN RATE:Like water vapor and cloud water, the rain rate anomalies tend to be higher during El Nino and lower during La Nina.
SSMI-weekly-ocean-products-rain-2013-38

The largest and most coherent anomaly patterns will show up during El Nino or La Nina, but right now we are in neutral conditions, so not much is happening. If there is sufficient interest I can provide weekly updates of these plots every week or two (if I’m in town) up through the previous Saturday.

Here’s an Excel spreadsheet with the anomaly time series data from the above 4 plots…please don’t download unless you plan on doing something with the data: SSMI_weekly_global_anoms_60N-60S_percent.

Here are high spatial resolution product examples for the global oceans from today (morning passes from the DMSP F17 satellite SSMIS).

Hurricane Outlooks: An Exercise in Futility?

Saturday, September 21st, 2013

hurricane-climatology
I believe it was either the hyper-hurricane season of 2005, or the hurricane-drought year of 2006, when my sister living the the Florida Keys complained that the National Hurricane Center shouldn’t even be making seasonal outlooks of hurricane activity.

I defended the NHC outlooks, saying that they do, after all, have some small level of skill. But with this year’s hurricane season shaping up to be another ‘drought’ when ‘floods’ of hurricanes were forecast, I’m beginning to think she had a point. Even if there is “some” skill in forecasting how many hurricanes will form in the entire Atlantic basin, there is no way to know weeks or months in advance where they will hit land, if at all.

In my sister’s case, she and her husband built a nearly hurricane-proof house in Summerland Key, and they were pummeled relentlessly in 2005. Thinking that they needed a safer place to park their sailboat when hurricane season arrives, they then built another coastal house in North Carolina, well west of Cape Hatteras safely tucked up in Pamlico Sound.

Well, guess what happened? Hurricanes stopped hitting the Keys…and instead a hurricane nailed their NC house. So much for planning in advance.

Now, I don’t really think the NHC will ever stop making hurricane season outlooks. I have been told the apparently true story of an U.S. Army Air Force general in World War II who needed a weather forecast weeks in advance, but was told the forecast would have no skill. The general understood that, but needed the forecast “for planning purposes” anyway.

Maybe we can say the same thing about economic forecasts, which also have little skill. People know that have little skill, but make decisions based upon them anyway.

And let’s not forget the IPCC’s super-long-range forecasts of global warming, or climate change, or climate disruption, or whatever they are calling it these days.

I gave an invited talk at a conference of economists a couple years ago, and was struck by how well those on opposite sides of the economic philosophy spectrum got along with each other. I mentioned how antagonistic climate alarmists and skeptics are to one another, and asked why the economists managed to get along so well? I was told that they had all been proved wrong so many times that they had been sufficiently humbled by their experiences.

I can only hope that we are seeing the beginnings of something similar in the climate research community. We skeptics have been saying for years, in effect, “you know, we really don’t know enough about the response of the climate system to be predicting what adding 1 or 2 molecules of CO2 to 10,000 molecules of air is going to do, if anything.”

Warming has stopped. Who would have ever predicted that — except a skeptic?

The IPCC admits they have little confidence in how hurricanes might change with warming. No measures of severe weather, with the possible exception of locally heavy rainfall, have been demonstrated to have changed with warming.

Like hurricane activity, what we can be sure of is that every year, more likely than not, will be different than the previous year. The U.S. will see record warmth one year, then record cold the next. Weather will change, and climate will change.

What direction will it change? Well, you can either spend billions of coins on research to find out, or you can flip one of those coins. The level of skill might well be about the same.

But who needs skill? We need forecasts and outlooks and projections…”for planning purposes”.

Ocean Products from th’ SSM/I

Thursday, September 19th, 2013

SSMI
What better tide t’ introduce many o’ ye t’ passive microwave ocean products than on national Speak Like a Pirate Day?

I reckon well when I be jus’ a young researcher how I voyagened fer th’ launch o’ th’ first SSM/I (Special Sensor Microwave/Imager), which started providin’ data in th’ moon o’ July 1987.

‘t carried th’ first high frequency microwave channel, 85.5 GHz, thanks t’ Dick Savage, a student o’ Jim Weinman`s (UW-Madison). Dick an’ Jim had figured ou’ that microwave frequencies above 60 GHz ortin’ ta be able t’ observe “cold” (low-emissivity) microwave signatures from thunderstorms, snow, an’ other volume scatterers. An’ they be correct!

An’, aye, Dick Savage be as colorful as his name suggests.

Th’ SSM/I also had a better calibration design than th’ previous SMMR (Scannin’ Multichannel Microwave Radiometer) instrument, which provided sea ice data aft t’ 1979.

Thar would be a series o’ SSM/I`s, built by Hughes Aircraft, followed by th’ SSMIS`s built by Aerojet (aye, confusin’ names, I know). Most o’ th’ current sea ice products ye be seein’ on th’ web be from SSM/I an’ ’tis follow-on, th’ SSMIS.

Anyway, th’ “ocean product suite” o’ ocean surface winds an’ atmospheric vertically integrated water vapor, cloud water, an’ precipitation, ben produced by Frank Wentz an’ his mates at Remote Sensin’ Systems, in Santa Rosa, California. Sea surface temperatures would only be added in mid-2002 wi’ th’ low-frequency 6.9 GHz channel on AMSR-E, th’ instrument fer which I serve as th’ U.S. Science Team leader.

In me opinion, Frank has done more fer th’ interpretation o’ satellite passive microwave measurements than any other single swabbie in me business. He an’ I dasn’t always agree on science (or politics or religion), but he be a national booty in our research community, an’ I consider th’ lad’s a good matey.

I hope t’ start providin’ weekly updates o’ th’ RSS ocean products soon, in th’ form o’ departures from average conditions (anomalies) as well as th’ raw fields, so stay tuned, ya lily livered scallywags!

Pat Michaels Bets $$ on 25 Years of No Warming

Wednesday, September 18th, 2013

global-warming-challenge

This is not Pat Michaels.

As a result of my post yesterday (A Turning Point for the IPCC…and Humanity?), I became aware of a pending bet between Pat Michaels and Scott Supak (a self described progressive environmentalist) regarding the future course of global temperatures.

After exchanging e-mails with both Pat and Scott, you can consider this post as the official announcement of the bet:

Dr. Michaels is betting on no statistically significant warming (at the 95% confidence level) in the HadCRUTx data for the 25 year period starting in 1997. Scott is betting on at least that much warming.

Scott doesn’t want to bet more than $250 (he says he likes to spread his betting $$ around), so the potential value of the embarrassment to the loser is probably worth much more than $250 will buy in early 2022. 😉

I find this a rather bold bet for Pat to make, because based upon my calculations he could still lose and have the observed warming trend below ALL 90 of the CMIP5 climate model forecasts we have examined for global average surface temperature for the period 1997 through 2021, inclusive. [The model with the least warming of the 90 during 1997-2021 has only +0.048 deg. C/decade warming; current HadCRUT4 observations since 1997 stands at just over +0.04 deg. C/decade; max model warming is +0.400 deg. C/decade.] But maybe Pat has a better method of computing the statistical significance than I do…I’ll let Pat and Scott work that out.

I just noticed that the range of model trends ALSO means that ALL of the 90 models predict that warming will accelerate from the currently observed warming trend since 1997.

I’m also in discussions with Scott over betting on a trend that would be 1 standard deviation below the average model warming, which would be +0.162 deg. C/decade for 1997-2021, compared to the 90-model average of +0.226 deg. C/decade. He laid down the gauntlet, not me. I try not to forecast future temperatures…too much like betting on a roll of the dice.

If Pat wins, Scott will pay $250 to the Organization for Autism Research. If Scott wins, Pat will pay $250 to the Climate Science Legal Defense Fund.

A Turning Point for the IPCC…and Humanity?

Tuesday, September 17th, 2013

A climate modeler increasing his model's climate sensitivity

A climate modeler increasing his model’s sensitivity.

I usually don’t comment on recently published climate research papers, partly because they rarely add much, and partly because other blogs do a pretty good job of covering them anyway. The reason why I say “they rarely add much” is that there are a myriad of theories that can be justified with some data, but rarely is the evidence convincing enough to hang your hat on them.

One of the things I’ve learned in the climate research business is that it is really easy to be wrong, and really difficult to be right. There are many competing theories of what causes climate change, and they can’t all be correct.

But recent events are quite exceptional. A few recent papers on climate sensitivity, and on the previously under-appreciated role of natural climate variations, and the apparent backing-off by the IPCC on climate sensitivity in the upcoming AR5 report, now warrants a few comments from me. (We also have our own paper, slated to be published on October 31, which will present new results on climate sensitivity and the role of natural climate variations in recent warming.)

By way of background, I have always been convinced that the IPCC was created by bureaucrats to achieve specific policy ends. I was even told so by one of those bureaucrats, Bob Watson, back in the early 1990s. Not that there aren’t ‘true believers’ in the movement. In my experience, the vast majority of the scientists and politicians involved in the IPCC process appear to really believe they are doing what is right for humanity by supporting restrictions on fossil fuel use.

But now, with the IPCC unable to convincingly explain the recent stall in warming (some say a change to weak cooling), the fact that they are forced to actually recognize reality and make changes in their report — possibly reducing the lower bound for future warming, thus reducing the range of climate sensitivity — is quite momentous.

It might well be that so widespread is the public knowledge of the hiatus in warming, recovering Arctic sea ice (at least temporarily), continuing expansion of Antarctic sea ice, failed predictions of previous IPCC reports, etc., are forcing them to do something to save face. Maybe even to keep from being de-funded.

For the last 10-20 years or more, a few of us have been saying that the IPCC has been ignoring the elephant in the room…that the real climate system is simply not as sensitive to CO2 emissions as they claim. Of course, the lower the climate sensitivity, the less of a problem global warming and climate change becomes.

This elephant has had to be ignored at all costs. What, the globe isn’t warming from manmade CO2 as fast as we predicted? Then it must be manmade aerosols cooling things off. Or the warming is causing the deep ocean to heat up by hundredths or thousandths of a degree. Any reason except reduced climate sensitivity, because low climate sensitivity might mean we really don’t have to worry about global warming after all.

And, if that’s the case, the less relevant the IPCC becomes. Not good if your entire professional career has been invested in the IPCC.

But forecasting the future state of the climate system was always a risky business. The Danish physicist, Niels Bohr, was correct: “Prediction is very difficult, especially about the future.”

Unlike daily forecasts made by meteorologists, the advantage to climate prognosticators of multi-decadal forecasts is that few people will remember how wrong you were when your forecast finally goes bust.

Yet, here we are, with over 20 years of forecasts from the early days of climate modelling, and the chickens are finally coming home to roost.

I’m sure the politicians believed we would have had new energy policies in place by now, in which case they could have (disingenuously) claimed their policies were responsible for global warming “ending”. Not likely, since atmospheric CO2 continues to increase, and even by the most optimistic estimates renewable energy won’t amount to more than 15% of global energy generation in the coming decades.

But it’s been nearly 20 years since Al Gore privately blamed us (now, the UAH satellite temperature dataset) for the failure of his earliest attempt at CO2 legislation. Multiple attempts at carbon legislation have failed. The lack of understanding of basic economic principles on the part of politicians and scientists alike led to the unrealistic expectation that humanity would allow the lifeblood of the global economy — inexpensive energy — to be restricted.

Of course, in the U.S. we still have the EPA as a way to back-door policies some politicians desire, without having to go through the inconvenience of our elected representatives agreeing.

But, I digress. My main point is that nothing stands in the way of a popular theory (e.g. global warming) better than failed forecasts. We are now at the point in the age of global warming hysteria where the IPCC global warming theory has crashed into the hard reality of observations. A few of us are not that surprised, as we always distrusted the level of faith that climate modelers had in their understanding of the causes of climate change.

I continue to suspect that, in the coming years, scientists will increasingly realize that more CO2 in the atmosphere is, on the whole, good for life on Earth. Given that CO2 is necessary for life, and that nature continues to gobble up 50% of the CO2 we produce as fast as we can produce it, I won’t be that surprised when that paradigm shift occurs, either.