On Changing ENSO Conditions: The View from SSM/I

September 24th, 2013 by Roy W. Spencer, Ph. D.

Yesterday I posted time series since 1987 of global average oceanic water vapor, surface wind speed, cloud water, and rain rate from the SSM/I and SSMIS instruments. Those plots show the global-average influence of El Nino and La Nina activity.

Today I will show the gridpoint linear trends from those products for the period July 1987 through last Saturday (21 September 2013). The first one (upper left corner) is similar to the one Frank Wentz has at the Remote Sensing Systems website, and shows gridpoint trends in vertically integrated vapor since July 1987 (click for large version):
SSMI-ocean-product-trends-1987-2013

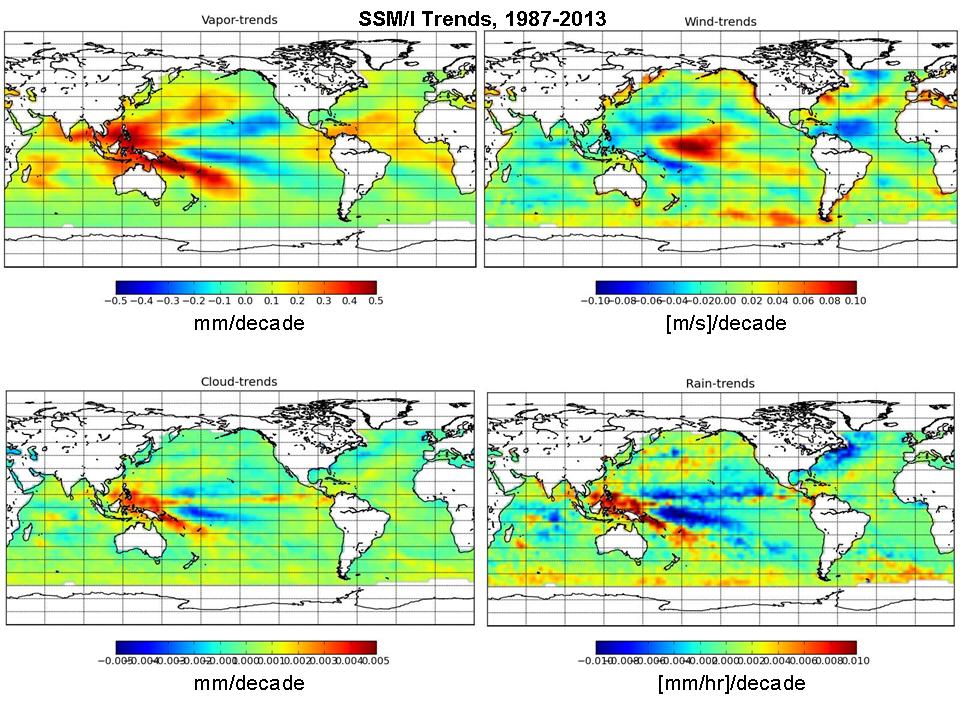
The major patterns shown in these plots are classic La Nina-type patterns, with atmospheric moisture being pushed more towards the western Pacific basin in recent years. The trends reflect the change from stronger El Nino activity over the first ~2/3 of the SSM/I period of record to more La Nina type activity recently.

The recent change from stronger El Nino to stronger La Nina conditions is revealed in monthly Multivariate ENSO Index (MEI) data since 1950…which is also related to the Pacific Decadal Oscillation (PDO, some researchers consider the PDO to be a low-frequency modulation of El Nino and La Nina activity):
MEI-1950-2013
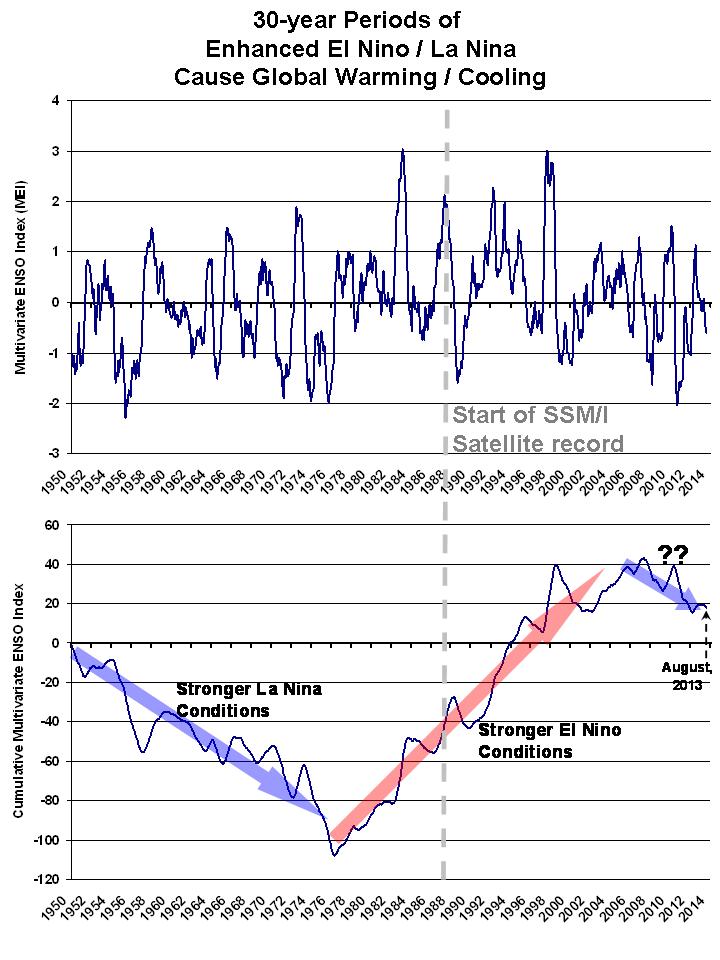
The second panel in the above plot shows the time-cumulative values of MEI since 1950, which is good for seeing the ~30 year periods when one or the other regime persists. (This is nothing new…I and others have pointed this out before).

Of significance to the current ‘global warming hiatus’ issue is the observation that we might have now entered into a new La Nina-dominant phase. In the previous plot, imagine if we repeat the 1950s-1970s period…such a scenario could well lead to a 25- or 30-year period of no warming — or even cooling — just as was experienced up until the 1970s.

But what is different now is the radiative forcing from more CO2 in the atmosphere. Depending upon how sensitive the climate system is, the long-term warming trend from extra CO2 will be superimposed upon the cooling influence of stronger La Nina activity. If the IPCC has overestimated climate sensitivity (which I believe they have), then very weak warming or even flat temperatures could prevail for the next 25-30 years. (Yes, I know I seldom mention solar activity, which I still consider very speculative. But I admit to being under-informed on the issue, so you can probably ignore my opinions on it.)

The fact that it has taken so long for the mainstream climate research community to ‘discover’ the importance of ENSO to multi-decadal climate is very troubling to me. There is no other explanation for them not seeing what was staring them in the face, except the political influence the IPCC and its supporters in government have had on the climate research community, in effect paying them to downplay the role of natural climate variations until nature could no longer be ignored.


48 Responses to “On Changing ENSO Conditions: The View from SSM/I”

Toggle Trackbacks

  1. Old News.

    Here you go:

    “So, to be able to monitor and predict changes in global temperature we need more than information about the past, current and expected future level of solar activity.

    We also need to identify all the separate oceanic cycles around the globe and ascertain both the current state of their respective warming or cooling modes and, moreover, the intensity of each, both at the time of measurement and in the future.

    Once we have a suitable formula I believe that changes in global temperature will no longer be a confusing phenomenon and we will be able to apportion the proper weight to other influencing factors such as the greenhouse effect of CO2.

    At the moment the weight given to the effect of CO2 in the models is just a guess.”

    from here:

    http://www.newclimatemodel.com/the-real-link-between-solar-energy-ocean-cycles-and-global-temperature/

    Published by Stephen Wilde May 21, 2008

  2. Then, just suppose that solar variations alter global cloudiness and the amount of solar energy entering the oceans so as to skew the balance between El Nino and La Nina events throughout the millennial solar cycle from MWP to LIA to date.

    Looks good to me.

  3. What I can not understand is the obvious solar link to a –AO/-NAO atmospheric circulation pattern at times of very low solar activity with feeble amounts of EUV light being directed toward earth.

    This pattern while warming the Arctic regions of the N.H. will create overall cooling for the N.H. as a whole.

    So obvious to me.

  4. Steve Spiller says:

    Roy – Was there an ENSO index prior to 1950?

  5. Hops says:

    On the subject of political influence, my understanding of the IPCC is that it has representatives from all the U.N. countries including Russia and all of OPEC. The complaint I usually hear is that the fossil fuel exporters try to err on the side of lower impact from CO2.

    No?

  6. Bill Sparling says:

    Dr. S,
    Slightly off topic, but the following artical appeared int eh media today. Seems the usual suspects, supported by a complicit media, are determined to just keep pushing this failed hypothesis at us. Would appreciate your thoughts on this.
    Regards
    Bill Sparling

    Scientists liken certainty of global warming to deadliness of smoking

    http://www.ctvnews.ca/sci-tech/scientists-liken-certainty-of-global-warming-to-deadliness-of-smoking-1.1468879#ixzz2fqNJ9Eym

    WASHINGTON — Top scientists from a variety of fields say they are about as certain that global warming is a real, man-made threat as they are that cigarettes kill.

    They are as sure about climate change as they are about the age of the universe. They say they are more certain about climate change than they are that vitamins make you healthy or that dioxin in Superfund sites is dangerous.

    They’ll even put a number on how certain they are about climate change. But that number isn’t 100 per cent. It’s 95 per cent.

    And for some non-scientists, that’s just not good enough.

    There’s a mismatch between what scientists say about how certain they are and what the general public thinks the experts mean, experts say.

    That is an issue because this week, scientists from around the world have gathered in Stockholm for a meeting of a U.N. panel on climate change, and they will probably issue a report saying it is “extremely likely” — which they define in footnotes as 95 per cent certain — that humans are mostly to blame for temperatures that have climbed since 1951.

    One climate scientist involved says the panel may even boost it in some places to “virtually certain” and 99 per cent.

    Some climate-change deniers have looked at 95 per cent and scoffed. After all, most people wouldn’t get on a plane that had only a 95 per cent certainty of landing safely, risk experts say.

    But in science, 95 per cent certainty is often considered the gold standard for certainty.

    “Uncertainty is inherent in every scientific judgment,” said Johns Hopkins University epidemiologist Thomas Burke. “Will the sun come up in the morning?” Scientists know the answer is yes, but they can’t really say so with 100 per cent certainty because there are so many factors out there that are not quite understood or under control.

    George Gray, director of the Center for Risk Science and Public Health at George Washington University, said that demanding absolute proof on things such as climate doesn’t make sense.

    “There’s a group of people who seem to think that when scientists say they are uncertain, we shouldn’t do anything,” said Gray, who was chief scientist for the U.S. Environmental Protection Agency during the George W. Bush administration. “That’s crazy. We’re uncertain and we buy insurance.”

    With the U.N. panel about to weigh in on the effects of greenhouse gas emissions from the burning of oil, coal and gas, The Associated Press asked scientists who specialize in climate, physics, epidemiology, public health, statistics and risk just what in science is more certain than human-caused climate change, what is about the same, and what is less.

    They said gravity is a good example of something more certain than climate change. Climate change “is not as sure as if you drop a stone it will hit the Earth,” Princeton University climate scientist Michael Oppenheimer said. “It’s not certain, but it’s close.”

    Arizona State University physicist Lawrence Krauss said the 95 per cent quoted for climate change is equivalent to the current certainty among physicists that the universe is 13.8 billion years old.

    The president of the prestigious National Academy of Sciences, Ralph Cicerone, and more than a dozen other scientists contacted by the AP said the 95 per cent certainty regarding climate change is most similar to the confidence scientists have in the decades’ worth of evidence that cigarettes are deadly.

    “What is understood does not violate any mechanism that we understand about cancer,” while “statistics confirm what we know about cancer,” said Cicerone, an atmospheric scientist. Add to that a “very high consensus” among scientists about the harm of tobacco, and it sounds similar to the case for climate change, he said.

    But even the best study can be nitpicked because nothing is perfect, and that’s the strategy of both tobacco defenders and climate deniers, said Stanton Glantz, a medicine professor at the University of California, San Francisco and director of its tobacco control research centre.

    George Washington’s Gray said the 95 per cent number the Intergovernmental Panel on Climate Change will probably adopt may not be realistic. In general, regardless of the field of research, experts tend to overestimate their confidence in their certainty, he said. Other experts said the 95 per cent figure is too low.

    Jeff Severinghaus, a geoscientist at the Scripps Institution of Oceanography, said that through the use of radioactive isotopes, scientists are more than 99 per cent sure that much of the carbon in the air has human fingerprints on it. And because of basic physics, scientists are 99 per cent certain that carbon traps heat in what is called the greenhouse effect.

    But the role of nature and all sorts of other factors bring the number down to 95 per cent when you want to say that the majority of the warming is human-caused, he said.

    • Roy Spencer says:

      There are so many things wrong with making this comparison it is hard to know where to begin. It shows an utter lack of knowledge of the science, of basic economics, of costs/benefits, of statistics… ugh.

      • TonyB says:

        Roy,

        I’m sorry but I can’t let your “utter lack of knowledge of the science” go without a comment. As my take on what you mean seems to be the same as I hear from the die-hard, ideologically challenged, Google-armed fanatic I generally have the pleasure of “discussing” the science with.

        Let me get this right – You are saying the IPCC has an “utter lack of knowledge of the science”?

        • Lewis Guignard says:

          Dr. Spencer might not but Ms. Donna Laframboise will.

          See this link: http://online.wsj.com/article/SB10001424127887323981304579079030750537994.html

          From today’s Wall Street Journal.

        • Bill Sparling says:

          I suspect that he was refering to the author of the newspaper article. (But we already know the media types have no clue when it comes to science anyway.) As for the IPCC, having reviewed many of their documents, I noticed that James Hogan was correct some years ago when he pointed out that the majority of “scientists” who signed off on it were not climatologists (or related “material” scientists) but came from a diverse group of political “scientists”, linguists, and the like. Just another reason to be suspicious…

    • JJ says:

      That is a textbook strawman argument.

      Skeptics don’t complain that 95% certainty isn’t good enough.

      We complain that the prior claim of 90% certainty was a number pulled out of their collective rectum, and was unsupported by facts and logic. It definitely was not a calculated statistic based on probabilities derived from quantified data (as the danger of smoking was). It was a made up number.

      The current claim of 95% certainty is nothing more than BS doubling down on a lie. The worse their models perform against the observations, the higher their public claims of “certainty” become.

      Whatever number they assign to their “certainty” is political twaddle, a wholey fabricated number that has no scientific meaning. And that is why it is not enough, and will never be enough, whatever they claim it to be.

    • Threepwood says:

      99.9% of paranormal investigators believe in ghosts, and they should know, they’re the experts!

  7. steve says:

    Didn’t another experiment a few weeks ago show more support for svensmark’s cosmic ray theory ? Here is a man whose predictions are coming true in lab experiments and world temperature observation. If things continue to this way and his theories prove correct he deserves nobel prize.

  8. steve says:

    95 percent confidence based on the particular group of scientists you ask. Smoking statistics are based on daya from thousands of smokers. We have one earth. This is what makes the climate change problem quite a bit more difficult.

    • Roy Spencer says:

      exactly.

    • londo says:

      But what makes the problem nearly impossible to solve is the sectarianism in this (so called) science. If climate science was about finding out how climate really works, people with opposing views would try extract as much as possible from each other. Now, most the business is to try to silence those with opposing views.
      Good example of this is McLean et.al. 2009 and the events that followed.

  9. See here for ENSO data back to 1900:

    http://jisao.washington.edu/pdo/

    There have been reconstructions from proxy data going back hundreds of years but they are unreliable as to the net relationship at any given time between El Nino and La Nina and the further back one goes the less reliable is any relationship with solar activity.

    With our current, modern sensors we now have a means of ascertaining more accurately any link between solar activity and the balance between El Nino and La Nina.

    Nonetheless it might still be tricky separating out any current solar effect from the 60 year PDO which is I think primarily an internal oceanic feature.

    We are currently in a negative PDO which implies La Nina dominating over El Nino for a while as Roy points out.

    The quiet sun with increased global cloudiness should soon start to supplement the dominance of La Nina over and above that expected from the basic 60 year cycle.

    The time lags for solar effects on the oceans appear to be in the region of 10 to 15 years so only now should we begin to expect something significant to begin.

    The current record Antarctic ice and the possible start of an Arctic ice recovery may be useful pointers if maintained.

    • Hops says:

      When you say “record Antarctic ice” are you talking about volume or extent?

      My understanding is that volume is decreasing, while melted fresh water on the surface and strong winds are expanding extent.

      • Hops,

        Please provide support for the suggested decrease in Antarctic sea ice volume and evidence as to whether any decline in volume offsets the increase in extent.

        • Hops says:

          http://www.ncbi.nlm.nih.gov/pubmed/23086145

          http://www.bbc.co.uk/news/science-environment-21991487

          Climate change is expanding Antarctica’s sea ice, according to a scientific study in the journal Nature Geoscience.

          The paradoxical phenomenon is thought to be caused by relatively cold plumes of fresh water derived from melting beneath the Antarctic ice shelves.

          This melt water has a relatively low density, so it accumulates in the top layer of the ocean.

          The cool surface waters then re-freeze more easily during Autumn and Winter.

          • Roy Spencer says:

            If so, it sounds like a negative feedback mechanism to me. But somehow more melting ice causing more ice to form sounds a little contradictory.

          • Hops says:

            I didn’t quote the first reference, but just to be clear, it seems from that analysis that the Antarctic is losing ice volume, despite the change in extent.

            “we estimate a continent-wide ice-mass change of -69 ± 18 Gt yr(-1)”

            The likely connection between loss of volume and increase in extent is that cold freshwater runoff stays on the sea surface and freezes much more readily than warmer salt water.

          • Hops, I found this in one of your links:

            “We resolve 26 independent drainage basins and find that Antarctic mass loss, and its acceleration, is concentrated in basins along the Amundsen Sea coast. Outside this region, we find that West Antarctica is nearly in balance and that East Antarctica is gaining substantial mass.”

            So we have record extent for sea ice and a substantial mass gain for ice on land.

            Why do you think sea ice volume matters?

            East Antarctica is a big place.

          • ren says:

            The increase of ice determines the temperature in the stratosphere polar vortex. Since August takes blockade over the South Pole and the ice is not incremented.
            http://arctic.atmos.uiuc.edu/cryosphere/antarctic.sea.ice.interactive.html

          • Martinitony says:

            If fresh water runoff causes greater sea ice area down there, then how come we don’t have the same phenomena around Greenland?

    • Greg Mendel says:

      Steven,

      It appears that you don’t even understand the ice statistics you are talking about.

      Sea ice extent seems to be a favorite stat to cherry pick these days, especially in the antarctic, but this year in the arctic too.

      For those who actually want to learn something:

      * There are two measures of ice being thrown around here: extent and volume. Volume tells you how much ice there is, extent tells you how much area the ice covers. If you spill paint on the floor, as it spreads out, the extent will grow, but the volume will stay the same.

      * In the Antarctic there are two kinds of ice: land ice and sea ice. The land ice is measured in volume because the extent doesn’t change. The sea ice can be measured in either extent or volume, but measuring the volume is hard because you need to know how thick the ice is in addition to how much area it is covering. The extent is relatively easy to measure from satellites.

      * In the Antarctic, there is MUCH more land ice than sea ice. A recent estimate is 26 million cubic kilometers of land ice. If all this ice melted it would raise the sea level by something like 50 meters (but it won’t any time soon). On the other hand, the record sea ice extent is around 19 million square kilometers (note the difference between square and cubic kilometers). Since the Antarctic ice averages only around a meter thick, this means there is still around 1500 times more land ice than sea ice in the Antarctic when the sea ice is at a max. Much of the sea ice in the Antarctic melts in the southern summer.

      * The Antarctic is losing land ice volume. One estimate from satellites is around 69 cubic km per year.

      * In the Arctic there is no land, so there is only sea ice which can again be measured by extent (or area) or volume (total amount). Both measures have been declining steadily and 2012 was a record low for both. The minimum extent this year was about the same as 2009 (the 6th lowest recorded), while the volume was closer to the 2012 level (4th lowest recorded and below all years prior to 2010).

      • Bill Sparling says:

        RADARSAT2’s raw data on MULTI-YEAR sea ice in the Arctic shows a growth in both surface area and thickness (corresponding to volume) the recent arctic cyclone broke up some of the multi-year sea ice and most of the annual ice into smalled ice pans which are being moved by the prevailing currents. Some commentators are taking this as proof of the loss of all arctic ice. Speaking with people who live and work on the ice, they state that the ice pack is growing in area and thickness, re-establishing itself.

        You can obtain the RADARSAT2 data from Natural Resources Canada through an Access to Information request. It takes about 4 weeks and you will recieve in on a Data DVD.

  10. ren says:

    Dr Roy Spencer to understand the scale of climate change associated with solar activity is useful to compare the growth of cosmic rays in the cycle and predicted with high accuracy by Vukcevic magnetic activity of the Sun (as opposed to completely wrong predictions NASA).
    http://cosmicrays.oulu.fi/webform/query.cgi?startday=01&startmonth=01&startyear=1964&starttime=00%3A00&endday=25&endmonth=09&endyear=2013&endtime=00%3A00&resolution=Automatic+choice&picture=on
    http://www.vukcevic.talktalk.net/LFC6.htm

  11. gordie says:

    It is getting cool at night in the Northern Hemisphere…

    “Lucy awakens and notices that Linus is not in his bed.
    She finds her brother asleep in the pumpkin patch, shivering.
    She brings him home, takes off his shoes, and puts him to
    bed. Later Charlie Brown attempts to console him, admitting
    that he has done stupid things also. Linus angrily vows
    to him that the GREAT PUMPKIN will come to the pumpkin
    patch – next year”.

    You don’t look 63, Charlie Brown.

  12. ENSO DATA

    When I look at the data I notice from years 2002-2007 ,El Nino conditions dominated,yet the temperature trend was flat at best,despite increasing amounts of CO2 ,and prior years subsequent to years 2002-2007 being dominated by El Nino conditions.

    This would eliminate the effect of lag times associated with ENSO and temperature change.

    Anotherwords although El Nino conditions existed through 2002-2007 and prior to this time global temperatures still failed to increase.

    Something else must be counteracting ENSO AND CO2 effects.

  13. “Something else must be counteracting ENSO AND CO2 effects”

    Less solar energy has been entering the oceans due to more meridional jets and more clouds. That restricts the recharge process during La Nina episodes and leads to weaker subsequent El Ninos.

    The El Ninos of the early 2000s were not pronounced enough to increase temperatures, merely keep them stable in conjunction with the La Ninas before and after.

    The longer we go without a strong El Nino the more likely is the global air temperature to start falling.

  14. John K says:

    Hi Roy,

    Thank you for the information. Your Cumulative Multivariate ENSO Index graph appears to suggest a new 30 year La Nina cooling regime kicking in around 2006-7 upon the demise of the previous El Nino warming regime. If that is correct, how do you account for the lack of warming from 1997-8 peak to 2006-7? After musing about various attempts by climatologists to support some slant on the climate, of which they know very little, a quote came to mind:

    “That is the way of the scientist. He will spend thirty years in building up a mountain range of facts with the intent to prove a certain theory; then he is so happy with his achievement that as a rule he overlooks the main chief fact of all—that all his accumulation proves an entirely different thing.”
    — Mark Twain

  15. D'Avila Tarcisio says:

    Dr. Roy
    It is possible trough of the satellite data, to obtain a series of observations of the amount of water vapor and liquid water in the atmosphere over the continents?
    Observções made ​​the 6AM and 6PM.
    The variation of the amount of steam can show us how much energy is radiated in the form of IR.

    Tanks
    Tarcisio

  16. vukcevic says:

    PDO, some researchers consider the PDO to be a low-frequency modulation of El Nino and La Nina activity

    It may not be totally unexpected that the Pacific’s frequent and strong tectonic activity is reflected in apparent correlation of the two major climate indices
    http://www.vukcevic.talktalk.net/ENSO.htm
    http://www.vukcevic.talktalk.net/PDOt.htm

  17. Thanks, Dr. Spencer.
    Very good article.
    It is time more attention is paid to ENSO as a climate input.

  18. david dohbro says:

    please see my article about ~32yr cycles in GSTAs here: http://wattsupwiththat.com/2013/10/01/if-climate-data-were-a-stock-now-would-be-the-time-to-sell/

    this is EXACTLY in line with the ENSO cycle! Coincidence!?!? Me don’t think so!!

  19. Thanks for sharing superb information. Your site is very cool. I am impressed by the details that you have on this web site. It reveals how nicely you perceive this subject. Bookmarked this website page, will come back for more articles. You, my friend, ROCK! I found simply the info I already searched all over the place and just couldnt come across. What a great web site.

  20. always a massive fan of linking to bloggers that I really like but do not get quite a bit of link appreciate from…

Leave a Reply