Global SSM/I Ocean Product Suite Since 1987

September 23rd, 2013 by Roy W. Spencer, Ph. D.

Our satellite passive microwave radiometer assets have really advanced since the launch of the first Special Sensor Microwave/Imager (SSM/I) in 1987. The SSM/I and SSMIS have been providing global oceanic measurements of surface wind speed, total atmospheric water vapor, total cloud water, and rain rates, since mid-1987.

Frank Wentz and his homies at Remote Sensing Systems have produced intercalibrated ocean products from these sensors and post those products (in binary form, not for the weak of heart) at their ftp server. I’ve downloaded the archive of weekly averages from the separate satellites (you can also get daily and monthly), combined the separate satellites when more than one is operating, and computed weekly anomalies.

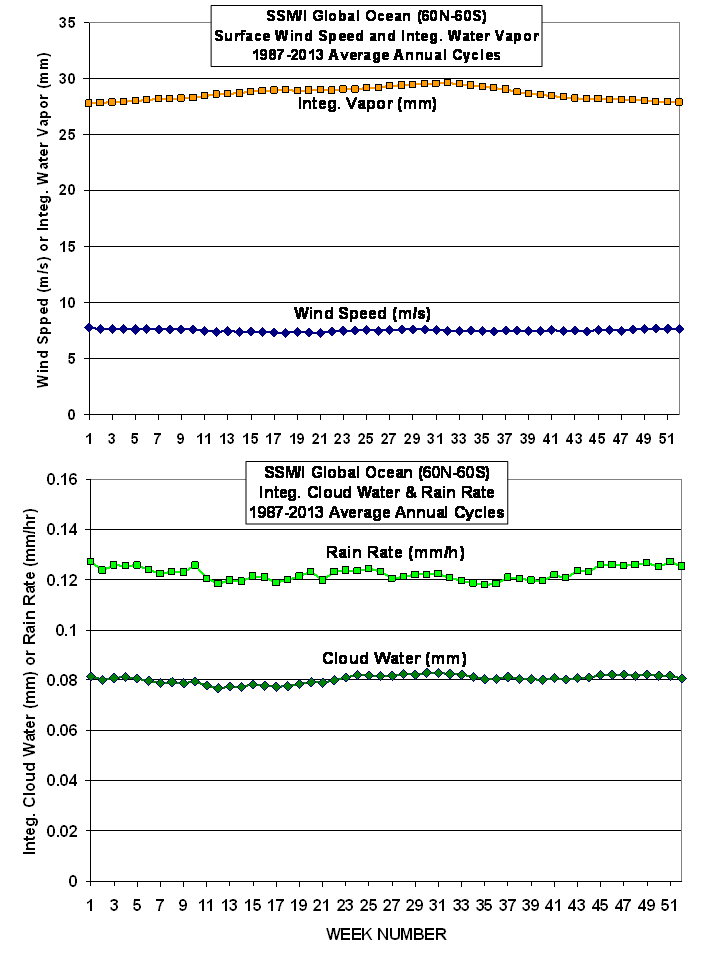
Here are the average annual cycles for the 4 products. Note there is little seasonal variations when the oceans are globally averaged:
SSMI-weekly-ocean-products-cycles

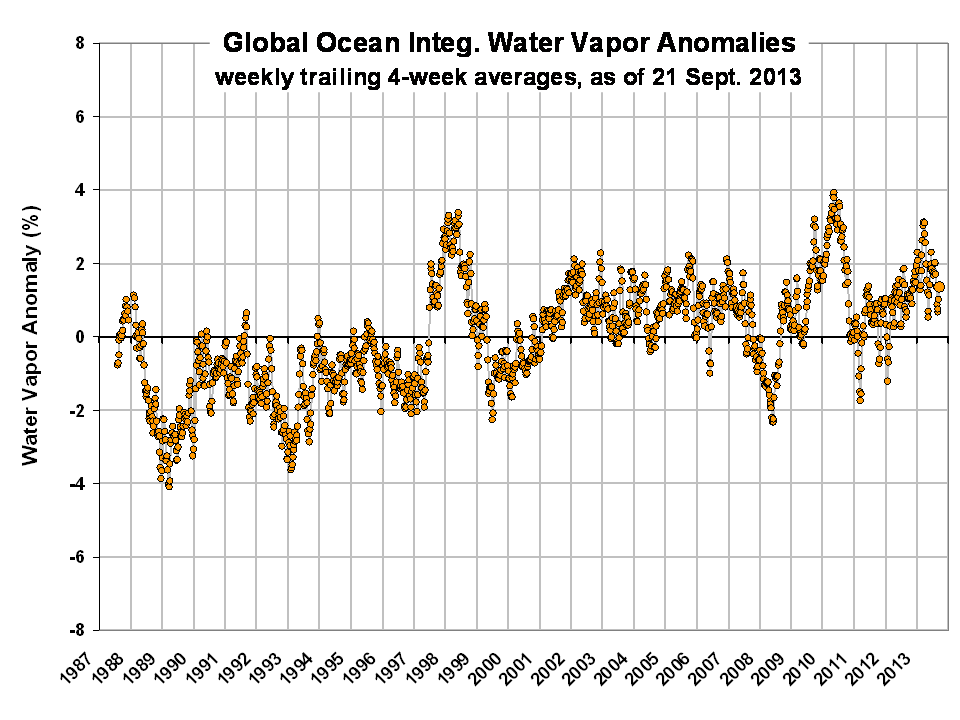
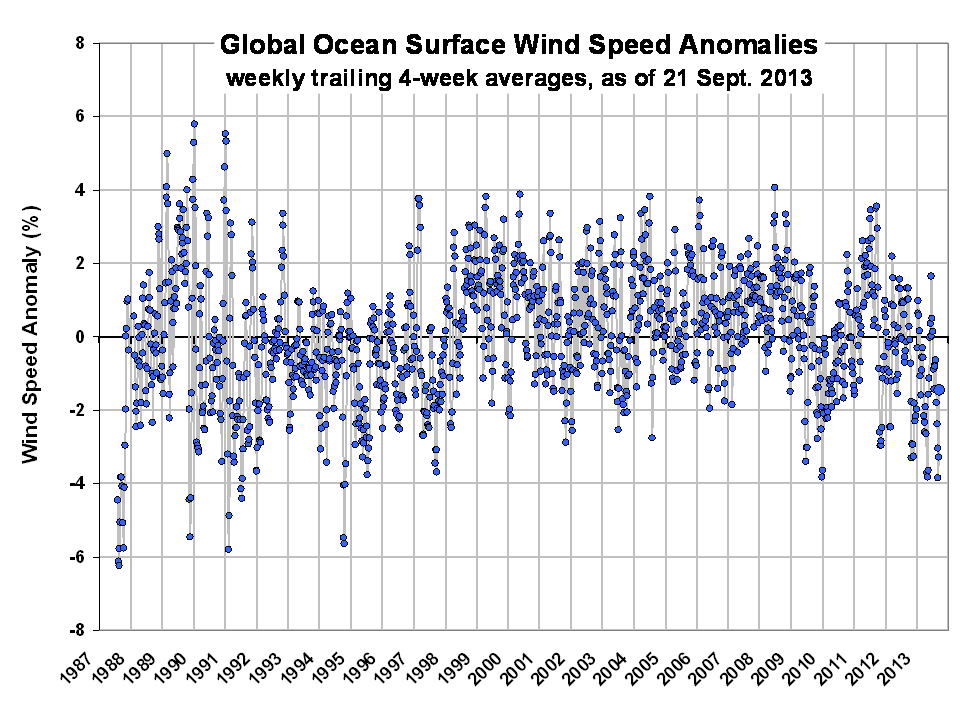
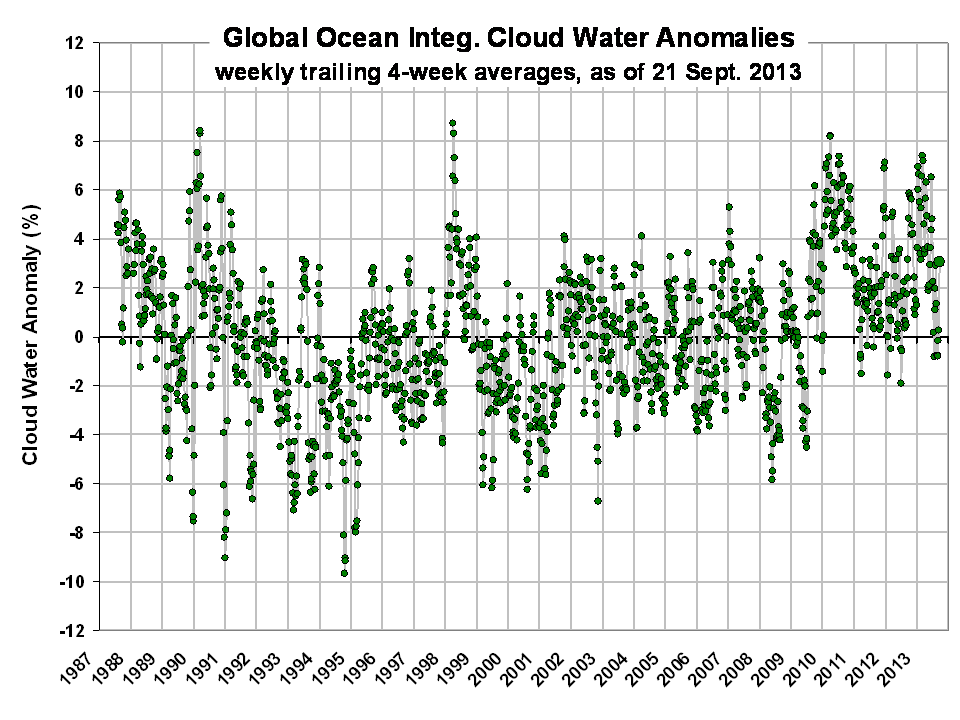
Next are the global anomaly time series since July 1987 (departures from the 27-year average weekly cycle, in percent) through Saturday, September 21, 2013.

WATER VAPOR: The vertically-integrated water vapor variations follow sea surface temperature variations rather closely, including moistening during El Nino and drying during La Nina, and support other datasets showing warming until the 1998-2002 time period, then leveling off:
SSMI-weekly-ocean-products-vapor-2013-38

WIND SPEED: Wind speeds tend to decrease during El Nino events and increase during La Nina. I’ll leave it to you to determine whether there has been a recent increase in wind speed which might support Trenberth’s view that increased surface winds have increased ocean mixing and thereby increased the rate of heat storage in the deep ocean:
SSMI-weekly-ocean-products-wind-2013-38

CLOUD WATER:Cloud water tends to increase during El Nino and decrease during La Nina. Also, I’ve previously found from AMSR-E cloud water retrievals that these anomalies correlate positively with CERES reflected sunlight anomalies, so positive values should suggest a cooling influence compared to average:
SSMI-weekly-ocean-products-cloud-2013-38

RAIN RATE:Like water vapor and cloud water, the rain rate anomalies tend to be higher during El Nino and lower during La Nina.
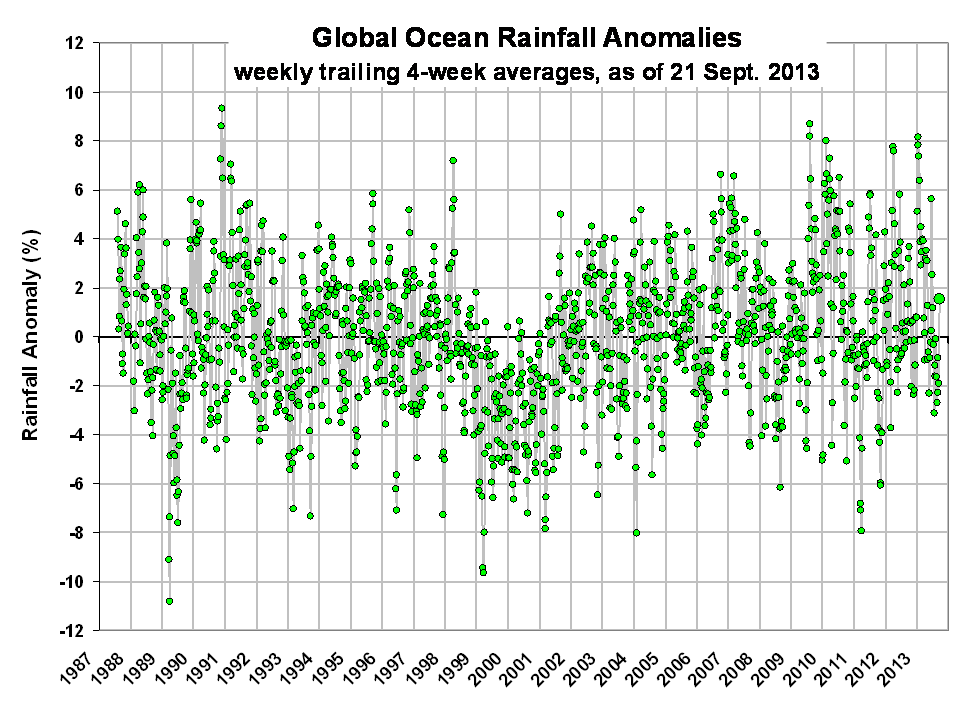
SSMI-weekly-ocean-products-rain-2013-38

The largest and most coherent anomaly patterns will show up during El Nino or La Nina, but right now we are in neutral conditions, so not much is happening. If there is sufficient interest I can provide weekly updates of these plots every week or two (if I’m in town) up through the previous Saturday.

Here’s an Excel spreadsheet with the anomaly time series data from the above 4 plots…please don’t download unless you plan on doing something with the data: SSMI_weekly_global_anoms_60N-60S_percent.

Here are high spatial resolution product examples for the global oceans from today (morning passes from the DMSP F17 satellite SSMIS).


13 Responses to “Global SSM/I Ocean Product Suite Since 1987”

Toggle Trackbacks

  1. Terry says:

    Roy, are the water vapor anomalies % absolute or RH ? It is my understanding that most of the GCM’s are constrained to a constant RH, something I have always thought to be a strange thing to do. If, they are %RH, then your graph shows a major issue with the models.

  2. RW says:

    Thanks for the data. Quite interesting, it is.

  3. Dr. Strangelove says:

    “I’ll leave it to you to determine whether there has been a recent increase in wind speed which might support Trenberth’s view that increased surface winds have increased ocean mixing and thereby increased the rate of heat storage in the deep ocean”

    Roy, no need for extraordinary mechanism in the ocean to explain the current warming pause. Natural cycles in the Pacific ocean is enough.

    (Kosaka & Xie, 2013)

    “Despite the continued increase in atmospheric greenhouse gas concentrations, the annual-mean global temperature has not risen in the twenty-first century, challenging the prevailing view that anthropogenic forcing causes climate warming… Here we show that accounting for recent cooling in the eastern equatorial Pacific reconciles climate simulations and observations. We present a novel method of uncovering mechanisms for global temperature change by prescribing, in addition to radiative forcing, the observed history of sea surface temperature over the central to eastern tropical Pacific in a climate model. Although the surface temperature prescription is limited to only 8.2% of the global surface, our model reproduces the annual-mean global temperature remarkably well with correlation coefficient r = 0.97 for 1970–2012 (which includes the current hiatus and a period of accelerated global warming)”

    “Moreover, our simulation captures major seasonal and regional characteristics of the hiatus, including the intensified Walker circulation, the winter cooling in northwestern North America and the prolonged drought in the southern USA. Our results show that the current hiatus is part of natural climate variability, tied specifically to a La-Niña-like decadal cooling. Although similar decadal hiatus events may occur in the future, the multi-decadal warming trend is very likely to continue with greenhouse gas increase.”

  4. bill_c says:

    Roy,

    What do you think the cloud water anomaly says, if anything, about cloud feedback to otherwise-caused warming of the system?

  5. Ian says:

    Roy,

    Trenberth’s argument about increased wind speeds is mainly about the trade winds in the tropical Pacific. Can you show the wind speed anomaly trend for this region only?

  6. Lance wallace says:

    Roy–

    You say:

    WATER VAPOR: The vertically-integrated water vapor variations follow sea surface temperature variations rather closely, including moistening during El Nino and drying during La Nina, and support other datasets showing warming until the 1998-2002 time period, then leveling off”

    But I see something that looks like a flat line at about -1% until about June of 1997 when a step occurs and after that another flat line at about +1%. What happened in about June of 1997?

  7. Hello, everything is going perfectly here and ofcourse every one is sharing data, thats in fact good, keep up writing.

Leave a Reply