Archive for August, 2020

Even with Laura, Louisiana Hurricanes Have Not Increased Since 1851

Wednesday, August 26th, 2020

As I write this, it looks like major Hurricane Laura will arrive on the Louisiana coast late tonight as a Category 4 hurricane somewhere south of Lake Charles.

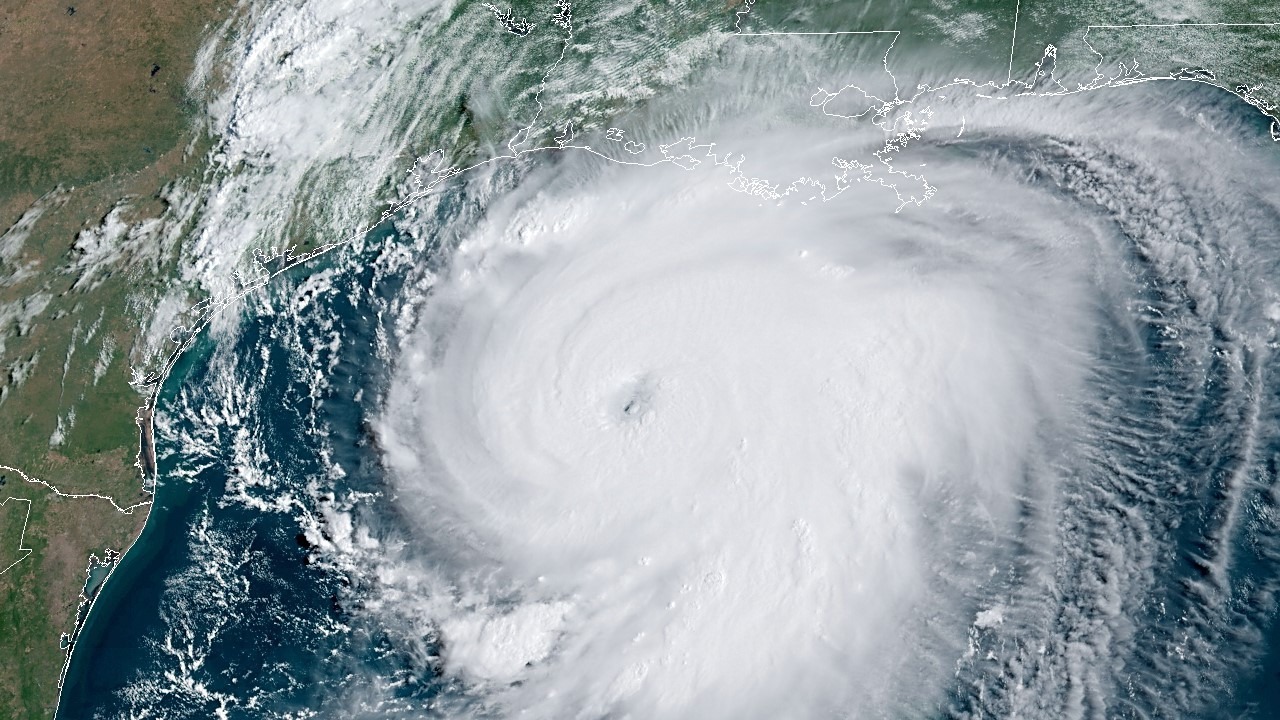
Fig. 1. GOES-East Geocolor image of major Hurricane Laura heading toward the southwest Louisiana coast at 9:50 a.m. CDT 26 August 2020.

There will be the inevitable fake news coverage claiming how U.S. landfalling hurricanes are getting worse, a subject which I addressed in my Amazon Kindle e-book Inevitable Disaster: Why Hurricanes Can’t Be Blamed on Global Warming.

Of course, hurricane damage has increased, as people flock to the nation’s coasts and associated infrastructure increases. But we should remember that (for example) Miami only had 444 residents when incorporated in 1896, and now the Miami metroplex has over 6,000,000 inhabitants.

So, yes, storm damage will increase, but not because the weather has gotten worse.

Given the current event, which is sure to bring major damage to southwest Louisiana, I thought I would present the statistics for all documented hurricanes affecting Louisiana in the last 170 years (1851-2020).

Neither Hurricane Numbers nor Intensities Have Increased in Louisiana

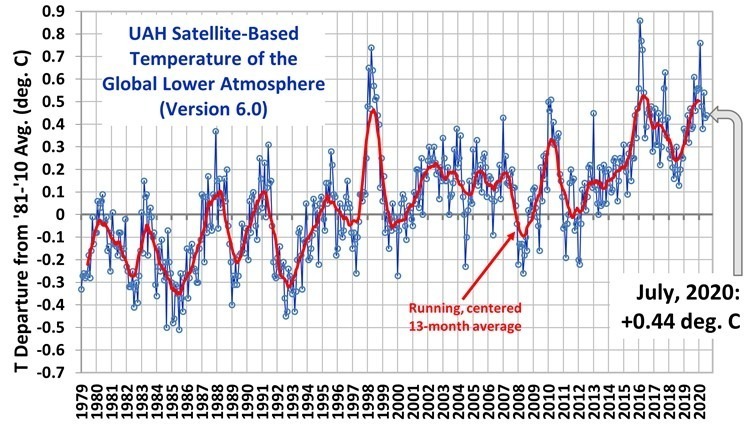
If we examine all of the hurricanes affecting Louisiana in the last 170 years in the National Hurricane Center’s HURDAT database (as summarized on Wikipedia) we find that there has been no long-term increase in either the number of hurricanes or their intensity since 1851.

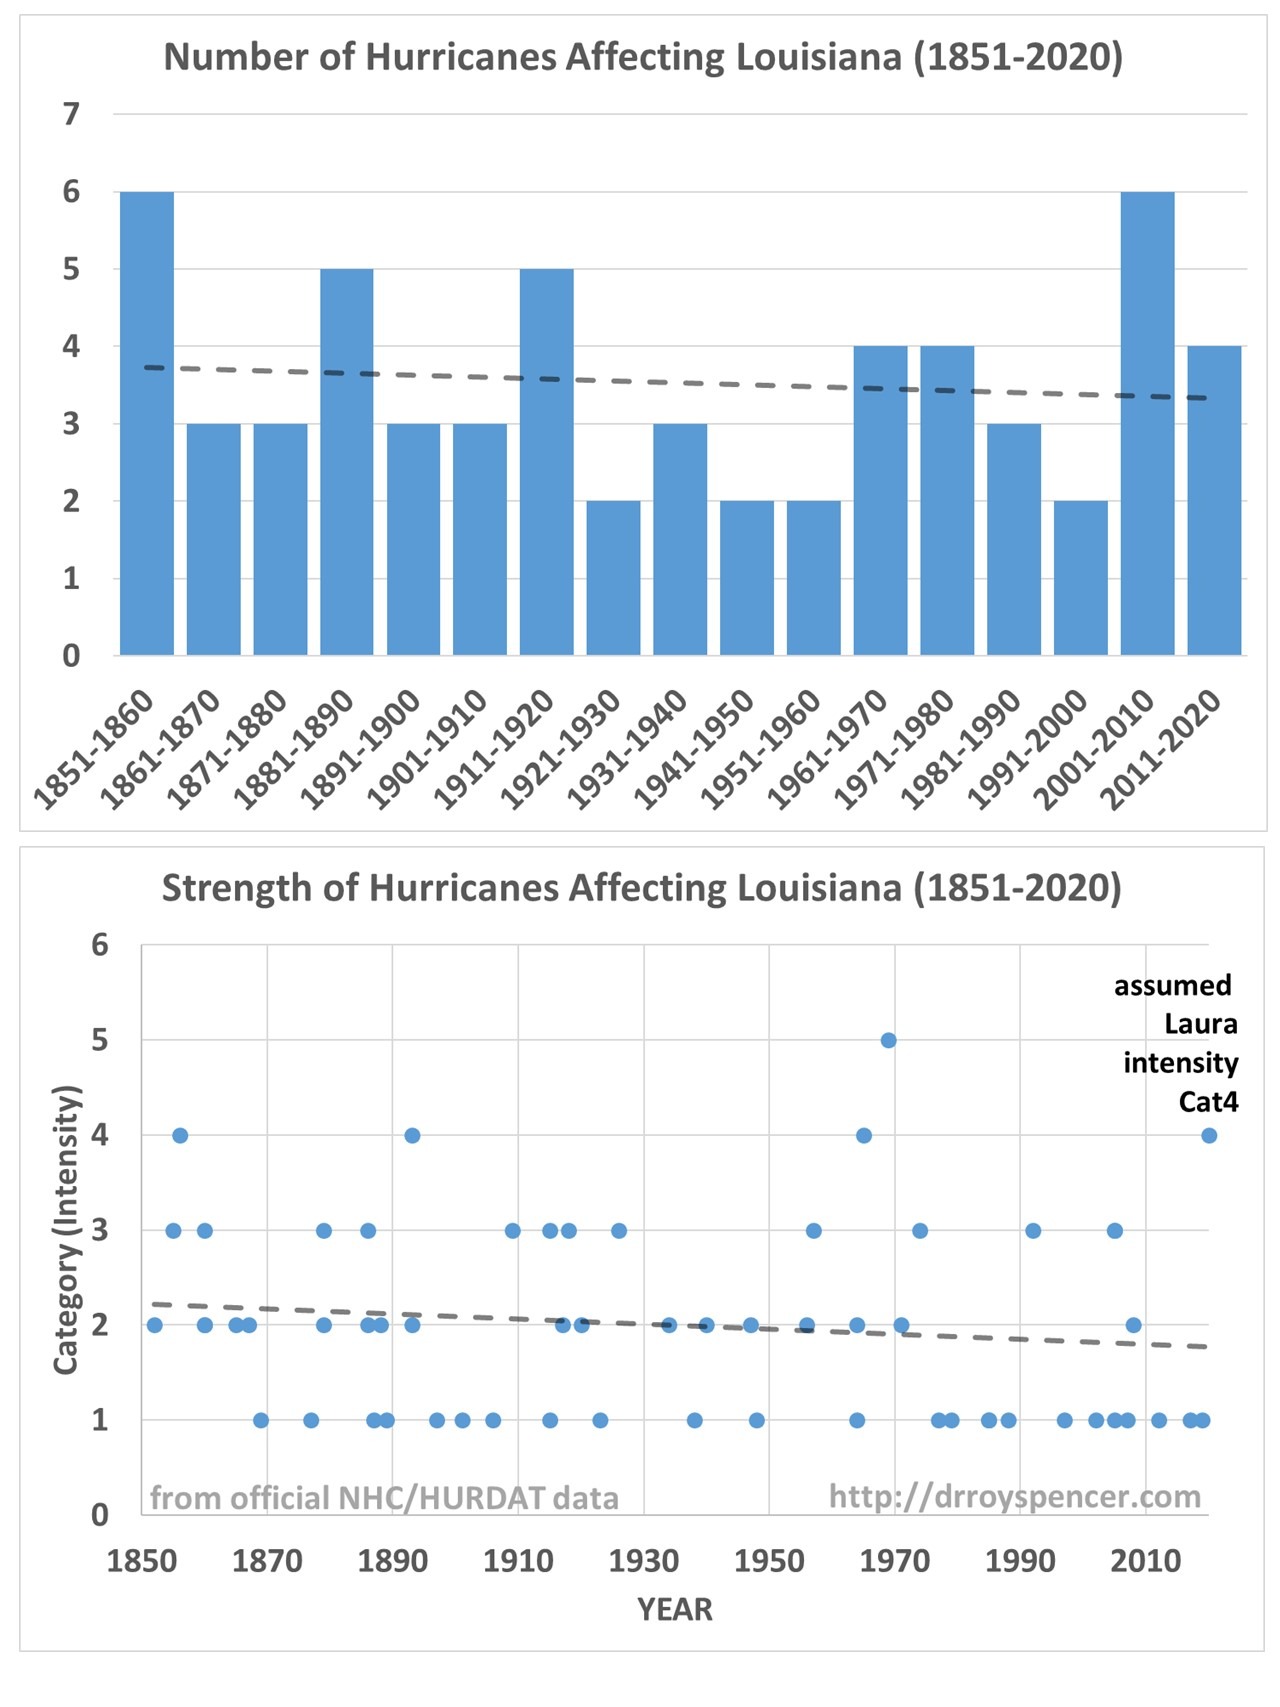
Fig. 2. Neither the number nor intensity of hurricanes impacting Louisiana since 1851 have experienced a long-term increase, assuming major Hurricane Laura (2020) makes landfall as a Cat4 storm. Dashed lines are the linear trends.

Again, this is based upon official NOAA National Hurricane Center (NHC) statistics.

UAH Global Temperature Update for July 2020: +0.44 deg. C

Monday, August 3rd, 2020

The Version 6.0 global average lower tropospheric temperature (LT) anomaly for July, 2020 was +0.44 deg. C, essentially unchanged from the June, 2020 value of +0.43 deg. C.

The linear warming trend since January, 1979 remains at +0.14 C/decade (+0.12 C/decade over the global-averaged oceans, and +0.18 C/decade over global-averaged land).

Various regional LT departures from the 30-year (1981-2010) average for the last 19 months are:

 YEAR MO GLOBE NHEM. SHEM. TROPIC USA48 ARCTIC AUST 
2019 01 +0.38 +0.35 +0.41 +0.36 +0.53 -0.14 +1.14
2019 02 +0.37 +0.47 +0.28 +0.43 -0.02 +1.05 +0.05
2019 03 +0.34 +0.44 +0.25 +0.41 -0.55 +0.97 +0.58
2019 04 +0.44 +0.38 +0.51 +0.54 +0.50 +0.93 +0.91
2019 05 +0.32 +0.29 +0.35 +0.39 -0.61 +0.99 +0.38
2019 06 +0.47 +0.42 +0.52 +0.64 -0.64 +0.91 +0.35
2019 07 +0.38 +0.33 +0.44 +0.45 +0.11 +0.34 +0.87
2019 08 +0.39 +0.38 +0.39 +0.42 +0.17 +0.44 +0.23
2019 09 +0.61 +0.64 +0.59 +0.60 +1.14 +0.75 +0.57
2019 10 +0.46 +0.64 +0.27 +0.30 -0.03 +1.00 +0.49
2019 11 +0.55 +0.56 +0.54 +0.55 +0.21 +0.56 +0.37
2019 12 +0.56 +0.61 +0.50 +0.58 +0.92 +0.66 +0.94
2020 01 +0.56 +0.60 +0.53 +0.61 +0.73 +0.13 +0.65
2020 02 +0.76 +0.96 +0.55 +0.76 +0.38 +0.02 +0.30
2020 03 +0.48 +0.61 +0.34 +0.63 +1.09 -0.72 +0.16
2020 04 +0.38 +0.43 +0.33 +0.45 -0.59 +1.03 +0.97
2020 05 +0.54 +0.60 +0.49 +0.66 +0.17 +1.16 -0.15
2020 06 +0.43 +0.45 +0.41 +0.46 +0.38 +0.80 +1.20
2020 07 +0.44 +0.45 +0.42 +0.46 +0.56 +0.40 +0.66

The full UAH Global Temperature Report, along with the LT global gridpoint anomaly image for July, 2020 should be available within the next few days here.

The global and regional monthly anomalies for the various atmospheric layers we monitor should be available in the next few days at the following locations:

Lower Troposphere: http://vortex.nsstc.uah.edu/data/msu/v6.0/tlt/uahncdc_lt_6.0.txt
Mid-Troposphere: http://vortex.nsstc.uah.edu/data/msu/v6.0/tmt/uahncdc_mt_6.0.txt
Tropopause: http://vortex.nsstc.uah.edu/data/msu/v6.0/ttp/uahncdc_tp_6.0.txt
Lower Stratosphere: http://vortex.nsstc.uah.edu/data/msu/v6.0/tls/uahncdc_ls_6.0.txt