Archive for August, 2022

Lake Mead Low Water Levels, Part 2: Colorado River Inflow Variations and Trend

Friday, August 26th, 2022

Key Points

  • Contrary to claims that drought is causing Lake Mead water levels to fall, the Colorado River natural flows into Lake Mead show no long-term trend since 1930.
  • Decadal time scale variations in river flow do occur, though, related to the Pacific Decadal Oscillation (PDO).
  • Since about 2000, use of Lake Mead water has exceeded river inflow, causing water levels to drop. The negative phase of the PDO since that time has exacerbated the problem.

Natural Water Flows into Lake Mead: No Long-Term Trend

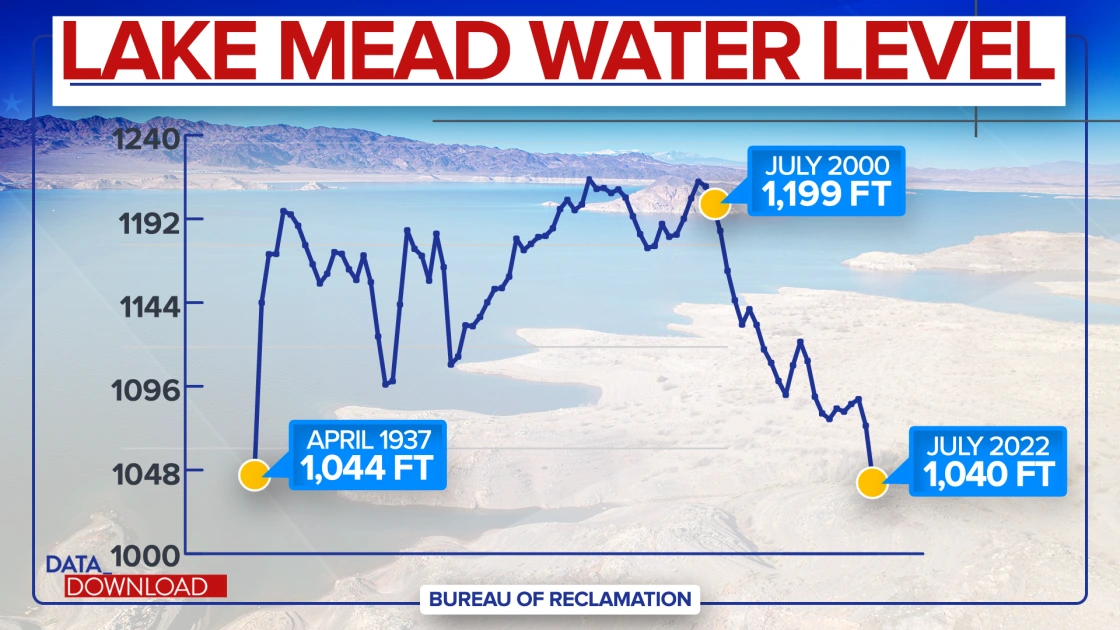
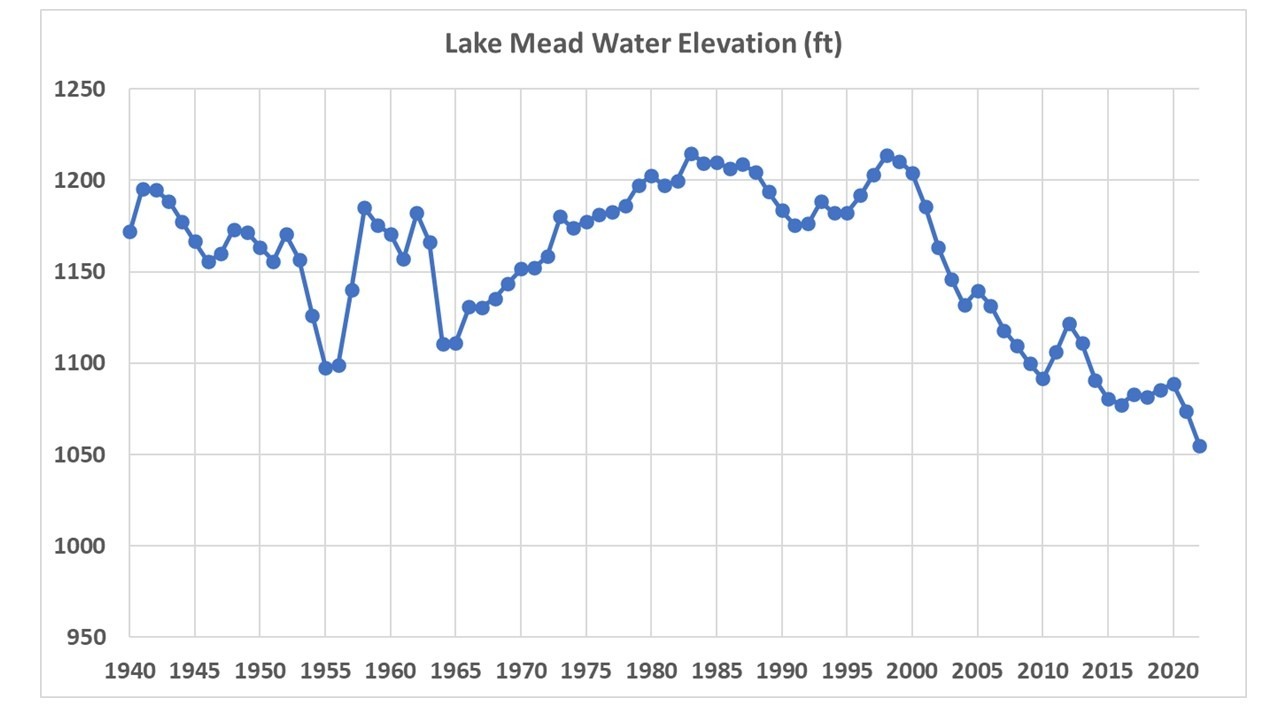
Record low water levels in Lake Mead are widely blamed on drought, although what “drought” means is seldom specified. The public perception is that lower precipitation amounts have reduced water supply to Lake Mead (which comes from the Colorado River), usually attributed to human-caused climate change, and that this is why water levels are falling.

But data from the U.S. Bureau of Reclamation (USBR) show that there has been no long-term trend in natural Colorado River flow into Lake Mead:

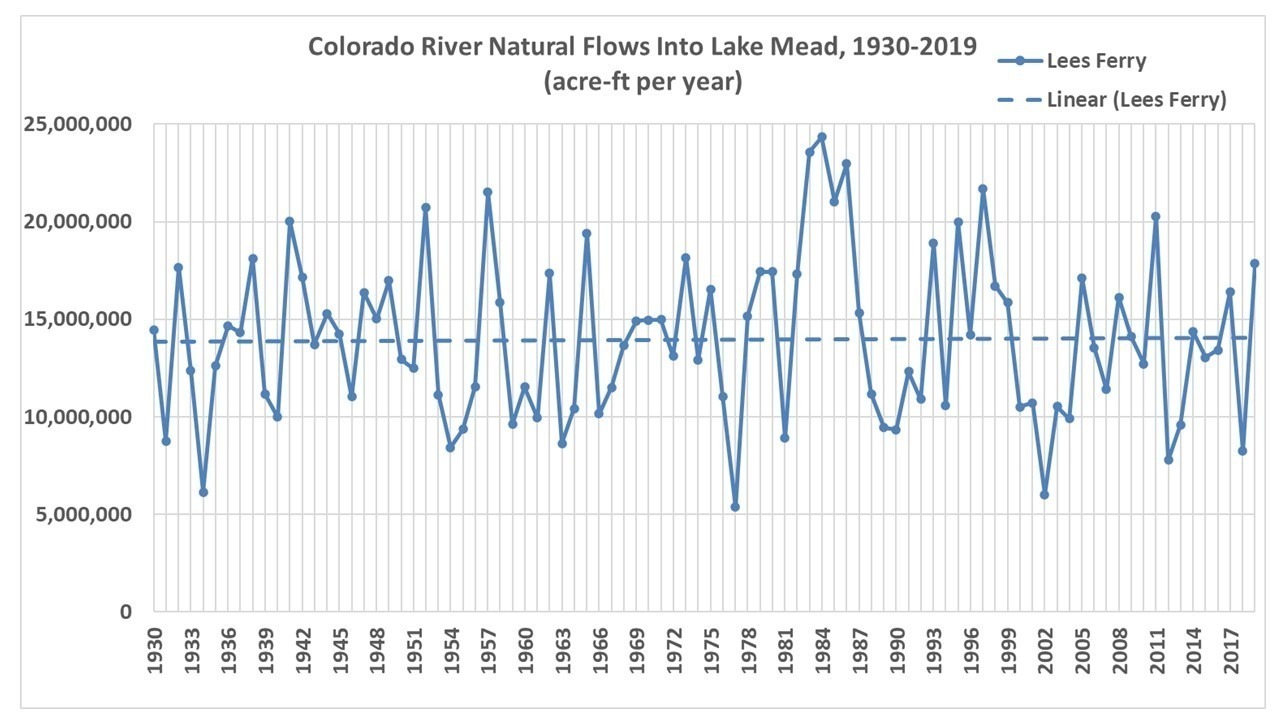
Fig. 1. Yearly “natural” water flows into Lake Mead, corrected for local human-induced changes in water flow upstream. Details of those corrections are described here. Data source here.

The flows in Fig. 1 have been slightly adjusted for local human-caused changes to the flows upstream, and provide our best answer to the question of whether long-term global climate change is responsible for a decrease of river water flow into Lake Mead.

The answer is “no”.

Does Climate Change Theory Even Predict Reduced Precipitation? No

The next question is, does climate change even predict future reductions of precipitation over the Colorado River watershed? The following plot shows an average of 183 climate model simulations of average yearly precipitation in an area approximating the Colorado River watershed. The models suggest a slight increase in total precipitation with warming.

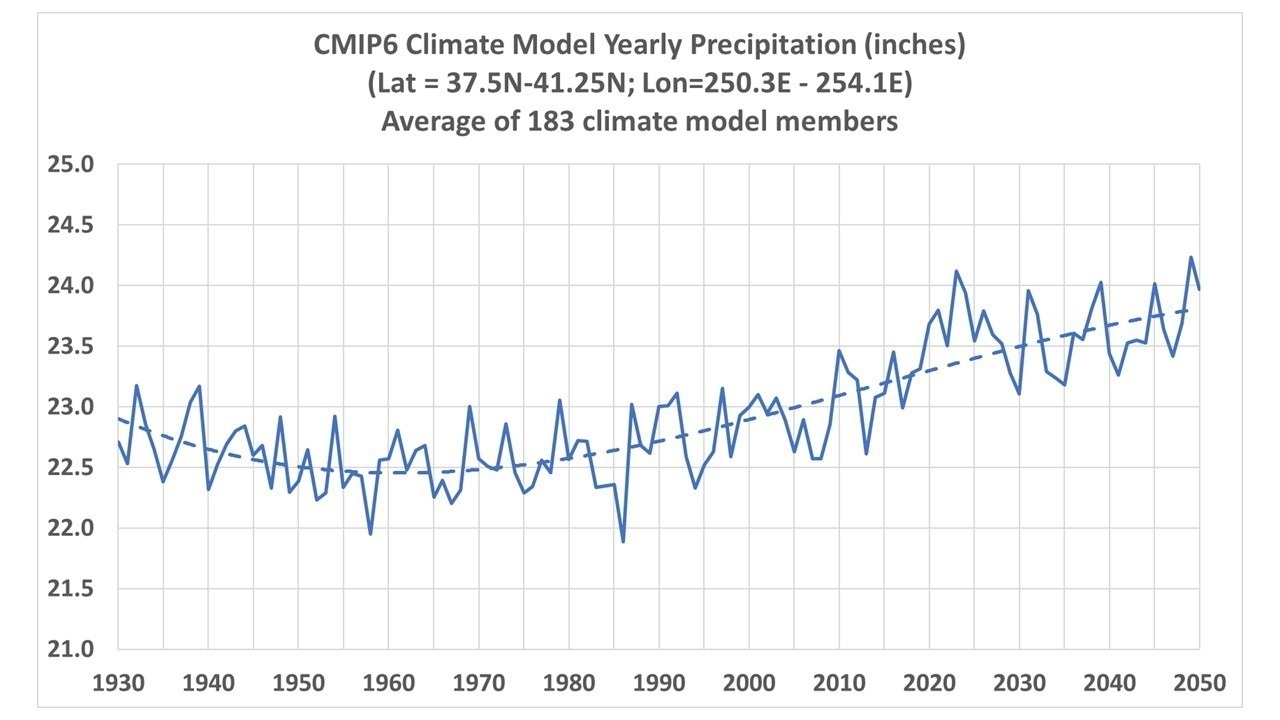
Fig. 2. CMIP6 model average yearly precipitation 1930-2050 over an area approximating the upper Colorado River watershed. Data source here.

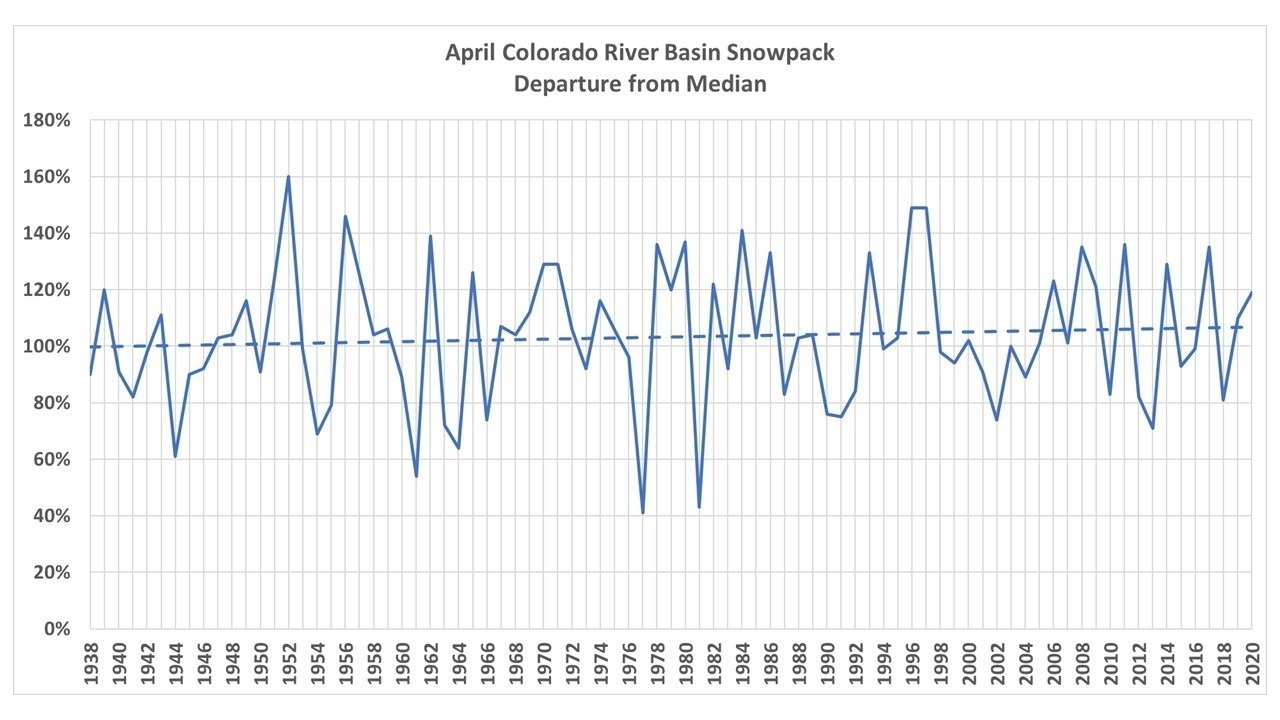
Most of the water entering Lake Mead is from snowmelt in the mountains; little of the water falling on lower elevations tends to be used by local vegetation with little runoff reaching the Colorado River. Fig. 3 shows there has been no long-term trend in the snowpack measurements in the upper Colorado River watershed.

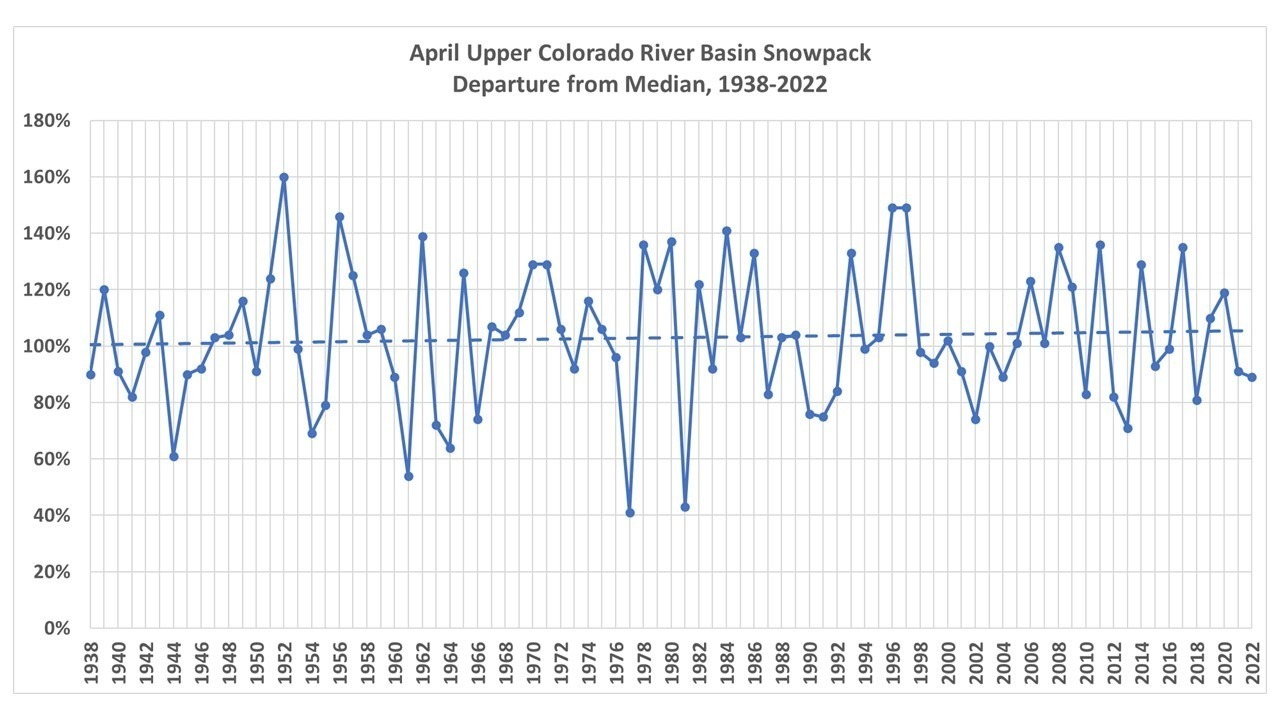
Fig. 3. April snowpack measurements in the upper Colorado River watershed, 1938-2022.

So, not only has there been no observed long-term reduction in water flow into Lake Mead, or reduction in the watershed snowpack, climate change theory doesn’t even support such a change up to the current time (or even to 2050).

So, Why are Lake Mead Water Levels Falling?

What has changed since Hoover Dam was constructed in the 1930s is the amount of water being removed from Lake Mead. Since about 2000, that water use has exceeded the water input into the lake. This is the most recent available demonstration of that fact, published in 2012:

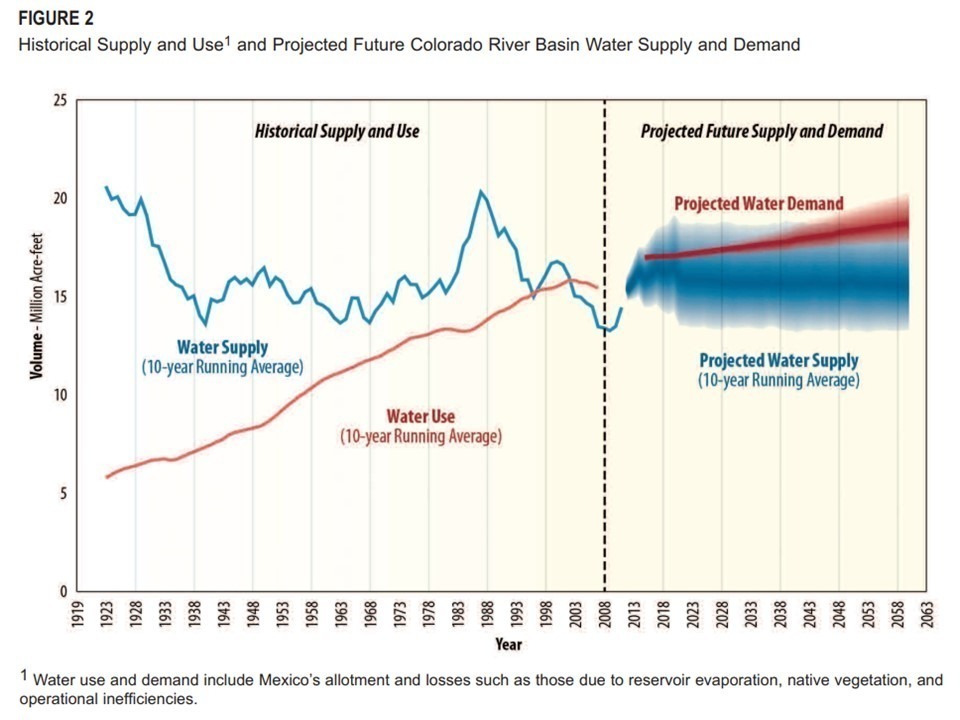
Fig. 4. The Colorado River basin water supply exceeded demand up until the year 2000 or so, and since then Lake Mead water levels have fallen due to overuse.

As long as water use exceeds supply, Lake Mead water levels will continue to fall. (This is somewhat dependent upon the regulated releases from Lake Powell, upstream. There is a “Fill Mead First” initiative that would draw down Lake Powell in an attempt to raise Lake Mead, based upon calculations that net natural water losses from combined evaporation and bank seepage from Mead and Powell would be reduced.)

The Role of the Pacific Decadal Oscillation (PDO) in the Current Problem

While the major problem with Lake Mead is overuse, there are multi-decadal fluctuations in Colorado River flows which have made matters worse since approximately 2000. If we take the river flow data in Fig. 1 and compute the accumulated departures from the long-term average flow (because this is how a reservoir like Lake Mead responds), we find that there have been periods of lesser and greater flows.

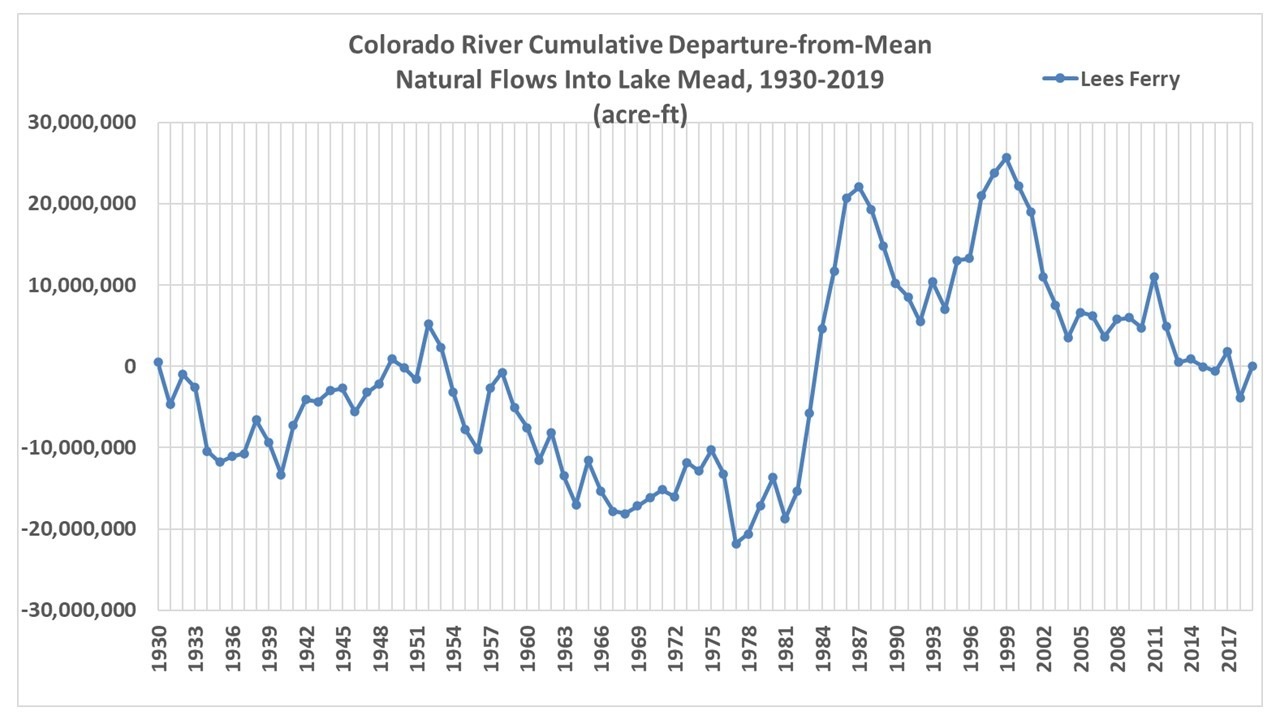
Fig. 5. As in Fig. 1, except time-accumulated departures-from-average Colorado River flows into Lake Mead.

Before the 1980s, there was somewhat reduced river flow into Lake Mead, but it made little difference because water use (Fig. 4) was still low.

Then from the 1982-83 super El Nino year to approximately 2000 there were above average flows, so Lake Mead could handle the increasing water usage. In fact, the lake reached near full-pool status.

But as usage peaked around 2000, river input to the lake was reduced once again. This put Lake Mead into an unsustainable state where more water was being extracted than the Colorado River could replenish it.

It has been long known (e.g. here) that precipitation in this region is affected by El Nino (more precip) and La Nina (less precip). Also, the Pacific Decadal Oscillation (PDO), which is basically a low-frequency manifestation of El Nino and La Nina activity is related to precipitation in this area.

I computed the cumulative average departures from the long-term mean of both the PDO index and the MEI (Multivariate ENSO Index). The PDO is somewhat higher correlated (r=0.52) with the cumulative river flow data in Fig. 5. As Fig. 6 shows, positive PDO periods are generally associated with higher stream flows, and negative PDO with lower stream flows. Most notably, the period since 2000 has seen more negative PDO activity, which is worsening the problem with Lake Mead not getting enough water. Of course, this will eventually reverse when the PDO flips back into its positive phase.

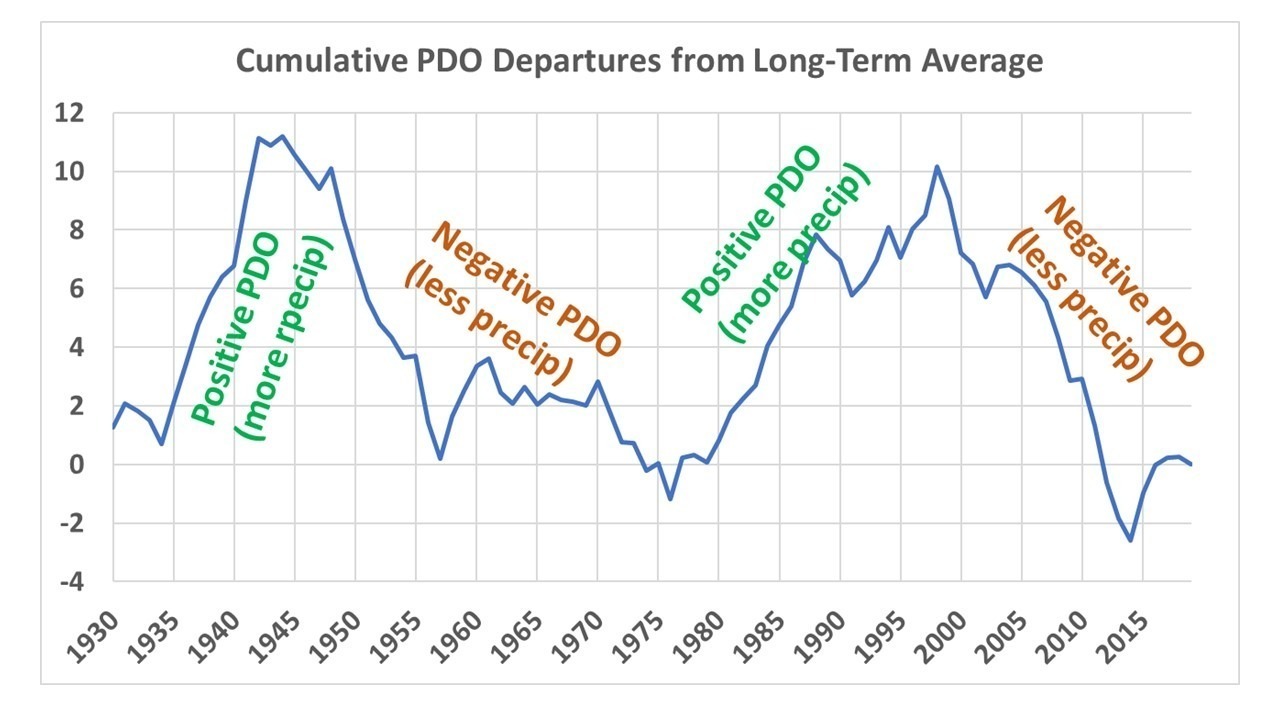
Fig. 6. Cumulative departures of the Pacific Decadal Oscillation index from its long term mean, which is r=0.52 correlated to cumulative streamflow into Lake Mead from the Colorado River (Fig. 5.)

Conclusions

The popular narrative that drought due to climate change is causing Lake Mead to have less water available to it is incorrect. Since 1930, there has been no long-term change in the Colorado River flow upstream of what is now Lake Mead.

The latest climate models do not even predict a reduction in precipitation in the upper Colorado River watershed.

Multi-decadal changes in river flow do occur, though, and are related to the Pacific Decadal Oscillation, a natural fluctuation in weather patterns over the northeast Pacific. Recent record-low water levels in Lake Mead are primarily due to record high water demand from the lake, since approximately 2000. The problem is being made somewhat worse by the negative phase of the PDO, also since approximately 2000.

Lake Mead Low Water Levels: Overuse, Not Climate Change

Wednesday, August 24th, 2022
UPDATED: Fixed Bureau of Reclamation study link, added Colorado River basin snowpack graph and discussion.

In today’s news is yet another article claiming the record-low water levels in Lake Mead (a manmade water reservoir) are due to human-caused climate change. In fact, to make the problem even more sinister, the Mafia is also part of the story:

Climate change is uncovering gruesome mafia secrets in this Las Vegas lake

While it is true that recent years have seen somewhat less water available from the Colorado River basin watershed (which supplies 97% of Lake Mead’s water), this is after years of above-average water inflow from mountain snowpack. Those decadal time-scale changes are mostly the result of stronger El Nino years (more mountain snows) giving way to stronger La Nina years (less snow).

The result is record-low water levels:

Lake Mead water levels since the construction of Hoover Dam (source: NBC News)

But the real problem isn’t natural water availability. It’s water use.

The following graph shows the fundamental problem (click for full resolution). Since approximately 2000, water use by 25 million people (who like to live in a semi-desert area where the sun shines almost every day) has increased to the point that more water is now being taken out of the Lake Mead reservoir than nature can re-supply it.

This figure is from a detailed study by the U.S. Bureau of Reclamation. As long as that blue line (water supply) stayed above the red line (water use), there was more than enough water to please everyone.

But now, excessive demand for water means Lake Mead water levels will probably continue to decline unless water use is restricted in some way. The study’s projection for the future in the above figure, which includes climate model projections, shows little future change in water supply compared to natural variability over the last century.

The real problem is that too much water is being taken out of the reservoir.

As long as the red line stays above the blue line, Lake Mead water levels will continue to fall.

But to blame this on climate change, whether natural or anthropogenic, ignores the thirsty elephant in the room.

UPDATE: Since it was pointed out in comments (below) that the latest Bureau of Reclamation study is rather dated (2012), and supposedly the drought has worsened since then, here’s a plot of the Colorado River basin April (peak month) snowpack, which provides about 50% of the water to Lake Mead. The rest is provided in the non-mountainous areas of the river basin, which should be highly correlated with the mountainous regions. I see no evidence for reduced snowpack due to “climate change”… maybe the recent drought conditions are where the demand by 25 million water consumers originates from, causing higher demand?

April snowpack in the Colorado River basin, the greatest source of water input to Lake Mead (data from https://www.nrcs.usda.gov/Internet/WCIS/AWS_PLOTS/basinCharts/POR/WTEQ/assocHUCco_8/colorado_headwaters.html)


ENSO Impact on the Declining CO2 Sink Rate

Tuesday, August 9th, 2022

SUMMARY: A simple time-dependent CO2 budget model shows that yearly anthropogenic emissions compared to Mauna Loa CO2 measurements gives a declining CO2 sink rate, which if continued would increase atmospheric CO2 concentrations and presumably anthropogenic climate change. But accounting for ENSO (El Nino/La Nina) activity during 1959-2021 removes the decline. This is contrary to multiple previous studies that claimed to account for ENSO. A preprint of my paper (not yet peer reviewed) describing the details is at ENSO Impact on the Declining CO2 Sink Rate | Earth and Space Science Open Archive (essoar.org).

UPDATE: The CO2 model, with inputs and outputs, is in an Excel spreadsheet here: CO2-budget-model-with-EIA-growth-cases.

I decided that the CO2 model I developed a few years ago, and recently reported on here, was worthy of publication, so I started going through the published literature on the subject. This is a necessary first step if you want to publish a paper and not be embarrassed by reinventing the wheel or claiming something others have already “disproved”.

The first thing I found was that my idea that Nature each year removes a set fraction of the difference between the observed CO2 concentration and some baseline value is not new. That idea was first published in 2013 (see my preprint link above for details), and it’s called the “CO2 sink rate”.

The second thing I found was that the sink rate has (reportedly) been declining, by as much as 0.54% (relative) per year, even after accounting for ENSO activity. But I only get -0.33% per year (1959-2021) before accounting for ENSO activity, and — importantly — 0.0% per year after accounting for ENSO.

This last finding will surely be controversial, because it could mean CO2 in the atmosphere will not rise as much as global carbon cycle modelers say it will. So, I am posting the model and the datasets used along with the paper preprint at ENSO Impact on the Declining CO2 Sink Rate | Earth and Space Science Open Archive (essoar.org). The analysis is quite simple and I believe defensible. The 2019 paper that got -0.54% per year decline in the sink rate uses complex statistical gymnastics, with a professional statistician as a primary author. My analysis is much simpler, easier to understand, and (I believe) at least as defensible.

The paper will be submitted to Geophysical Research Letters for peer review in the next couple days. In the meantime, I will be inviting the researchers who live and breathe this stuff to poke holes in my analysis.

UAH Global Temperature Update for July, 2022: +0.36 deg. C

Tuesday, August 2nd, 2022

The Version 6.0 global average lower tropospheric temperature (LT) anomaly for July, 2022 was +0.36 deg. C, up from the June, 2022 value of +0.06 deg. C.


The linear warming trend since January, 1979 still stands at +0.13 C/decade (+0.11 C/decade over the global-averaged oceans, and +0.18 C/decade over global-averaged land).

Various regional LT departures from the 30-year (1991-2020) average for the last 19 months are:

YEAR MO GLOBE NHEM. SHEM. TROPIC USA48 ARCTIC AUST 
2021 01 0.12 0.34 -0.09 -0.08 0.36 0.50 -0.52
2021 02 0.20 0.32 0.08 -0.14 -0.66 0.07 -0.27
2021 03 -0.01 0.13 -0.14 -0.29 0.59 -0.78 -0.79
2021 04 -0.05 0.05 -0.15 -0.28 -0.02 0.02 0.29
2021 05 0.08 0.14 0.03 0.06 -0.41 -0.04 0.02
2021 06 -0.01 0.30 -0.32 -0.14 1.44 0.63 -0.76
2021 07 0.20 0.33 0.07 0.13 0.58 0.43 0.80
2021 08 0.17 0.26 0.08 0.07 0.32 0.83 -0.02
2021 09 0.25 0.18 0.33 0.09 0.67 0.02 0.37
2021 10 0.37 0.46 0.27 0.33 0.84 0.63 0.06
2021 11 0.08 0.11 0.06 0.14 0.50 -0.43 -0.29
2021 12 0.21 0.27 0.15 0.03 1.63 0.01 -0.06
2022 01 0.03 0.06 0.00 -0.24 -0.13 0.68 0.09
2022 02 -0.00 0.01 -0.02 -0.24 -0.05 -0.31 -0.50
2022 03 0.15 0.27 0.02 -0.08 0.22 0.74 0.02
2022 04 0.26 0.35 0.18 -0.04 -0.26 0.45 0.60
2022 05 0.17 0.24 0.10 0.01 0.59 0.23 0.19
2022 06 0.06 0.07 0.04 -0.36 0.46 0.33 0.11
2022 07 0.36 0.37 0.35 0.13 0.70 0.55 0.65

The full UAH Global Temperature Report, along with the LT global gridpoint anomaly image for July, 2022 should be available within the next several days here.

The global and regional monthly anomalies for the various atmospheric layers we monitor should be available in the next few days at the following locations:

Lower Troposphere: http://vortex.nsstc.uah.edu/data/msu/v6.0/tlt/uahncdc_lt_6.0.txt
Mid-Troposphere: http://vortex.nsstc.uah.edu/data/msu/v6.0/tmt/uahncdc_mt_6.0.txt
Tropopause: http://vortex.nsstc.uah.edu/data/msu/v6.0/ttp/uahncdc_tp_6.0.txt
Lower Stratosphere: http://vortex.nsstc.uah.edu/data/msu/v6.0/tls/uahncdc_ls_6.0.txt