Archive for May, 2014

Why Are Solar Freakin Roadways So Freakin Popular?

Saturday, May 31st, 2014

My blog traffic has been unexpectedly blowing up with visitors to my post, Solar Roadways Project: A Really Bad Idea.

The comments posted there suggest the Solar Roadways project remains very popular….it has now generated over $1.7 Million in Indiegogo.com crowd funding donations.

Now, I can only ask: Why the hell would any sane person take perfectly good solar collectors and try to embed them in roads and run over them repeatedly with heavy, dirty vehicles?

Do we take airplanes and drive them down roads? We could if we really wanted, I suppose.

I’m not the only one who sees the stupidity of the idea. Here’s a very critical post at ExtremeTech.com, and another at Jalopnik.com. And another at Equities.com.

The question that fascinates me is, why does this idea have such popular support? Here’s my theory.

We all have the experience of driving down, and walking on, roads. They are typically dirty, and hot. They represent sources of both eye pollution and real pollution.

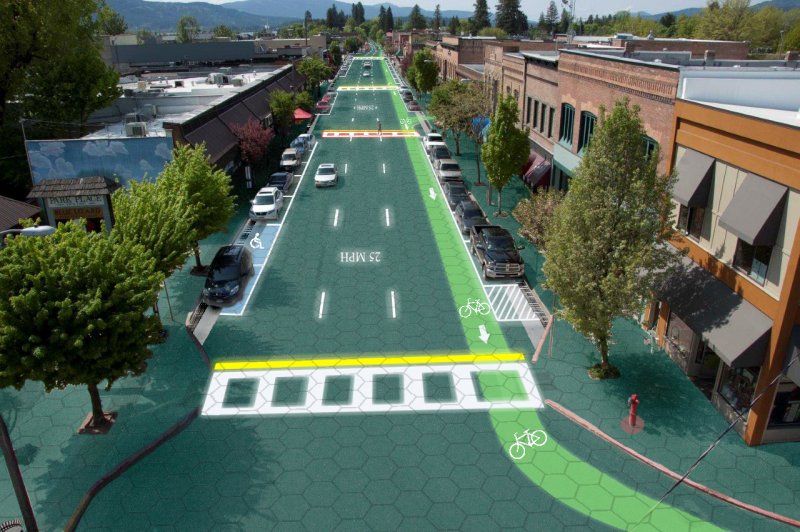
The Solar Freakin’ Roadways project has cleverly suggested, why not replace those dirty awful road surfaces with nice, clean, hi-tech surfaces that do something useful (generate electricity)? Look how pretty it would be!:
Downtown-Sandpoint-2-small

I know I’ve wondered about all of that solar energy collected by the road, generating all that heat. But I also know that a solar heated surface does not mean you can generate much electricity. Solar domestic hot waters systems are over 90% efficient, but solar PV electricity generation is more like 15% efficient.

As discussed here, solar panels and roads that you drive on are two things that are very incompatible. There is no good reason to mix them. In fact there are many reasons to NOT mix them.

Nevertheless, the Department of Transportation awarded almost $1 million in Phase I and Phase II SBIR contracts to study the idea. Of course, we all know the government is careful about what it gives money away for, right? (I used to review SBIR proposals submitted to NASA. I wouldn’t have recommended this for funding.)

At the end of the SBIR Phase II, there is supposed to be a solar parking lot completed…which is big enough to park 4 cars on. Cars which would shade the parking lot from collecting solar energy. A parking lot which you can’t tilt toward the sun to collect more energy, as is usually done with solar panels. For close to $1 million.

Sorry, folks, but solar-based electricity is far from free. In fact, it’s very expensive, even under optimum collecting conditions. Even with subsidies and higher rates forced on consumers, less than 1 kWh of every 500 kWh generated in the U.S. comes from solar. You can have quite a bit more than that 0.2%…if you want to pay extra. After we went one week without power following the 2011 Alabama tornado outbreak, I looked into building my own system with cheap China-made collectors. I finally decided that it wasn’t worth several thousand dollars to collect enough energy to power only a refrigerator and a couple of light bulbs.

I encourage you to read the problems other people see with the idea, posted above. I agree we need to be investigating alternative sources of energy, but I can confidently predict this is an idea that is going nowhere. And as long as we keep spending money on stupid ideas, it takes that money away from funding more deserving ideas.
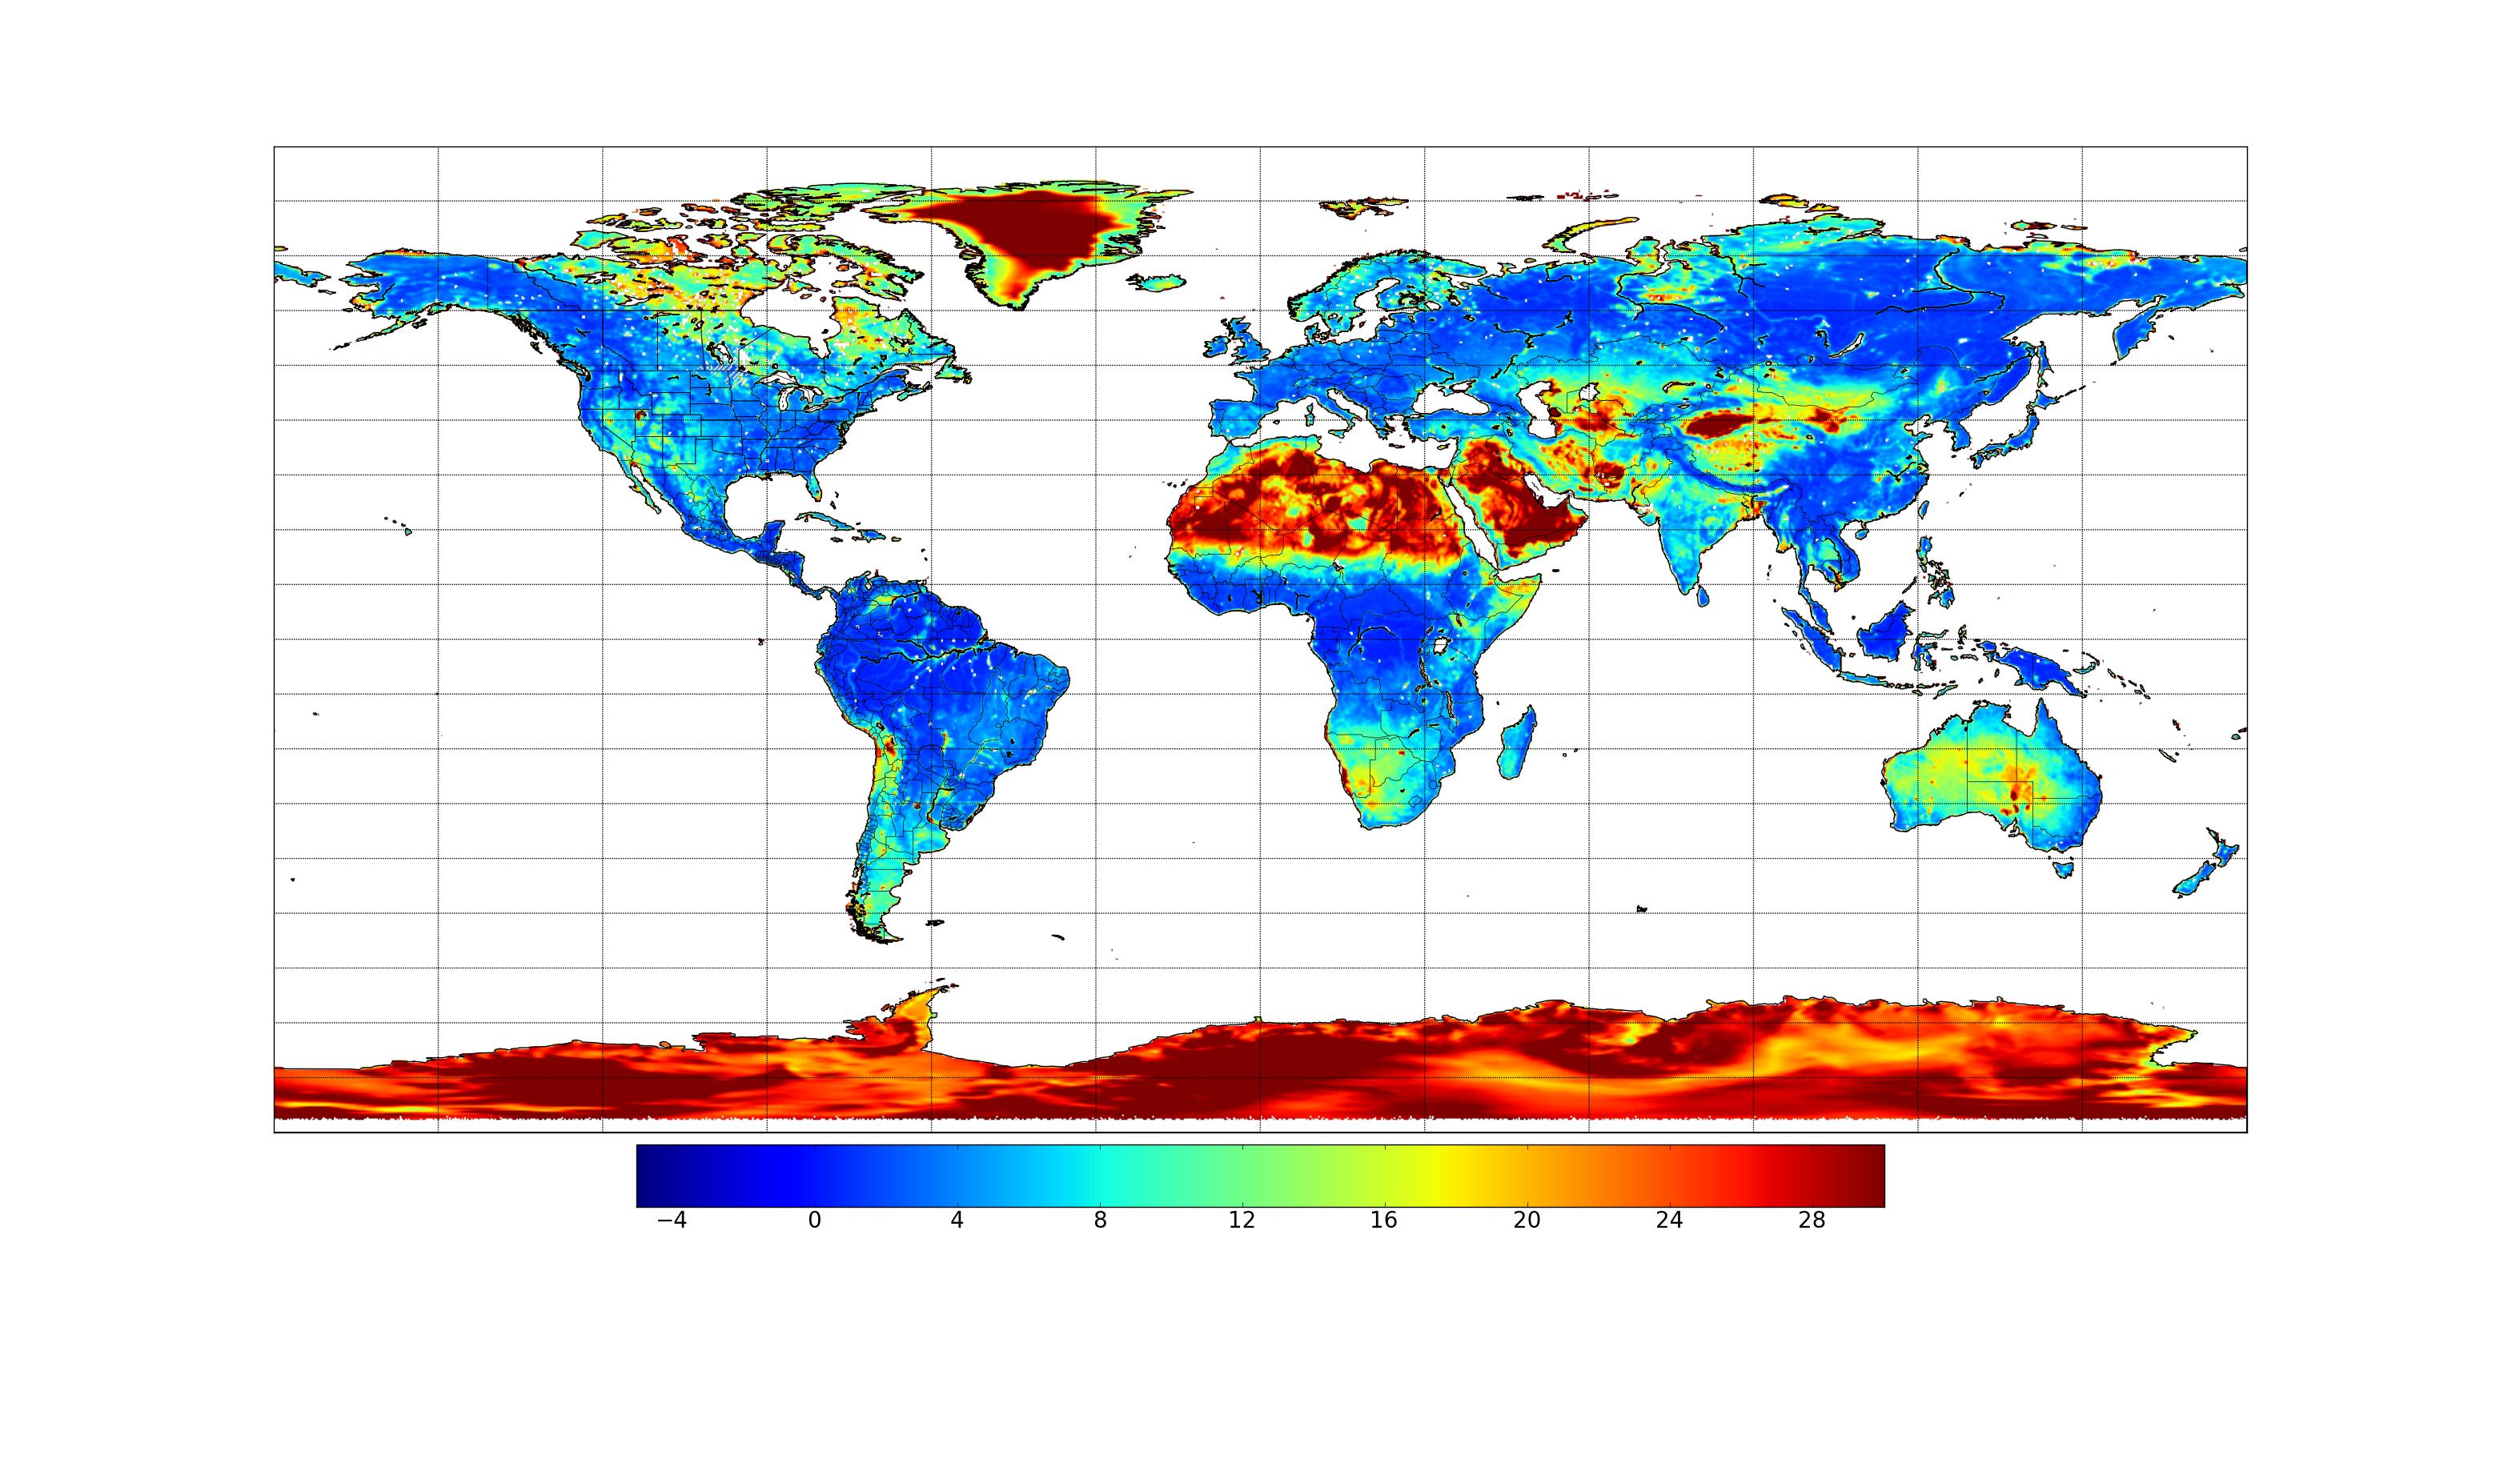
Spectacular Eruption of Sangeang Api Volcano (Indonesia)

Saturday, May 31st, 2014

Yesterday’s eruption of the Sangeang Api volcano in the Sundra Islands produced an ash cloud which appears to have reached the stratosphere, a necessary (but not sufficient) condition for it to temporarily cool the climate system.

A NASA MODIS satellite image of the eruption shows the ash cloud drifting southeastward toward Australia, where all flights from Darwin have been grounded:

NASA Terra MODIS imagery of the Sangeang Api eruption in Indonesia.

NASA Terra MODIS imagery of the Sangeang Api eruption in Indonesia.

Details of the eruption can be found here. This backlit photo shows the anvil-type structure which supports the view that the plume has reached the lower stratosphere (Photo credit Courtney Robba, Dunia Baru):
Sangeang-Api-eruption-1

Here’s another spectacular photo:
Sangeang-Api-eruption-2

I have not yet seen any estimates of the sulfur output from the eruption, which is what will determine its potential to reduce incoming sunlight and cause cooling. I suspect it will be nowhere near the Pinatubo eruption of 15 June 1991, which produced 20 million tons of SO2.

Yes, I Do Publish Papers, Too

Tuesday, May 27th, 2014

I don’t necessarily keep things up to date on my blog, since I don’t have George Soros underwriting my blogging efforts.

I had a comment that my publication record seems rather limited, so I’ve updated my Research Articles page with the following:

These are the ~30 most climate-relevant peer-reviewed papers I have authored or co-authored. I have many more that are weather-related or satellite remote-sensing related. I will add links as I find time.

  • Spencer, R.W., and W.D. Braswell, 2014: The role of ENSO in global ocean temperature changes during 1955-2011 simulated with a 1D climate mode. Asia-Pac. J. Atmos. Sci., 50(2), 229-237.
  • Spencer, R. W., and W. D. Braswell, 2011: On the misdiagnosis of surface temperature feedbacks from variations in Earth’s radiant energy balance. Remote Sens., 3, 1603-1613; doi:10.3390/rs3081603
  • Spencer, R. W., and W. D. Braswell, 2010: On the diagnosis of radiative feedback in the presence of unknown radiative forcing. J. Geophys. Res., 115, doi:10.1029/2009JD013371
  • Spencer, R.W., and W.D. Braswell, 2008: Potential biases in cloud feedback diagnosis: A simple model demonstration, J. Climate, 23, 5624-5628.
  • Spencer, R.W., 2008: An Inconvenient Truth: blurring the lines between science and science fiction. GeoJournal (DOI 10.1007/s10708-008-9129-9)
  • Spencer, R.W., W.D. Braswell, J.R. Christy, and J. Hnilo, 2007: Cloud and radiation budget changes associated with tropical intraseasonal oscillations. J. Geophys. Res., 9 August.
  • Christy, J.R., W.B. Norris, R.W. Spencer, and J.J. Hnilo, 2007: Tropospheric temperature change since 1979 from tropical radiosonde and satellite measurements. J. Geophys. Res., 112, D06102, 16 pp.
  • Spencer, R.W., J.R. Christy, W.D. Braswell, and W.B. Norris, 2006: Estimation of tropospheric temperature trends from MSU channels 2 and 4. J. Atmos. Ocean. Tech, 23, 417-423.
  • Ohring, G., B. Wielicki, R. Spencer, B. Emery, and R. Datla, 2005: Satellite instrument calibration for measuring global climate change. Bull. Amer. Meteor. Soc., 1303-1313.
  • Lobl, E.E., and R.W. Spencer, 2004: The Advanced Microwave Scanning Radiometer for the Earth Observing System (AMSR-E) and its products. Italian Journal of Remote Sensing, 30/31, 9-18.
  • Kawanishi, T., T. Sezai, Y. Ito, K. Imaoka, T. Takeshima, Y. Ishido, A. Shibata, M. Miura, H. Inahata, and R.W. Spencer, 2003: The Advanced Microwave Scanning Radiometer for the Earth Observing System (AMSR-E), NASDA’s contribution to the EOS for Global Energy and Water Cycle Studies. IEEE Trans. Geosys. Rem. Sens., 41, 184-194.
  • Christy, J.R., R.W. Spencer, W.B. Norris, W.D. Braswell and D.E. Parker. 2003: Error Estimates of Version 5.0 of MSU–AMSU Bulk Atmospheric Temperatures. Journal of Atmospheric and Oceanic Technology: 20, pp. 613-629.
  • Robertson, F.R., R.W. Spencer, and D.E. Fitzjarrald, 2001: A new satellite deep convective ice index for tropical climate monitoring: Possible implications for existing oceanic precipitation datasets. Geophys. Res. Lett., 28-2, 251-254.
  • Imaoka, K., and R.W. Spencer, 2000: Diurnal variation of precipitation over the tropical oceans observed by TRMM/TMI combined with SSM/I. J. Climate, 13, 4149-4158.
  • Christy, J.R., R.W. Spencer, and W. D. Braswell, 2000: MSU tropospheric temperatures: Dataset construction and radiosonde comparisons. J. Atmos. Ocean. Tech., 17, 1153-1170.
  • Spencer, R.W., F. J. LaFontaine, T. DeFelice, and F.J. Wentz, 1998: Tropical oceanic precipitation changes after the 1991 Pinatubo Eruption. J. Atmos. Sci., 55, 1707-1713.
  • Wentz, F.J. and R.W. Spencer, 1998: SSM/I rain retrievals within a unified all-weather ocean algorithm. J. Atmos. Sci., 55, 1613-1627.
  • Christy, J.R., R.W. Spencer, and E.S. Lobl, 1998: Analysis of the merging procedure for the MSU daily temperature time series. J. Climate, 11, 2016-2041.
  • Spencer, R.W., and W.D. Braswell, 1997: How dry is the tropical free troposphere? Implications for global warming theory. Bull. Amer. Meteor. Soc., 78, 1097-1106.
  • Spencer, R.W., J.R. Christy, and N.C. Grody, 1996: Analysis of “Examination of ‘Global atmospheric temperature monitoring with satellite microwave measurements. Climatic Change, 33, 477-489.
  • Spencer, R.W., 1994: Oceanic rainfall monitoring with the microwave sounding units. Rem. Sens. Rev., 11, 153-162.
  • Spencer, R.W., 1994: Global temperature monitoring from space. Adv. Space Res., 14, (1)69-(1)75.
  • Spencer, R.W., 1993: Monitoring of global tropospheric and stratospheric temperature trends. Atlas of Satellite Observations Related to Global Change, Cambridge University Press.
  • Spencer, R.W., 1993: Global oceanic precipitation from the MSU during 1979-92 and comparisons to other climatologies. J. Climate, 6, 1301-1326.
  • Spencer, R.W., and J.R. Christy, 1993: Precision lower stratospheric temperature monitoring with the MSU: Technique, validation, and results 1979-91. J. Climate, 6, 1301-1326.
  • Spencer, R.W., and J.R. Christy, 1992a: Precision and radiosonde validation of satellite gridpoint temperature anomalies, Part I: MSU channel 2. J. Climate, 5, 847-857.
  • Spencer, R.W., and J.R. Christy, 1992b: Precision and radiosonde validation of satellite gridpoint temperature anomalies, Part II: A tropospheric retrieval and trends during 1979-90. J. Climate, 5, 858-866.
  • Spencer, R.W., J.R. Christy, and N.C. Grody, 1990: Global atmospheric temperature monitoring with satellite microwave measurements: Method and results, 1979-84. J. Climate, 3, 1111-1128.
  • Spencer, R.W., and J.R. Christy, 1990: Precise monitoring of global temperature trends from satellites. Science, 247, 1558-1562.

Solar Roadways Project: A Really Bad Idea

Tuesday, May 27th, 2014

solar-roadways-snow-melt
This Solar Roadways project started showing up in my Facebook news feed, and seems to be getting a lot of popular support.

Except, I’m guessing, from actual engineers.

The idea that we can convert our roadway surfaces to electrical generation solar collectors has numerous practical problems. In fact, I don’t see how anyone with an engineering background could have seriously entertained the idea.

Here are a few of the problems which first came to my mind. (Joel Anderson at Equities.com, who calls the Solar Roadways idea “really silly”, has a few more of his own).

1. You can’t point the roadway to track the sun, to improve energy generation efficiency (which is only about 15% for photovoltaics, anyway, which makes PV generation expensive on a large scale).

2. Why embed solar panels in such a harsh environment where they are constantly being run over and flexed by millions of tons of vehicles? There are many more practical locations to use (such as roofs, that face southward).

3. How do you keep the solar collectors clean (as millions of tires scrub over them, and engines drip oil on them) so that sunlight can get collected by the embedded PV surfaces?

4. Who is going to actually PAY for such an obscenely expensive enterprise (other than government, which means you, the taxpayer)?

Furthermore, the above photo really has me suspicious. The photo supposedly shows the “active” portion of a solar parking lot melting snow. Say WHAT?….here’s a little lesson in thermodynamics. A dark surface heated by the sun converts essentially all of the absorbed sunlight into heat energy…which is what is needed to melt snow. If you instead siphon off some of the absorbed solar energy in the form of electricity, there is actually LESS heat energy to melt snow!

So, unless someone can correct me, something here smells fishy. And I’m being polite.

The Solar Roadways project is run by a couple who have been soliciting donations at the Indiegogo.com crowd funding website. Last I looked, it was approaching $1.4 Million(!) Not bad for a mom-and-pop operation.

Obviously, I work in the wrong field.

See my follow-up post: Why are solar freakin’ roadways so freakin’ popular?

Greening of Planet Earth: A Little Crowdsourcing Project

Friday, May 23rd, 2014

It has been documented that global warming has been accompanied by a general greening of land areas in recent decades, especially those which are semi-arid. While some areas of greening might be attributable to increased rainfall, carbon dioxide fertilization and longer growing seasons are also involved.

The satellite studies have been based upon visible sensor data that measures greenness. Heres the result of one recent study, which tried to just isolate the greening from CO2 fertilization (click image for full res version):

Estimated changes in vegetative cover due to CO2 fertilization between 1982 and 2010 (Donohue et al., 2013 GRL).

Estimated changes in vegetative cover due to CO2 fertilization between 1982 and 2010 (Donohue et al., 2013 GRL).

But we can also use passive microwave imager data, the best calibrated version of which is available since mid-1987 from the SSM/I and SSMIS series of instruments flying on the DMSP satellites. This gives us 26 years of microwave imager data to examine.

The simplest microwave vegetation index is just a difference between the vertically polarized and horizontally polarized channel brightness temperatures at 37 GHz. This polarization difference [V-H] can be thought of as primarily a measure of surface roughness. In heavily vegetated areas, such as Amazonia and the Congo Basin, the difference approaches zero, while sandy deserts and ice sheets are moderately polarized, as seen in the 26 year average of all Augusts (peak vegetation month in the Northern Hemisphere, click image for full-res version):

Average 37 GHz polarization difference for all Augusts between 1987 and 2013. Oceans and large water bodies have been made white.

Average 37 GHz polarization difference (deg. C) for all Augusts between 1987 and 2013. Oceans and large water bodies have been made white.

We have zeroed out the ocean areas because the image gets too messy to interpret, although I will say it showed signatures consistent with the decrease in Arctic sea ice, and increase in Antarctic sea ice.

If we compute the land gridpoint trends across all 26 Augusts, the image looks like this (note the color scale does not match the published greenness trend image above, click image for full-res version):

26-year trends in 37 GHz [V-H] (deg. C per year) for the period 1987-2013.

26-year trends in 37 GHz [V-H] (deg. C per year) for the period 1987-2013.

Note the strong signature of more vegetation in the Sahel and Kalahari Desert regions of Africa, similar to the Donohue et al. study. Significant increases are also suggested in India, Australia, and over the extreme northern reaches of North America and Asia. I have no explanation for the apparent increased roughness signature of the Greenland ice sheet (I’m pretty sure it’s not yet grassland, ha-ha).

There are also many, spotty areas of apparent decreases in vegetation cover (red). I have no idea what these correspond to, so Im asking readers if they have knowledge of any of these areas (clicking on the above images will bring up the full-size versions). The red areas might also be regions of greater soil surface wetness…there is no way to know with this simple 2-channel approach.

I would be careful about interpreting coastal areas.small geolocation errors in the satellite data combined with the huge [V-H] polarization differences between land and ocean, can cause spurious signals there.

Also, at this microwave frequency (37 GHz) a forest canopy isnt going to look much different from dense grass. Think of the 37 GHz [V-H] measurement as an indication of how much soil surface (or highly polarized rivers) is visible through breaks in the vegetation.its not really a measure of total biomass, unless the vegetation is quite sparse. So, deforestation in Amazonia isn’t necessarily going to show up if forest is replaced by crops, weeds, and shrubs. The nominal resolution of the microwave imagery above is 25 km, at best.

Again, the above microwave imagery is only for August. This was a LOT of full-resolution satellite data that Danny Braswell downloaded from NCDC, and it was not a trivial effort to do the calculations. We just thought that the public might be able to give us some idea if any of these signatures merit further investigation.

I’ll see your 97 percent, and raise you 3 percent

Wednesday, May 21st, 2014

The meme that 97% of climate scientists believe global warming is, well, apparently whatever you want them to believe, is getting really annoying. John Kerry is so clueless about this issue it’s downright embarrassing. Does he really think we can do something that will measurably affect global temperatures without killing millions of poor people in the process? Really?

Or maybe that’s the ultimate goal?

As a published climate scientist myself, I would wager that 97% of climate scientists can’t agree on anything.

Except maybe it’s warmer now than 100 years ago (so what? I’ll agree to that).

Or, that humans are at least partly responsible for some of that warming (so what? I’ll agree to that, too).

But I think a more significant statistic — one that doesn’t rely on opinions, but on facts — is that 100% of climate scientists don’t know how much of the warming in the last 50-100 years is natural versus human-caused.

They dance around this issue with weasel words and qualitative language. Because they don’t know. They can say “most” warming is human caused…but how do they know that? They don’t.

You see, we have no idea how much natural climate variations figure into the climate change equation.

For example, this proxy reconstruction of past temperatures suggests climate change is the rule, not the exception:

Ljungqvist-2000-yrs-temp-reconstruction

And this is the stumbling block that will be in everyone’s way until we understand and quantify the causes of natural climate change.

A majority of climate scientists (60%, 80%, or even 97%) might “believe” this or that, but until they figure out just how much of climate change is naturally-induced, we will never know how much is due to humans. All that statistic measures is how inbred the climate research community has become.

And since there is no fingerprint of human- versus natural-caused warming, we might never know the answer to this central question. We might have to just sit back and watch where global temperature go from now on.

And if the climate models are ever going to be proved correct, dramatic warming is going to have to get started pretty darn soon.

The Bullying of Bengtsson and the Coming Climate Disruption Hypocalypse

Friday, May 16th, 2014

flooded-libertyLennart Bengtsson being bullied by colleagues is only the latest example of bad behavior by climate scientists who have made a deal with the devil. They have exchanged their scientific souls for research grants, prestige, and easy access to scientific journals to publish their papers.

I predict history will not treat them kindly, and the reputation of all climate scientists will be tarnished in the process. As it is, the public who pays our salaries are already laughing at us.

Some of us (Christy, Lindzen, myself and others) have put up with many years of unfair treatment by a handful of activist gate-keeping colleagues who stopped our papers from being published or proposals from being funded, sometimes for the weakest of reasons.

Sometimes for entirely made-up reasons.

What makes the Bengtsson case somewhat unusual is his high profile. A Director at ECMWF. Then Max Planck Institute. He was at ECMWF when that organization became the top weather forecasting center in the world. He knows the importance of models providing good forecasts, with demonstrable skill — exactly what the climate models do not yet provide.

That climate models do NOT provide good forecasts with demonstrable skill should concern everyone. But as Bengtsson has found out, a scientist advertises this fact at their peril.

Bengtsson has always been a little skeptical, as all good scientists should be. After all, most published science ends up being wrong anyway.

But once he became more outspoken about his skepticism, well…that’s just unacceptable for someone of his stature. That his treatment should lead him to worry about his health and his safety tells us a lot about just how politicized global warming research has become.

This bad behavior by the climate science community is nothing new. It’s been going on for at least 20 years.

I have talked to established climate scientists who are afraid to say anything about their skepticism. In hushed tones, they admit they have to skew the wording of papers and proposals to not appear to be one of those “denier” types.

At least in the U.S., politicians are the ones who started this mess — Eisenhower predicted “public policy could itself become the captive of a scientific-technological elite” — and they have the power to put an end to it.

They started it by purposely funding research that had the ultimate goal of increasing the power and influence of government over the private sector by accomplishing favored regulatory goals. Agency heads who are political appointees installed managers under them who would be team players. I’ve told the story of meeting with V.P. Gore’s environmental science adviser in the early 1990s who confided that, now that they had successfully regulated the manufacture of CFCs, carbon dioxide was next. The IPCC was being formed to make that happen, by enlisting scientists who would be guided by politicians and government representatives.

This is no conspiracy theory. This was mostly done out in the open, for all to see.

Politicians can fix this. Probably not by just calling hearings and witnesses, through, which will admittedly raise public awareness of the problem. But by telling the funding agencies that some percentage (say, 20%) of their climate research funding must go toward studying the 800 lb gorilla in the room: Natural sources of climate change.

As I have always said, if you fund scientists to find evidence of something, they will be happy to find it for you. For over 20 years we have been funding them to find evidence of the human influence on climate. And they dutifully found it everywhere, hiding under every rock, glacier, ocean, and in every cloud, hurricane, tornado, raindrop, and snowflake.

So, just tell scientists 20% of their funds will be targeted for studying natural sources of climate change. They will find those, too.

It’s not like they will have to look very hard. The 17 year hiatus in warming, which no one predicted, and which the climate models can’t even explain, tells us that Mother Nature is also involved in climate change.

If nature can cause enough global cooling to cancel out anthropogenic warming, it can also cause global warming. It must, because natural changes are cyclical.

I think we might be seeing the death throes of alarmist climate science. They know they are on the ropes, and are pulling out all the stops in a last ditch effort to shore up their crumbling storyline.

Since the public doesn’t really care anymore, they have to shout even louder. Exaggerate even more.

The latest example is the highly speculative theory that, after only 40 years of watching an Antarctic glacier, we have a few scientists extrapolating out to 200 to 1,000 years a “collapse” of a portion of the ice sheet. The media presents it as something that sounds imminent and unavoidable. Governor Brown then says it will inundate LAX airport, even though at 125 ft elevation, the greater threat to LAX is probably sliding into the ocean from a mega-earthquake, or an invasion by extraterrestrials.

Unfortunately, now every tornado and El Nino in the coming months will be pointed to as proof positive they were “right” all along….as if those events didn’t happen before we started driving SUVs. The news media, filled with frustrated creative writers who are trying to change the world, will be only too happy to hype a screenplay-worthy storyline around the latest science claim by some obscure activist scientist.

So, be prepared. The climate disruption hypocalypse is coming. True, it’s man-made…but it only exists in our imaginations and on the movie screen.

Yes, Ben Adler, there are liberal equivalents to climate change denial

Friday, May 9th, 2014

Honestly….these are supposed to be the smartest people in the room?

Ben Adler at Grist has an article entitled “Why there is no liberal equivalent to climate change denial“. He builds upon arguments from Paul Krugman that conservatives have a way of denying facts that liberals don’t when it comes to supporting their ideological beliefs.

It’s a clever argument, and I’m sure it will convince many weak minds. I have to wonder whether Adler and Krugman are also convinced of what they write.

What they have done is basically redefined the term “fact” to be anything that Liberals believe is an established fact.

I’m going to set aside their examples of creation-vs-evolution, or the optimum marginal tax rate, or whether conservatives only want smaller government but liberals want improved social welfare. Instead, I’ll just get to Adler’s central claim that there is no liberal equivalent to “climate change denial”.

Of course there are liberal equivalents. For example, here are seven that immediately come to mind:

1) natural climate change denial

2) denial that coal and petroleum work better than unicorn farts as fuels,

3) denial that a small amount of warming is better than killing millions of poor people by restricting access to inexpensive energy,

4) denial that the human-induced component of climate change is anything but catastrophic and an emergency,

5) denial that an increasing number of scientists are becoming skeptics,

6) denial that IPCC scientists were caught red-handed trying to silence the opposition and “hide the decline”,

7) denial of the observations, which show much less warming than any of the climate models can explain over the last 30+ years.

I’m sure I could think of more, but I don’t like to waste any more time than necessary answering such silly claims.

For supposedly being able to understand nuances, these guys can’t admit that most conservatives really do believe that humans have some influence on climate. We just don’t think the scientific and economic evidence supports spreading more misery around the globe than liberal policies have already created.

Record Lake Superior Ice Cover Still 31%

Friday, May 9th, 2014

MODIS satellite imagery of Lake Superior on May 6, 2014.

MODIS satellite imagery of Lake Superior on May 6, 2014.


With 31% ice coverage today (May 9, 2014), Lake Superior now has more ice than after the epic cold winter of 1978-79, which had everyone in a tizzy over the coming Ice Age. Here’s a plot of how the various winters played out between 1973 and 2002, and where Superior ice cover stands today…it shows that by today’s date in most years, the ice was long gone:

Lake-Superior-ice-1973-2002-vs-2014

Good ice records only began in 1973 because that was the first year we had high-resolution satellite imagery, from the first Landsat satellite. It will be very interesting to see if there is still some ice left in early June.

In the 1970s, cold winters were a sign of a cold climate. Of course, now we know that cold winters are a sign of a hot climate. Scientists can be so silly at times.

Oh, I almost forgot! In only 6 weeks, the days start getting shorter again! 😉

U.S. Snowfall to decrease by 50% in 50 years!

Thursday, May 8th, 2014

Following the release of the latest U.S. National Climate Assessment report, a new climate forecast visualization widget has just gone live today.

The National Climate Change Viewer (NCCV) allows you to visualize how climate models forecast temperature and precipitation to change over the next 50 years or so. You can examine either individual model’s projections, or the average of all of the models’ projections.

I just started playing with it, and the first thing that really that caught my eye was the dramatic decrease in total snowfall: a 50% decrease over the next 50 years, pretty much independent of calendar month. Here’s the graphic (click for larger versions of images):
NCCV-snowfall-decrease

Note the largest decreases are in the mountainous areas of the west (where they get a lot of snow anyway), as well as over the Great Lakes and Northeast. It would be helpful if they also provided an option to plot the percentage change…a decrease of 10 inches of seasonal snowfall is a bigger deal in Iowa than it is in the mountains.

The forecast change in temperature just shows an almost uniformly red map (work on the color scales, guys) with the models forecasting generally 4 to 8 deg. F of warming for most of the U.S., in both daily maximum and minimum temperatures. Here’s the max temperature change graphic:
NCCV-Tmax-increase

I’ve previously posted about the huge disconnect that is shaping up between the USHCN temperatures observed over the Midwest during the growing season and the climate model projections…eek!….
Corn-belt-CMIP5-models-vs-USHCN-temps

Setting aside the likely exaggerated forecast trends, the visualization tool, from the USGS and Oregon State University, is pretty cool, and is a useful public outreach tool for the science-savvy public. I’m sure they will improve it over time. Check it out.