
 Home/Blog
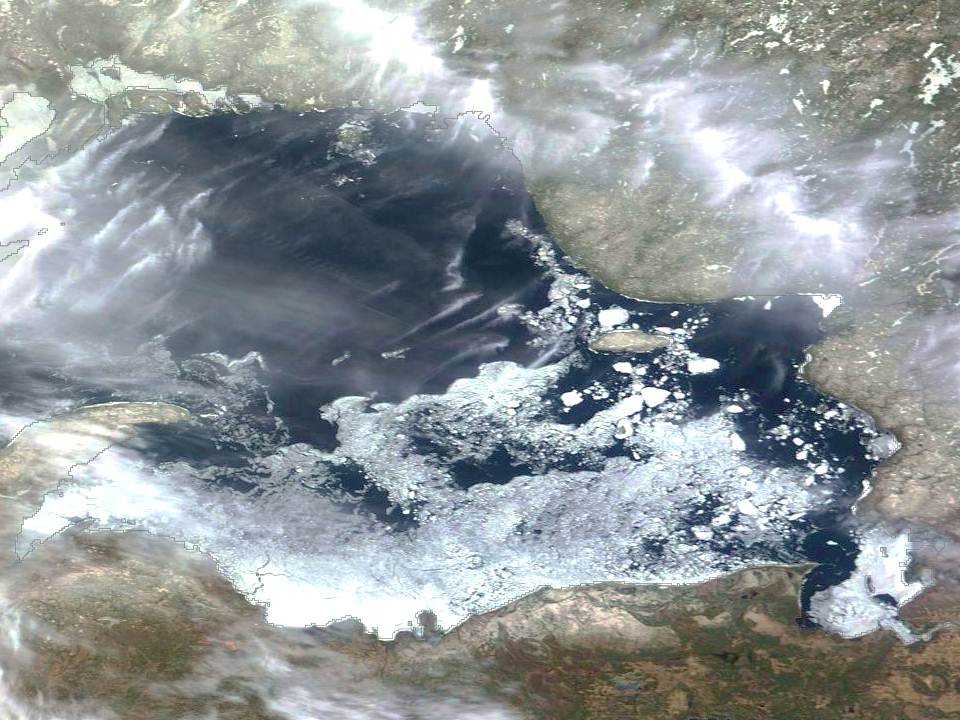
MODIS satellite imagery of Lake Superior on May 6, 2014.
With 31% ice coverage today (May 9, 2014), Lake Superior now has more ice than after the epic cold winter of 1978-79, which had everyone in a tizzy over the coming Ice Age. Here’s a plot of how the various winters played out between 1973 and 2002, and where Superior ice cover stands today…it shows that by today’s date in most years, the ice was long gone:
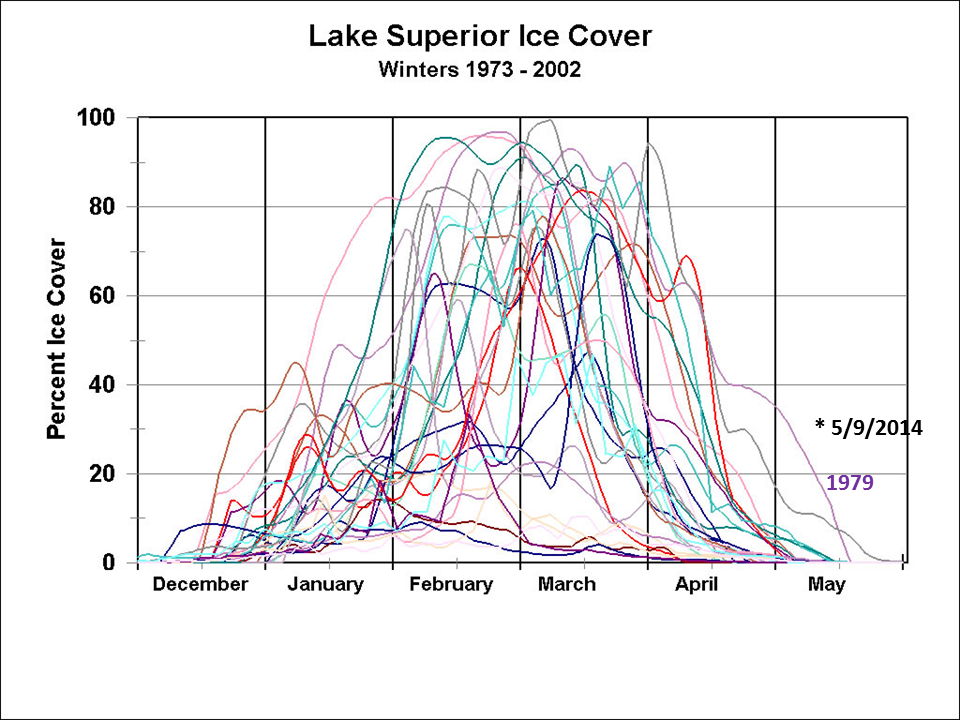
Good ice records only began in 1973 because that was the first year we had high-resolution satellite imagery, from the first Landsat satellite. It will be very interesting to see if there is still some ice left in early June.
In the 1970s, cold winters were a sign of a cold climate. Of course, now we know that cold winters are a sign of a hot climate. Scientists can be so silly at times.
Oh, I almost forgot! In only 6 weeks, the days start getting shorter again! 😉


