Archive for June, 2013

Update on EnviroMission’s Arizona Solar Tower Project

Thursday, June 27th, 2013

enviromission-solar-tower-arizona-power
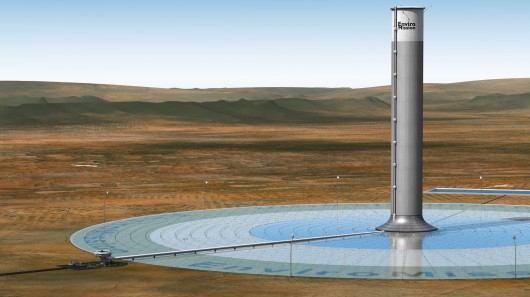
Yesterday I spoke with EnviroMission President Chris Davey to get an update on the progress of the first, large-scale solar tower (aka solar updraft tower, or solar chimney). EnviroMission is progressing through the permitting process and plans to start construction late next year in La Paz County, Arizona.

Billed as a 200 MW electrical generation facility, its towering hot air chimney will be about 2,600 ft tall, making it the second tallest manmade structure in the world, and about twice as high as the Empire State Building.

enviromission-solar-tower-arizona-power-0

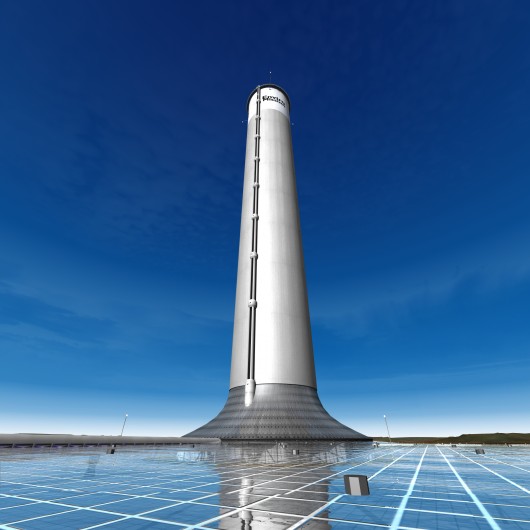
What has always captured my imagination about the concept is that it uses the daily generation of warm air at the surface by the sun to generate electricity. It takes the familiar principle of a chimney filled with buoyant, hot air to the extreme. The taller and wider the tower, and the hotter the air it contains, the greater the potential for energy generation. The solar heated air in the tower continuously draws air into the 2.5+ mile wide glass/plastic canopy and through approximately 32 wind turbines, each rated at 6.25 MW, circling the base of the tower.
lapaz_img1-550x301

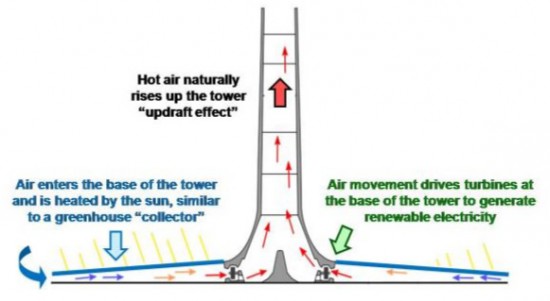
Now, all of this hot air would have been generated anyway, without the solar tower there. But it would have driven turbulently mixed thermals as pockets of buoyant hot air rise and gradually warm the lower troposphere during the daytime. The solar tower simply organizes all of this buoyant energy into a single updraft, which will drive a fairly continuous 30 knot wind through the 32 turbines.

One advantage of this design over conventional solar is since the ground will absorb much of the heat, electricity generation will continue at night as the ground gives up that heat, and the outside ambient air temperature cools by about 30 deg. F, helping to maintain buoyancy in the tower.

Design details are still being optimized by industry leader Arup Engineering, based in the UK. Mr. Davey mentioned a couple of the remaining design uncertainties, such as what material to use for the canopy (tempered glass or some kind of plastic); easy servicing of the clear panels is very important.

The facility requires no water for cooling, a significant advantage, and is designed to last for decades. I forgot to ask about the anticipated effects of wind loading on a tower that tall, but Mr. Davey said there are no major design problems with the facility.

Here’s a pretty cool computer animation video which was made back when the tower height was anticipated to be 1,000 m, rather than 800 m. From what I understand, EnviroMission is also negotiating solar tower projects in Texas, and a few foreign countries, as well.

(Any errors, misrepresentations, or misrememberings in the above are my own.)

Obama’s Boutique Energy Plan Hurts the Poor

Wednesday, June 26th, 2013

Since I’m getting asked to comment on the President’s speech, I guess it’s time for a little detour from science into policy. If you don’t like me mixing science and policy, go complain to Al Gore or Joe Romm or Jim Hansen or Gavin Schmidt or Michael Mann or the American Meteorological Society or the American Geophysical Union or the American Physical Society…or the President himself.

Oh, I could go into the President’s appeal in his address today to those who don’t know any better…that severe weather is supposedly worse due to global warming. Sorry, but by almost all objective measures, severe weather hasn’t gotten worse (storm damage costs increase over time, but that increase isn’t due to weather; Sandy-type storms have always occurred, and always will…they just hardly ever hit a major metropolitan area).

Or, I could go into the silliness of his equating carbon dioxide (which is necessary for life on Earth) to poisonous chemicals like arsenic and mercury.

Or maybe his swipe at skeptics as flat-Earthers, even though most, if not all, of us DO believe that humans influence climate to some extent. (I thought he understood “nuance”?) But all of these things have been addressed by me and others before in considerable detail.

Or his cherry-picking of data. Yes, even our satellite measurements of lower atmospheric temperatures over the U.S. registered record warmth in 2012. But John Christy also tells me our measurements for Australia (similar in size to the U.S.) in 2012 were below normal.

And our tropical tropospheric temperatures (where almost 50% of Earth’s sunlight is absorbed) have a 34-year temperature trend which is not statistically different from zero, in stark contrast to 73 state-of-the-art climate models.

Unfortunately, our President reminds me of a Hollywood star who thinks we can wave a magic wand and create abundant renewable energy if we just try a little harder. A few years ago I debated Daryl Hannah on TV down in Cancun during an IPCC climate conference. I was impressed with her knowledge of the pros and cons of various renewable energy strategies.

But after we were done filming, she told me, basically, “we just need to switch over to wind and solar right now”.

Excuse me? I’m sorry, I guess I was assuming too much regarding this Hollywood actress’s knowledge of basic physics.

It doesn’t matter how badly you want renewable energy to replace fossil fuels and nuclear, there are a few obstacles to overcome, akin to “you can’t get something from nothing”.

Wind, solar, and biomass all have very low energy densities compared to fossil fuels or nuclear, which are very dense concentrations of energy. Generating a substantial (i.e. realistic) amount of renewable energy is VERY expensive in materials and land. How many poor kids you want to take food and medical care from to pay for it?

Plus, for wind and solar, it isn’t always there when you need it (at night, when it’s cloudy, when the wind doesn’t blow). So, it has to be backed up with fossil fuels anyway.

Punishing our most cost effective forms of energy (as the President and the EPA want oh-so-badly to do) just further deepens our economic downturn. If the President really is concerned about “the children” maybe he should examine what really hurts the children – poverty.

Affordable, abundant energy is required to generate wealth, and without wealth, you can’t help those who can’t help themselves. I thought that’s what our President wanted to do..help the poor? But how can we do that if we punish the wealth generators at every turn?

In fact, I can’t imagine a better plan for purposely destroying the economy. Strike it at its heart, the availability of abundant low-cost energy.

Until we come up with affordable and widely deployable renewable energy sources, a war on fossil fuels is a war on the poor. Basic Economics 101. Wealth diverted to wasteful projects (or wealth destroyed) is no longer available for more deserving projects.

Yes, we need to continue renewable energy research, since fossil fuels won’t last forever. But you cannot simply legislate (or as Obama wants to do, regulate, without approval from Congress or the electorate) new forms of energy into existence.

The question is, how do we get from here to there? Now that we are finding global warming is, at worst, progressing at only 50% the rate predicted, we have time to be smart about it (assuming it’s entirely our fault and bad for life on Earth, which I’m not convinced of. Carbon dioxide is just as necessary for life as oxygen, yet it is over 500 times less abundant).

This isn’t a science fiction movie we are living in. I’m afraid the low-information voter won’t “get it” until we have brownouts and blackouts. As more coal-fired power plants are shut down, that day is fast approaching.

Or maybe the economy will be so weak we won’t need all that extra energy anyway.

Who Dares to Deny Arctic Warming?

Monday, June 17th, 2013

polar-bear-heat
A polar bear which collapsed from heat exhaustion before it could be shot.

I have in my possession a copy of one of the most authoritative books ever written on Arctic sea ice, including a section on the warming of the Arctic. It is written by one of the pioneering researchers in Arctic sea ice, N.N Zubov, a Russian, who spent his career studying the Arctic region.

His observations of warming in the Arctic, which he described as not localized, but universal, are taken from his book entitled Arctic Ice. I have excerpted several pertinent passages, which I’m sure will convince you that warming of the Arctic can scarcely be denied:

Along with the fluctuations in ice abundance in each individual sea from year to year, in late years a most interesting phenomenon has been observed – a warming of the Arctic, as evidence by a gradual and universal decrease in ice abundance. The main evidence of this general warming of the Arctic are:

1. Receding of glaciers and “melting away” of islands….all the Greenland glaciers which descend into Northeast Bay and Disko Bay have been receding since approximately the beginning of the century. On Franz Joseph Land during recent years several islands have appeared as if broken in two. It turned out they had been connected up to that time by ice bridges. …I noted a great decrease in the size of (Jan Mayan and Spitzbergen) glaciers. Ahlman terms the rapid receding of the Spitzbergen glaciers “catastrophic”.

2. Rise of air temperature. (Over the last 20 years) the average temperature of the winter months has steadily increased…(in the last 10 years) in the whole Arctic sector from Greenland to Cape Chelyuskin there has not been a single (negative) anomaly of average annual and monthly winter temperatures, while the positive anomalies have been very high….

3. Rise in temperature of Atlantic water which enters the Arctic Basin…the temperature of surface water and of Gulf Stream water has steadily risen…

4. Decrease in ice abundance….15% to 20% (over 20 years)….In earlier times, polar ice often approached the shores of Iceland and interfered with fishing and navigation. For the past 25 years ice has not appeared in significant quantities.

5. Increase in speed of drift ice.

6. Change in cyclone routes. There is no doubt that the increase in air temperatures, increase in Atlantic water temperatures, intensification of ice drift, etc., are closely connected with an intensification of atmospheric circulation, and in particular with a change in cyclonic activity at high latitudes. Vize shows that Atlantic cyclones are now shifting considerably north, by several hundred km, from their courses in the period before the warming of the Arctic.

7. Biological signs of warming of the Arctic. …fish have ranged further and further to the north…cod in large quantities have appeared along the shores of Spitzbergen and Novaya Zemlya…also mackerel, dolphin where formerly were not found…during recent years fishing has gradually shifted into the Arctic waters, and this unquestionably must be ascribed in considerable degree to the warming of these waters….many heat-loving bottom organisms are now found in regions these organisms were not found (30 years ago). Knipovich says: “ In a matter of fifteen years…there occurred a change…such as is usually associated with long geological intervals”.

8. Ship navigation. …a number of ship voyages (were made) which could hardly have been accomplished in the preceding cold period.

Still more remarkable is the fact that the warming of the Arctic is not confined to any particular region.

I find these observations to be quite compelling evidence that warming of the Arctic is indeed unprecedented. Who would dare deny it? Clearly, we must do something about our carbon dioxide emissions!!

NOTE: Oh, silly me. This book was written in the late 1930’s. Nevermind.

STILL Epic Fail: 73 Climate Models vs. Measurements, Running 5-Year Means

Thursday, June 6th, 2013

In response to those who complained in my recent post that linear trends are not a good way to compare the models to observations (even though the modelers have claimed that it’s the long-term behavior of the models we should focus on, not individual years), here are running 5-year averages for the tropical tropospheric temperature, models versus observations (click for full size):
CMIP5-73-models-vs-obs-20N-20S-MT-5-yr-means
In this case, the models and observations have been plotted so that their respective 1979-2012 trend lines all intersect in 1979, which we believe is the most meaningful way to simultaneously plot the models’ results for comparison to the observations.

In my opinion, the day of reckoning has arrived. The modellers and the IPCC have willingly ignored the evidence for low climate sensitivity for many years, despite the fact that some of us have shown that simply confusing cause and effect when examining cloud and temperature variations can totally mislead you on cloud feedbacks (e.g. Spencer & Braswell, 2010). The discrepancy between models and observations is not a new issue…just one that is becoming more glaring over time.

It will be interesting to see how all of this plays out in the coming years. I frankly don’t see how the IPCC can keep claiming that the models are “not inconsistent with” the observations. Any sane person can see otherwise.

If the observations in the above graph were on the UPPER (warm) side of the models, do you really believe the modelers would not be falling all over themselves to see how much additional surface warming they could get their models to produce?

Hundreds of millions of dollars that have gone into the expensive climate modelling enterprise has all but destroyed governmental funding of research into natural sources of climate change. For years the modelers have maintained that there is no such thing as natural climate change…yet they now, ironically, have to invoke natural climate forces to explain why surface warming has essentially stopped in the last 15 years!

Forgive me if I sound frustrated, but we scientists who still believe that climate change can also be naturally forced have been virtually cut out of funding and publication by the ‘humans-cause-everything-bad-that-happens’ juggernaut. The public who funds their work will not stand for their willful blindness much longer.

Global Microwave SST Update for May 2013: -0.01 deg. C

Wednesday, June 5th, 2013

The satellite-based microwave global average sea surface temperature (SST) update for May 2013 is -0.01 deg. C, relative to the 2003-2006 average (click for large version):
RSS_mwSST_2002_thru_May_2013

The anomalies are computed relative to only 2003-2006 because those years were relatively free of El Nino and La Nina activity, which if included would cause temperature anomaly artifacts in other years. Thus, these anomalies cannot be directly compared to, say, the Reynolds anomalies which extend back to the early 1980s. Nevertheless, they should be useful for monitoring signs of recent ocean surface warming, which appears to have stalled since at least the early 2000’s. (For those who also track our lower tropospheric temperature [“LT”] anomalies, these SST anomalies average about 0.20 deg. C cooler than LT since mid-2002, but there is considerable variability in that number).

The SST retrievals come from Remote Sensing Systems (RSS), and are based upon passive microwave observations of the ocean surface from AMSR-E on NASA’s Aqua satellite, the TRMM satellite Microwave Imager (TMI), and WindSat. While TMI has operated continuously through the time period (but only over the tropics and subtropics), AMSR-E stopped nominal operation in October 2011, after which Remote Sensing Systems patched in SST data from WindSat. These various satellite SST datasets have been carefully intercalibrated by RSS.

Despite the relatively short period of record, I consider this dataset to be the most accurate depiction of SST variability over the last 10+ years due to these instruments’ relative insensitivity to contamination by clouds and aerosols at 6.9 GHz and 10.7 GHz.

FLASH! Global warming causes record-wide tornadoes!

Tuesday, June 4th, 2013

El-Rino-OK-tornado-5-31-2013
Just thought I’d try to be the first the make the connection between the record wide (2.6 miles) EF5 tornado near Oklahoma City last Friday and Global Warming. (Click the above photo for the full story).

Of course, as I have discussed before, the missing ingredient in tornadoes is usually a cool air mass nearby. If warm humid air was the missing ingredient, the tropics would be filled with tornadic thunderstorms…which is not the case.

EPIC FAIL: 73 Climate Models vs. Observations for Tropical Tropospheric Temperature

Tuesday, June 4th, 2013

Courtesy of John Christy, a comparison between 73 CMIP5 models (archived at the KNMI Climate Explorer website) and observations for the tropical bulk tropospheric temperature (aka “MT”) since 1979 (click for large version):
CMIP5-73-models-vs-obs-20N-20S-MT
Rather than a spaghetti plot of the models’ individual years, we just plotted the linear temperature trend from each model and the observations for the period 1979-2012.

Note that the observations (which coincidentally give virtually identical trends) come from two very different observational systems: 4 radiosonde datasets, and 2 satellite datasets (UAH and RSS).

If we restrict the comparison to the 19 models produced by only U.S. research centers, the models are more tightly clustered:
CMIP5-19-USA-models-vs-obs-20N-20S-MT

Now, in what universe do the above results not represent an epic failure for the models?

I continue to suspect that the main source of disagreement is that the models’ positive feedbacks are too strong…and possibly of even the wrong sign.

The lack of a tropical upper tropospheric hotspot in the observations is the main reason for the disconnect in the above plots, and as I have been pointing out this is probably rooted in differences in water vapor feedback. The models exhibit strongly positive water vapor feedback, which ends up causing a strong upper tropospheric warming response (the “hot spot”), while the observation’s lack of a hot spot would be consistent with little water vapor feedback.

UAH Global Temperature Update for May 2013: +0.07 deg. C

Tuesday, June 4th, 2013

Our Version 5.5 global average lower tropospheric temperature (LT) anomaly for May, 2013 is +0.07 deg. C, down a little from +0.10 deg. C in April (click for large version):
UAH_LT_1979_thru_May_2013_v5.5

The global, hemispheric, and tropical LT anomalies from the 30-year (1981-2010) average for the last 17 months are:

YR MON GLOBAL NH SH TROPICS
2012 1 -0.134 -0.065 -0.203 -0.256
2012 2 -0.135 +0.018 -0.289 -0.320
2012 3 +0.051 +0.119 -0.017 -0.238
2012 4 +0.232 +0.351 +0.114 -0.242
2012 5 +0.179 +0.337 +0.021 -0.098
2012 6 +0.235 +0.370 +0.101 -0.019
2012 7 +0.130 +0.256 +0.003 +0.142
2012 8 +0.208 +0.214 +0.202 +0.062
2012 9 +0.339 +0.350 +0.327 +0.153
2012 10 +0.333 +0.306 +0.361 +0.109
2012 11 +0.282 +0.299 +0.265 +0.172
2012 12 +0.206 +0.148 +0.264 +0.138
2013 1 +0.504 +0.555 +0.453 +0.371
2013 2 +0.175 +0.368 -0.018 +0.168
2013 3 +0.183 +0.329 +0.038 +0.226
2013 4 +0.103 +0.120 +0.086 +0.167
2013 5 +0.074 +0.162 -0.013 +0.113

Diurnal Trends in Dewpoint Averaged over the U.S. Since 1973

Tuesday, June 4th, 2013

The Integrated Surface Hourly (ISH) weather data I have described before allows one to examine how various surface weather elements have changed as a function of time of day. (The ISH data volume is very large and it is not a trivial task to decode and analyze many years of it.) Three-hourly synoptic weather observations have been made at many U.S. weather stations for at least 40 years: 1973 seems to be the year when the number of stations reached a fairly large number, and so that is the year my analyses begin with.

I have previously mentioned that ISH surface data shows U.S. warming since 1973 (primarily a winter phenomenon, due to unusually cold winters in the 1970s), and a curious decrease in surface wind speed.

Here I’d like to point out another curiosity: while the dewpoint temperature has increased in step with air temperature at 12Z (around 6 a.m.), it has increased much less so at other times of the day, and even decreased slightly at 21Z (around 3 p.m.), during the period 1973-2012:
ISH-US-diurnal-trends

Assuming that dewpoint sensor design changes over the years have not introduced a diurnally varying measurement bias, a natural question arises: what would cause afternoon dewpoints to not rise in the face of warming both day and night? (Note I have not made any adjustments for sensor changes, siting changes, or urbanization in the above plot).

The first explanation that comes to my mind is a change in daytime convective mixing of the troposphere. If there is a slight increase in the depth of convective mixing, then drier (lower dewpoint) air aloft will be mixed down toward the surface. Such a change would probably also be associated with deeper moist convection and probably an increase in heavy rain rates, evidence for which has been claimed elsewhere (e.g. here). The implication of such a change for climate feedbacks is complicated and not obvious.

A second possibility is a long-term decrease in middle and upper tropospheric humidity, and no increase in convective mixing. In this case, daytime mixing would bring down the lower humidity air to the surface from the same altitude as before. There is some radiosonde evidence for such a decrease in absolute humidities above the turbulent boundary layer (e.g. Paltridge, 2009). If real, such a decrease might well result in negative water vapor feedback, since a small decrease in mid- and upper tropospheric humidity can have a natural radiative cooling effect which outweighs the warming from a larger increase in lower tropospheric humidity (e.g. Spencer and Braswell, 1997; Miskolczi, 2010). Of course, all climate models exhibit strongly positive water vapor feedback, approximately doubling the direct warming effect of increasing CO2 alone.

I don’t have a strong opinion on which of these possibilities (sensor problems, deeper convection, or a dryer mid- and upper troposphere) is more likely. Too little information, too many questions.